State & territory economic performance report
- How are Australia’s states and territories performing? Each quarter CommSec attempts to find out by analysing eight key indicators: economic growth; retail spending; equipment investment; unemployment, construction work done; population growth; housing finance and dwelling commencements.
- Just as the Reserve Bank uses decade averages to determine the level of “normal” interest rates; we have done the same with the economic indicators. For each state and territory, latest readings for the key indicators were compared with decade averages – that is, against the “normal” performance.
- Western Australia remains the top-performing economy in the nation with no slippage in the ranking over the past three months. The ACT has maintained its position as the second-best performing economy. But the big changes have been below with now little to separate Northern Territory, Queensland, NSW and Victoria, although in that order. There is then a gap to South Australia and another gap to Tasmania with both states clearly under-performing other economies at present.
- Western Australia comes out on top now on only one of the eight criteria – retail spending. Western Australia is still second on five of the eight indicators, third on unemployment and fourth on dwelling starts.
- The jump in the rankings of Queensland to equal fourth is due to improvements in business investment, unemployment, housing finance and dwelling starts. The Northern Territory has lost ground in dwelling starts, population growth and business investment.
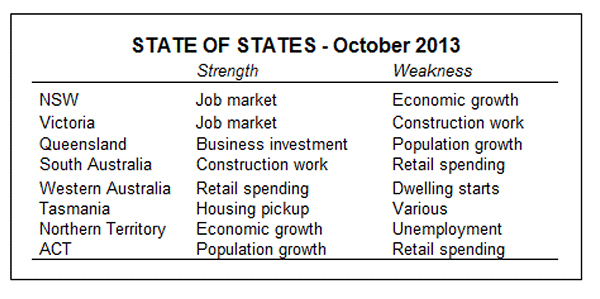

Western Australia still on top; Queensland and NSW now equal fourth
- Western Australia remains Australia’s best performing economy, while ACT has widened the gap to Northern Territory from Queensland and NSW, now equal fourth.
- Western Australia leads the way on retail trade. It is second strongest on economic growth, business investment, construction work done, housing finance and population growth; and finished third on unemployment and fourth on dwelling starts.
- The ACT economy remains the second strongest economy with the main strengths being dwelling starts, housing finance and population growth. The ACT is now third strongest on business investment and fourth on economic growth.
- The Northern Territory finished first for economic growth and construction work done. But it also finished seventh on business investment, unemployment and housing finance, signalling a loss of momentum.
- There is still little separating Queensland, NSW, and Victoria in terms of relative economic performance. Queensland is strongest on business investment and third strongest on economic growth, retail trade and construction work. NSW is strongest on unemployment, and third strongest on population growth. Victoria is second strongest on unemployment and third strongest on housing finance. But at the other end of the scale, NSW is seventh on economic growth while Victoria is seventh on construction work.
- There is then a gap in the rankings to South Australia. While the state is middle ranking on construction work, and fifth on housing finance it is sixth or seventh on every other indicator.
- Tasmania remains locked at the bottom of the Australian economic performance table. Tasmania lags all other economies on all of the eight indicators. The economy is still growing – economic growth and retail spending are growing faster than ‘normal’ or decade-average levels. But stagnant population growth is reducing activity in home building and home purchase, as well as commercial and engineering construction and business investment.
How was performance judged?
- Each of the states and territory economies were assessed on eight key indicators: economic growth; retail spending; equipment investment; unemployment, construction work done; population growth; housing finance and dwelling commencements.
- The aim was to find how each economy was performing compared with “normal”. And just like the Reserve Bank does with interest rates, we used decade-averages to judge the “normal” state of affairs. For each economy, the latest level of the indicator – such as retail spending or economic growth – was compared with the decade average.
- While we also looked at the current pace of growth to look at economic momentum, it may yield perverse results to judge performance. For instance retail spending may be up sharply on a year ago but from depressed levels. Overall spending may still be well below “normal”. And clearly some states such as Queensland and Western Australia consistently have faster economic growth rates due to historically faster population growth. So the best way to assess economic performance is to look at each indicator in relation to what would be considered ‘normal’ for that state or territory.
- For instance, the trend jobless rate in the ACT of 4.1 per cent is lower than all economies. But compared with its ‘normal’ or decade-average rate of 3.4 per cent, the jobless rate is actually higher in percentage terms than four of the state and territory economies, thus restraining activity in the retail sector. Trend measures of the economic indicators were used to assess performance rather than more volatile seasonally adjusted or original estimates.
Economic growth
- Ideally gross state product (GSP) would be used to assess broad economic growth. But the data isn’t available quarterly. Rather state final demand (household and business spending) is added to exports less imports to act as a proxy for GSP. Exclusion of the trade sector would provide an incorrect assessment of growth for economies such as Western Australia and Queensland.
- The Northern Territory continues to lead the rankings on economic activity. Activity in the ‘top end’ is 42 per cent above its ‘normal’ or decade-average level of output.
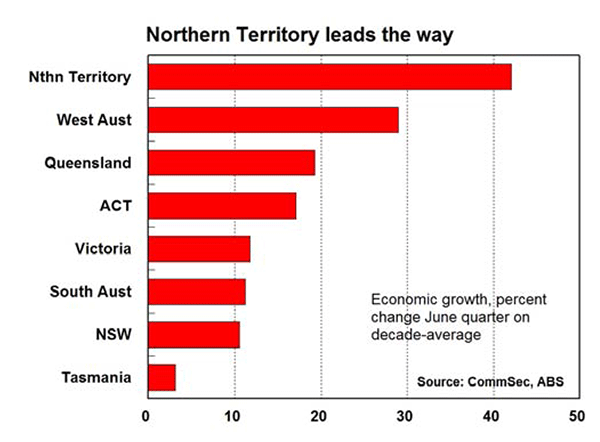

- Next strongest is Western Australia, with output around 29 per cent higher than the decade average level of output. Then follows Queensland (up 19.3 per cent) from the ACT (up 17.1 per cent).
- At the other end of the scale, economic activity in Tasmania in the June quarter was just 3.1 per cent above its decade average while NSW activity was up 10.6 per cent on its “normal” or average output over the past decade.
- There would be little change in the rankings if “final demand” was used instead. But NSW would move from seventh to fifth spot.
- The Northern Territory also maintains the fastest annual economic growth rate in the nation, up by 7.0 per cent on a year ago, ahead of Queensland with 4.3 per cent and Western Australia (2.8 per cent).
- The weakest trend economic growth rate was recorded in Tasmania (-1.8 per cent) followed by South Australia (0.2 per cent) and ACT (0.3 per cent).
Retail trade
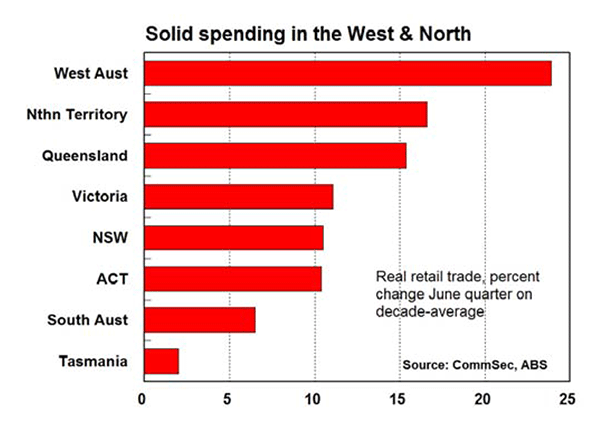

- The measure used was real (inflation-adjusted) retail trade in trend terms with June quarter data the latest available. If monthly retail trade was assessed instead (August data available), ACT would move marginally ahead of NSW in the rankings. This result provides added confidence about the overall results on consumer spending.
- Western Australia retains top spot on the retail rankings with spending in the June quarter, 23.9 per cent above decade average levels. Solid population growth, a lift in home purchases and firm wage growth underpin the relative strength in consumer spending.
- Northern Territory was next strongest, supported by a lift in dwelling construction, with spending 16.6 per cent above decade-average levels
- Queensland was next strongest, with spending 15.4 per cent above decade averages, followed by Victoria (up 11.1 per cent)
- Tasmania has the weakest result on retail spending, up just 2.0 per cent on the decade average (down from 2.7 per cent in the March quarter), and below South Australia with growth of 6.5 per cent.
- In terms of the monthly retail trade series, Queensland spending is 3.1 per cent higher than a year ago, just in front of Northern Territory with 2.9 per cent growth, South Australia with 1.9 per cent growth and Tasmania, up 1.7 per cent. At the other end of the scale, Victorian spending is 1.0 per cent up on a year ago with NSW and Western Australian spending both up by 1.4 per cent and ACT spending up 1.6 per cent.
Equipment investment
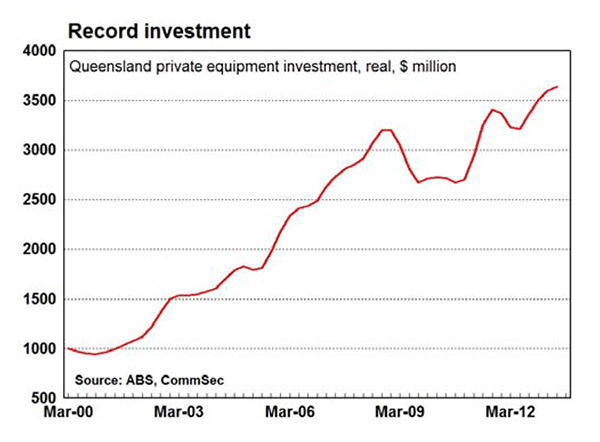
- Queensland now leads other states and territories when it comes to equipment investment. Spending in the June quarter was almost 37 per cent above “normal” – or decade-average levels. Western Australia was leading the way but is experiencing a slowdown of mining investment. Equipment investment in Western Australia is now 33.1 per cent above decade-average levels followed by ACT (up 16.5 per cent), NSW (up 7.6 per cent) and Victoria (up 3.3 per cent).
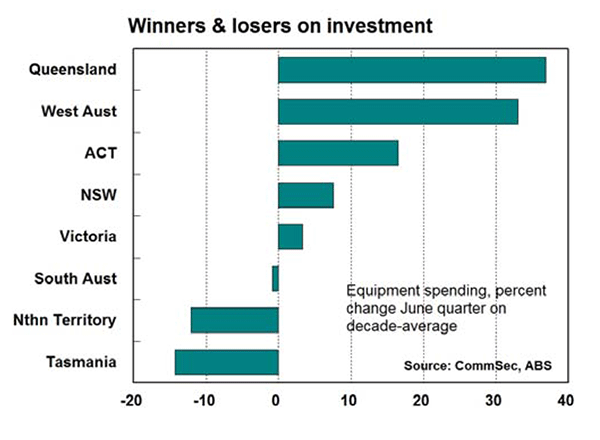

- By contrast, new equipment spending in Tasmania was 14.3 per cent below its longer-term average in the June quarter with Northern Territory down 12.1 per cent and South Australia, down 0.9 per cent.
- On a shorter-run analysis, equipment investment in the June quarter was lower than a year ago in six of the state and territory economies. Currently equipment investment is down on a year ago in Northern Territory (down 31.8 per cent), Tasmania (down 29.7 per cent), Western Australia (down 23.2 per cent), South Australia (down 10.4 per cent), NSW (down 8.2 per cent) and Victoria (down 0.4 per cent). By contrast new equipment investment in Queensland is up 13.5 per cent on a year earlier followed by ACT (up 8.3 per cent).

Unemployment
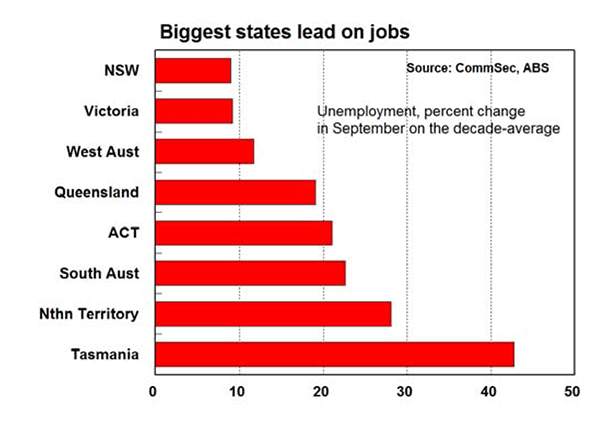
- NSW and Victoria arguably have the strongest job markets in the nation. While its trend unemployment rate of 5.5 per cent is not the lowest in the nation, the NSW jobless rate is just 9.0 per cent above its “normal” or decade average level.
- Similarly in Victoria, trend unemployment stands at 5.7 per cent and this is 9.2 per cent above its decade average rate of 5.2 per cent.
- In Western Australia, unemployment is lower at 4.7 per cent but this is 11.7 per cent above the “normal” or decade-average level of 4.2 per cent.
- At the other end of the scale, Tasmania’s 8.5 per cent jobless rate is the highest in the nation and up almost 43 per cent on the decade average. The Northern Territory job market is next weakest. In the past 10 months the jobless rate has lifted from 3.9 per cent to 5.5 per cent and it is now 28 per cent above its decade average level of 4.3 per cent.

Construction work
- The measure used for analysis was the total amount of residential, commercial and engineering work actually completed in trend terms in the June quarter.
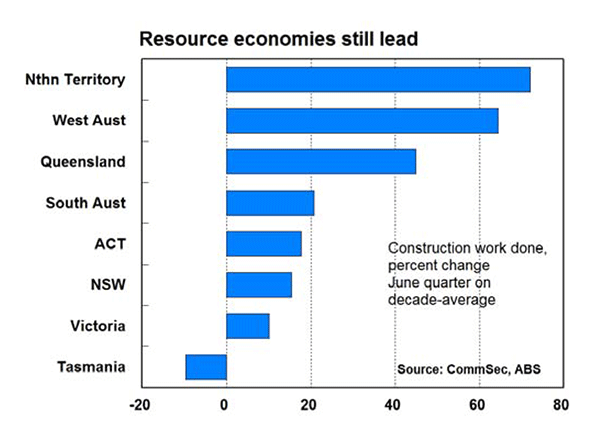
- In all states/territories except Tasmania construction work is higher than decade averages. And there remains a large gap between the strongest states (the resource states) and weakest states (Tasmania).
- In Tasmania, overall new construction work completed is 9.7 per cent below its decade average. By contrast construction work done in Northern Territory was 72 per cent above its decade average followed by Western Australia (up 65 per cent) and Queensland (up 45 per cent).
- Next weakest to Tasmania is Victoria where construction work is 10.1 per cent above decade averages, followed by NSW (up 15.4 per cent on the decade average).
- In terms of annual growth rates, Northern Territory construction work done in the June quarter was up 30 per cent on a year ago, followed by Queensland (up 2.6 per cent) and South Australia (up 0.7 per cent). In the ACT, construction work was 16.5 per cent below decade averages but new dwelling starts soared in the June quarter.
Population growth
- To assess population performance we looked at the current annual growth rate and compared it with each economy’s decade-average growth pace. And the good news is that population growth is above ‘normal’ in five states or territories but growth only picked up in two jurisdictions over the past quarter.
- Western Australia is the clear leader in population growth. Not only is the annual growth rate of 3.42 per cent the strongest in the nation, it is also almost 40 per cent above the decade average. But the actual leader in the rankings is the ACT. Annual population growth of 2.17 per cent is 43 per cent above “normal’.
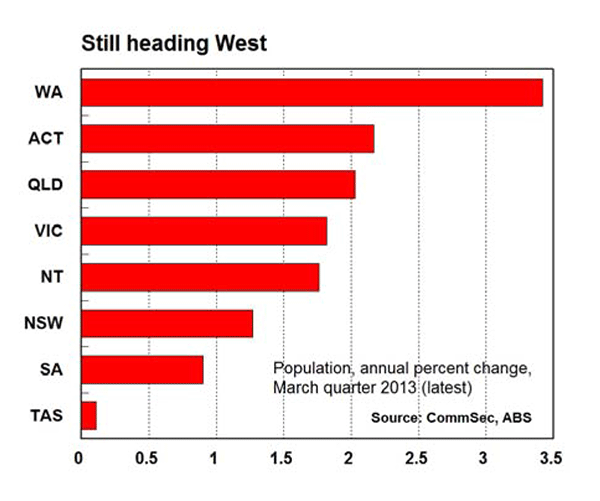

- In NSW current annual population growth of 1.27 per cent is 18.2 per cent above the decade average.
- At the other end of the leader-board is Tasmania where the annual population growth of 0.11 per cent was 85 per cent below the decade average rate of 0.75 per cent but growth did lift in the March quarter from 0.06 per cent.
Housing finance

- The measure used was the trend number of housing finance commitments and this was compared with the decade-average for each respective state and territory.
- Housing finance is not just a lead indicator for real estate activity and housing construction but also is a useful indicator of activity in the financial sector. It would be useful to compare figures on commercial, personal and lease finance, but unfortunately trend data is not available for states and territories.
- In all but three states and territories – the ACT, Western Australia and Victoria – trend housing finance commitments are below decade averages. But encouragingly commitments in August were above year-ago levels in all states and territories.
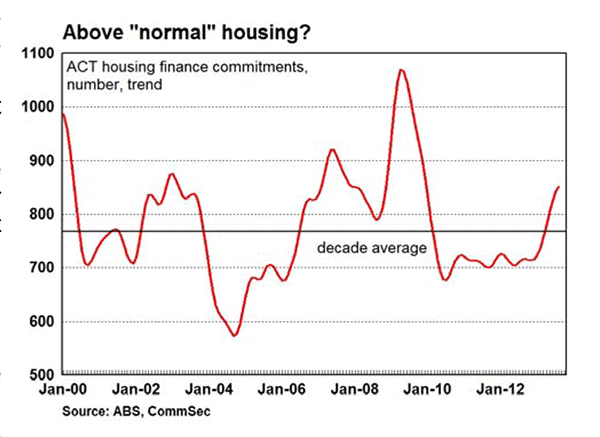
- In the strongest economy of the ACT, the number of housing finance commitments was 10.7 per cent above the decade-average level and commitments in August were 18.9 per cent higher than a year ago.
- Western Australia was in second spot for housing finance, with the number of commitments 8.8 per cent above the long-term average. And importantly the market has momentum with home lending 14.2 per cent higher than a year ago in trend terms.
- Victoria has slipped to third spot on housing finance, up 8.2 per cent on the decade average followed by NSW (down 1.5 per cent).
- Tasmania is the weakest economy for housing finance with trend commitments 22.4 per cent lower than its decade average, but encouragingly commitments were up 2.9 on a year ago. Next weakest was the Northern Territory with trend commitments down 17.4 per cent on the decade average.

- The measure used was the trend number of dwelling commencements (starts) with the comparison made to the decade-average level of starts. Starts are driven in part by population growth and housing finance and can affect retail trade, unemployment and overall economic growth. However any over-building or under-building in previous years can affect the current level of starts.
- The outlook for housing construction has improved, underpinned by state government grants for new construction and low interest rates. Dwelling starts are above decade averages in five of the states and territories and starts in six states and territories are above levels of a year ago.
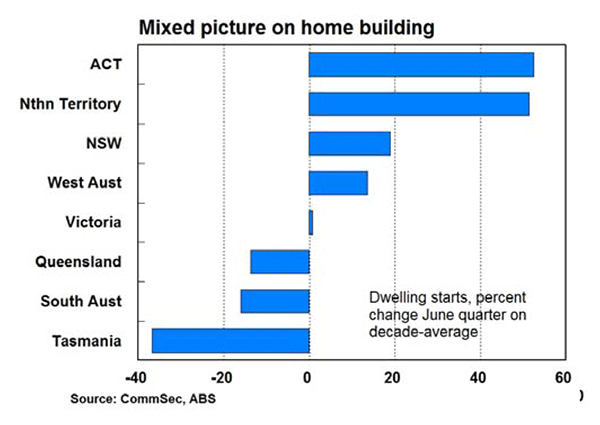

- The ACT is in the strongest position for new housing construction, with starts almost 53 per cent above decade averages. In addition in the June quarter the number of dwellings started was 11.7 per cent higher than a year earlier, the first annual gain in almost two years.
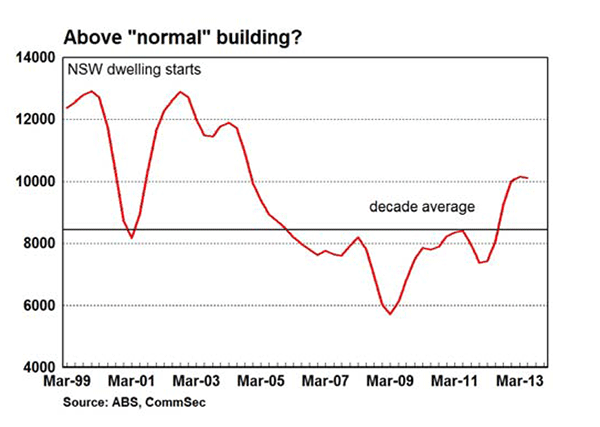
- In second spot was Northern Territory, with starts almost 52 per cent above decade averages. But momentum is lagging with starts in the quarter up 10.7 per cent on a year ago, down from 31.9 per cent in the March quarter. In NSW, dwelling starts in the June quarter were up 19.0 per cent on the ‘normal’ or “decade average” level with starts in Western Australia up almost 14 per cent on decade averages and Victoria up 0.8 per cent.

- At the other end of the scale, Tasmanian dwelling starts were 36.7 per cent below decade averages, while starts in the June quarter were 20 per cent down on a year earlier. Next weakest was South Australia (down 16.0 per cent) and Queensland (down 13.7 per cent). However encouragingly Queensland starts were 9.4 per cent higher than a year ago. Western Australian starts were up 38 per cent on a year ago with NSW up 25.3 per cent.
Other indicators
- Real wages were positive in all economies in the June quarter except for the Northern Territory. Strongest growth occurred South Australia at 1.2 percentage points, followed by Tasmania (1.1 percentage points) and Western Australia (0.9 percentage points).
- Even using “underlying” inflation than “headline” inflation, real wages are growing on average by around 0.5-1.0 percentage points.
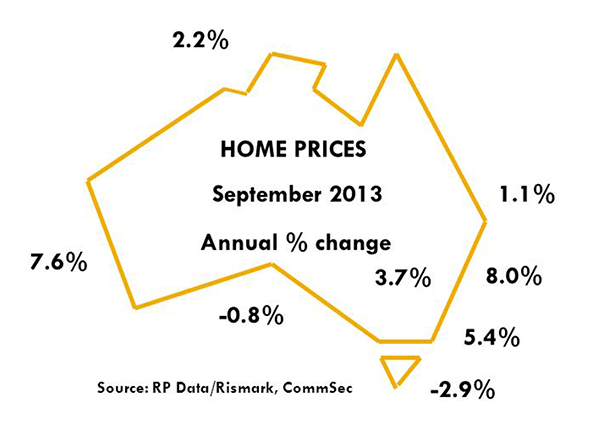
- Home prices are now higher than a year ago in all but Hobart (down 2.9 per cent) and Adelaide (down 0.8 per cent). Strongest growth in home prices was in Sydney (up 8.0 per cent) followed by Perth (up 7.6 per cent). But growth rates of home prices are below decade averages in all capital cities except Sydney. The decade average growth in Sydney is 2.7 per cent, well below other capital cities of between 5.4-10.5 per cent.
Implications and outlook
- State and territory economies continued to grow in the June quarter, but below the more “normal” growth rates over the past 5 years or 10 years. Western Australia continues to lead other economies in a relative sense with little slippage over the past three months. The ACT has consolidated second position and momentum will be provided in coming months by the housing sector in response to a surge in new dwelling starts in the June quarter.

- But you could effectively throw a blanket over the three largest states and Northern Territory. Northern Territory is just ahead of Queensland and NSW which jointly share fourth position, and they are closely followed by Victoria. There is then a gap to South Australia and then another gap to Tasmania.
- All economies should lift now that the uncertainty of the Federal Election is finally out of the way. While a slowdown in mining investment will affect some regions, this will be offset by a lift in residential building. NSW, Western Australia, Queensland and ACT are expected to benefit most from a lift in home building.
- Firm real wages and improved housing affordability are being reflected in a lift in retail spending in Tasmania. If this leads to increased employment then there will be potential for stronger economic momentum in coming months.
Craig James, Chief Economist, CommSec