For over a decade we have produced “The Big Issues” report – a report that has sought to highlight the issues that are expected to influence the economy over the forthcoming 12 months.
Now this is no crystal ball gazing exercise. The aim is not just to forecast where certain economic variables are likely to be in a year’s time. Rather the focus has been to highlight trends, issues and ‘big picture’ influences that act as threats or opportunities for consumers, investors and businesses alike.
The aim has been to produce a highly readable, relatively jargon-free document. Probably today we could call this a blog. But the intention over time has been to produce commentary that causes people to think and ask the ‘so what’ question – that is, to determine what this means for their own circumstances.
And this year we have continued the initiative that we started last year, by reducing the amount of text and letting the pictures speak for themselves. Certainly one of the great innovations over recent years has been the infographic and other developments that have sought to bring subject matter ‘alive’. They say that a picture should tell a thousand words, and that should be the basis for all economic and financial commentaries – make the subject matter more alive and relevant to readers. The real value of economics is when people say ‘so what?’ and relate the commentary and forecasts to their own situation.
…But First…The Economic ‘State of Play’
Review of the Past Year
Each year we kick off the Big Issues with an outlook for the economy and then finish the report with a recap of the past year.
But this year we will roll the two sections together. Quite simply, because the past year has been largely unremarkable and the coming year looks more of the same.
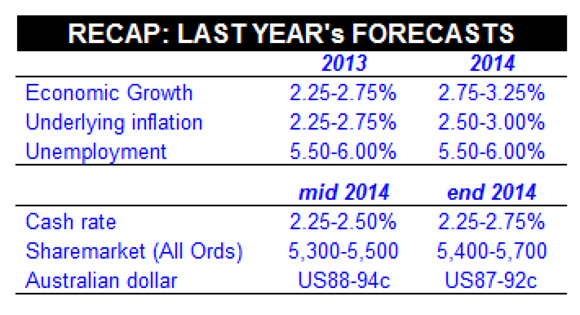
Now some would say that the relatively benign environment is the reason that our forecasts turned out to be rather quite accurate. And we accept that.
The past year has been characterised by cautious consumers and businesses. Spending, investing and employment have been relatively unremarkable. As a result, the economy has grown near, or slightly below the ‘normal’ pace. Unemployment has drifted higher and inflation has remained under control. The cash rate hasn’t budged. And the Aussie dollar has ebbed and flowed, but drifted lower over the second half of the year.
Over 2014 the Aussie dollar tracked over a US12.5 cent range – from US82.53c to US95.04c. The currency is ending the year at the low end of the range and around US3-4 cents below the lower boundary of our forecast band.
The Year Ahead
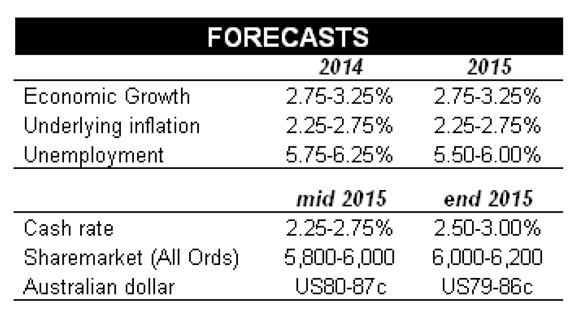
The coming year may prove more of the same. Economic growth should stay close to 3 per cent, below the sort of growth that will cause unemployment to fall markedly. Inflation should hold in the Reserve Bank’s 2-3 per cent target band. Risks are to the low end of the range in the early part of the year, held down by low oil prices.
As a result, the cash rate will not budge until the second half of 2015. We tip the Reserve Bank to start the ‘normalisation’ process (lift rates) in August and follow that with another rate hike in November.
The risk is that the Reserve Bank does nothing. With solid productivity and population growth, arguably the speed limit of the economy is closer to 3.5-4.0 per cent. And if the economy does pick up pace, inflation may not budge – influenced by lower oil prices and one of our key themes: absence of business pricing power. In fact, one of the left-field questions is: if the speed limit does remain high, the economy drifts and inflation eases – not rises – does the cautious Reserve Bank conclude that this is a new era, and keep interest rates low?
The Aussie dollar should drift lower in line with softer commodity prices and a start to the rate-hiking process in the US. The European Union will continue to muddle along. The US economy will continue its path to ‘normality’. China will continue its transition from industrial-driven growth to an economy underpinned by services sector development, rising household incomes and rising household spending.
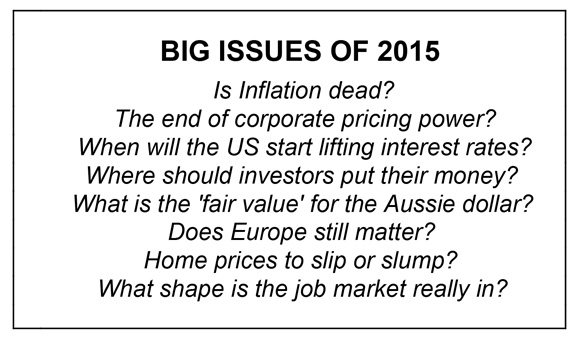
Is inflation dead?
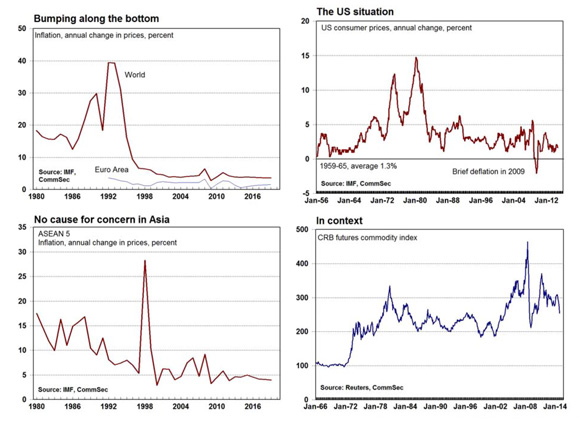
Murphy’s Law would advocate that merely suggesting the possibility that inflation is dead would cause prices to starting spiking higher. But the issue that is occupying the minds of central bankers in the Northern Hemisphere is the potential for deflation.
In last year’s Big Issues we also included a similar item: “Inflation or Deflation?” It is quite remarkable, that with interest rates close to zero across many parts of the world and many central banks injecting stimulus via bond buying, that concerns about deflation still abound.
In part it gets down to the sluggishness of economic growth in regions such as Europe, Japan and parts of Latin America. Central bankers are finding it hard to kick-start growth. This has occurred in the past, especially following financial crises. Confidence remains shaky; consumers and businesses are reluctant to take on debt; and governments are unsure the best way to move forward. Do they focus on kick-starting growth, say through infrastructure spending, or do they repair budgets and get debt under control first.
But low inflation is also a consequence of a change in the commodity price cycle. China has largely moved through the ramp-up phase of industrialisation where demand for resources runs ahead of supply. Supply has now caught up, and rather than commodity prices pushing higher, they are moving south, injecting a deflationary pulse.
Lower oil prices are adding to the deflationary concerns. But here the issue is different. Saudi Arabia is effectively trying to support its competitive position, and the position of OPEC more generally, in the global oil market. US energy production has been ramped up through shale oil, and in other economies, gas, ‘green’ energy solutions, and nuclear fuel.
Another element in the overall mix is a change in the global business environment, and that brings us to the next issue…
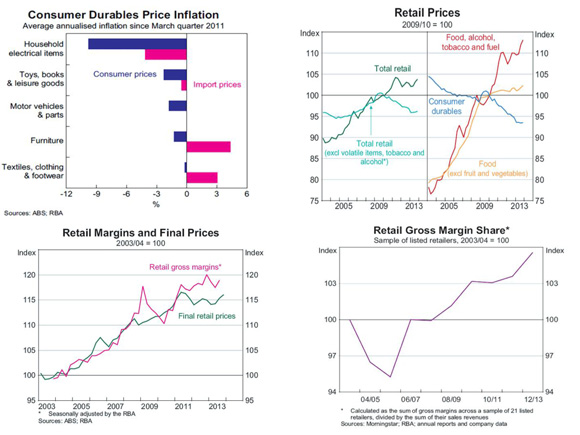
The end of corporate pricing power?
We live in extraordinary times. A few years ago, only the tech savvy would consider buying goods over the internet. Initially most purchases were tech goods like software. But then consumers progressed to other relatively low value items including clothing. Now effectively anything within reason can be purchased on-line.
Before internet shopping really began to take off, most retail-focussed small businesses were concerned with what their competitors in the same suburb were doing or competitors in neighbouring suburbs. Then that concern extended to competitors in the city, then the same state, the same country and now competitors can be found over the other side of the world.
In the past the secret to successful businesses was pricing power. One definition of pricing power is: “Pricing power measures the extent to which a business can pass on the increases in input costs to consumers through increases in the prices of finished goods.” (Reserve Bank of India).
But while it is simple enough to get a definition of pricing power, obtaining data in an attempt to show trends over time is much harder to find. Certainly, anecdotally, many businesses will claim that it has become harder to pass on costs in terms of higher prices.
The Australian Reserve Bank has looked at the issue of retail margins and retail prices on a number of occasions since 2012. A persistent focus of the discussion has been that recent declines in consumer durable prices have been more significant than traditional relationships such as with the exchange rate. The Reserve Bank observed that “In particular, liaison with businesses suggests that competitive pressures have been particularly pronounced in the past few years, which may in turn be partly attributable to the increasing presence of online vendors, based in Australia and overseas.”
While retail prices, especially durables, have fallen more than expected, the Reserve Bank suggests that it hasn’t been at the expense of margins. Retailers have cut costs, improved efficiency and productivity and some have tried to reduce prices to wholesalers to keep costs down. So while increased competition may have increased downward pressure on prices, there are still responses open to businesses to keep profits growing.
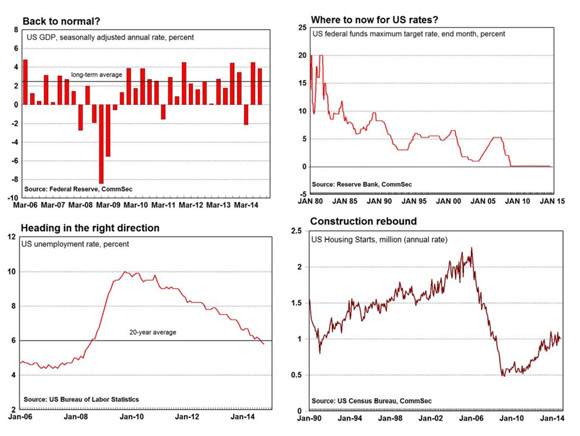
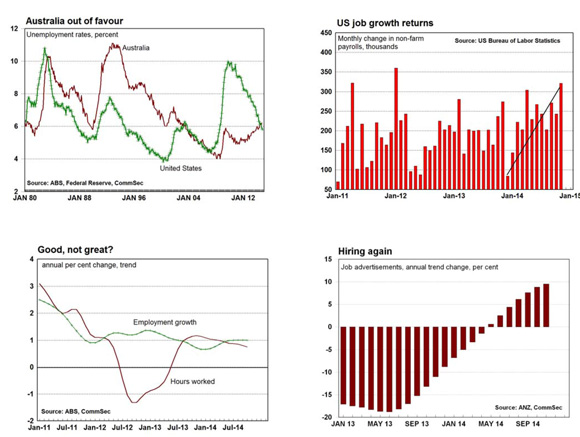
It is a case of so far, so good for the US Federal Reserve. The economy is growing, in fact the current growth pace is above the long-term average. Unemployment has dropped below 6 per cent – lower than the jobless rate in Australia. Home building and manufacturing are expanding, sustaining economic momentum
The Federal Reserve has also finished the extraordinary period of monetary stimulus – Quantitative Easing – or the bond buying program.
With interest rates near zero, seemingly there are few obstacles to starting the ‘normalisation process’ of lifting rates to the 2-3 per cent region. But despite all the stimulus that has been applied, inflation remains historically-low. And the Federal Reserve believes that the labour market is not as tight as the unemployment rate would suggest.
So the Federal Reserve has left open the timing of the first rate hike in the new cycle, indicating it is “data dependent”. In a ‘normal’ cycle the risk of leaving rates too low for too long is that inflation could quickly take hold and it could prove hard to eradicate. But if rates are lifted too quickly then the risk is that the fledgling recovery could be put at risk.
There is no mathematical model that can determine the right time to lift interest rates. But the bottom line is that the Federal Reserve’s decision-making process will have consequences. A decision to lift rates could stem momentum in the sharemarket or serve to induce volatility. Higher US interest rates – either actual rate hikes or the threat of higher interest rates – may serve to push up the value of the US dollar and in turn drive down commodity prices.
In short, investors need to stay alert to the timing and size of US rate hikes over 2015.
When will the US start lifting interest rates?
It is a case of so far, so good for the US Federal Reserve. The economy is growing, in fact the current growth pace is above the long-term average. Unemployment has dropped below 6 per cent – lower than the jobless rate in Australia. Home building and manufacturing are expanding, sustaining economic momentum
The Federal Reserve has also finished the extraordinary period of monetary stimulus – Quantitative Easing – or the bond buying program.
With interest rates near zero, seemingly there are few obstacles to starting the ‘normalisation process’ of lifting rates to the 2-3 per cent region. But despite all the stimulus that has been applied, inflation remains historically-low. And the Federal Reserve believes that the labour market is not as tight as the unemployment rate would suggest.
So the Federal Reserve has left open the timing of the first rate hike in the new cycle, indicating it is “data dependent”. In a ‘normal’ cycle the risk of leaving rates too low for too long is that inflation could quickly take hold and it could prove hard to eradicate. But if rates are lifted too quickly then the risk is that the fledgling recovery could be put at risk.
There is no mathematical model that can determine the right time to lift interest rates. But the bottom line is that the Federal Reserve’s decision-making process will have consequences. A decision to lift rates could stem momentum in the sharemarket or serve to induce volatility. Higher US interest rates – either actual rate hikes or the threat of higher interest rates – may serve to push up the value of the US dollar and in turn drive down commodity prices.
In short, investors need to stay alert to the timing and size of US rate hikes over 2015.
Where should investors put their money?
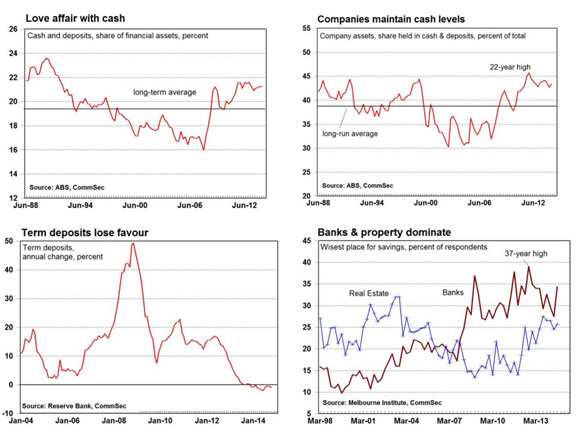
Now some may say that determining the best place to invest is hardly one of the big issues for 2015 – isn’t it an issue that comes up every year? But what makes the issue arguably more important in 2015 than in a normal year is the extent of conservatism that exists. Ever since the Global Financial Crisis (GFC), consumers, businesses and even fund managers have been maintaining a higher than ‘normal’ proportion of assets in cash or bank deposits.
As at June 2014, 21.2 per cent of financial assets in Australia were held in cash or deposits. Over the previous 22 years the highest proportion of assets that had been held in these safe-haven investments was 21.6 per cent, so it is clear that conservatism reigns. And the share of assets currently held in cash or deposits is well above the long-term average of 19.6 per cent.
The extent of caution is remarkable because it has been around six years since the GFC. And rather than the share of funds held in safe-haven assets easing toward the long-term average, it has held at remarkably stable levels near historic highs.
Now certainly many Australians have embraced property over the past year, as evidenced by the angst over the growth of investment housing loans. But this has effectively led to is a polarisation of investment choices. When asked in September 2014 to select the ‘wisest’ place for saving, 60 per cent of respondents identified Banks (34.3 per cent) or Real Estate (25.7 per cent). That is the greatest extent of polarisation of investment choices in 20 years.
Interestingly, while investors nominated Banks as the wisest place for savings, it is clear that many aren’t keen on locking the funds away. The amount of money held in term deposits is lower than a year ago, and in fact negative annual growth has been maintained for the best part of a year. In contrast ‘other deposits’ with banks have grown at a 16 per cent annual rate over the past two years.
In 2015, investors will have to give serious thought to greater diversification of their investments – especially as the easy gains in home prices now appear behind us. Returns on shares and property have tended to coalesce over time – over the past 15 years returns on both assets have averaged 10 per cent per annum.
As with most of the Big Issues, we largely pose the questions, rather than providing definitive answers. What we are looking to identify are the main talking points in 2015. And just like in 2014, the value of the Aussie dollar will be uppermost in minds, affecting the sharemarket, interest rate and broader economic growth.
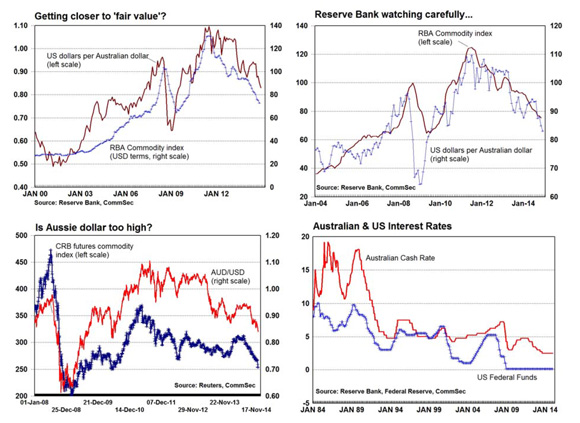
The Reserve Bank clearly feels that the Aussie dollar is still too high. In announcing the last interest rate decision, the RBA noted: “But the Australian dollar remains above most estimates of its fundamental value, particularly given the significant declines in key commodity prices in recent months. A lower exchange rate is likely to be needed to achieve balanced growth in the economy.”
At the November decision when the Aussie was just over US87c, the RBA noted “It is offering less assistance than would normally be expected in achieving balanced growth in the economy.” At the December decision the Aussie was near US85c. It is currently near US82.5c. So the RBA acknowledged that the currency had come down, and would offer some assistance in boosting growth, but explicitly suggested it should fall further.
How far should it fall? The Reserve Bank hasn’t told us. And of course the ‘appropriate’ level is a moving target. Commodity prices, economic statistics, politics and interest rates are constantly changing – here and overseas. And then there are geopolitical factors to consider.
Measures of purchasing power parity, such as the Big Mac and CommSec iPad indexes suggest that the Aussie dollar is ‘fairly’ priced. Of course, these are more light-hearted approaches to assess currency valuations. Tracking a key daily commodity index such as the CRB Futures index since 2008, suggests that the Aussie dollar should be in the US70-80c range rather than between US80-85c.
Using the Reserve Bank’s commodity index – either in US dollar terms or ‘currency-neutral’ SDR terms – suggests an Aussie dollar in the US75-85c range seems more appropriate. No doubt the RBA would argue that a currency in the bottom of the range would be more helpful in rebalancing the economy from mining to non-mining sectors.
What is the ‘fair value’ of the Australian dollar?
As with most of the Big Issues, we largely pose the questions, rather than providing definitive answers. What we are looking to identify are the main talking points in 2015. And just like in 2014, the value of the Aussie dollar will be uppermost in minds, affecting the sharemarket, interest rate and broader economic growth.
The Reserve Bank clearly feels that the Aussie dollar is still too high. In announcing the last interest rate decision, the RBA noted: “But the Australian dollar remains above most estimates of its fundamental value, particularly given the significant declines in key commodity prices in recent months. A lower exchange rate is likely to be needed to achieve balanced growth in the economy.”
At the November decision when the Aussie was just over US87c, the RBA noted “It is offering less assistance than would normally be expected in achieving balanced growth in the economy.” At the December decision the Aussie was near US85c. It is currently near US82.5c. So the RBA acknowledged that the currency had come down, and would offer some assistance in boosting growth, but explicitly suggested it should fall further.
How far should it fall? The Reserve Bank hasn’t told us. And of course the ‘appropriate’ level is a moving target. Commodity prices, economic statistics, politics and interest rates are constantly changing – here and overseas. And then there are geopolitical factors to consider.
Measures of purchasing power parity, such as the Big Mac and CommSec iPad indexes suggest that the Aussie dollar is ‘fairly’ priced. Of course, these are more light-hearted approaches to assess currency valuations. Tracking a key daily commodity index such as the CRB Futures index since 2008, suggests that the Aussie dollar should be in the US70-80c range rather than between US80-85c.
Using the Reserve Bank’s commodity index – either in US dollar terms or ‘currency-neutral’ SDR terms – suggests an Aussie dollar in the US75-85c range seems more appropriate. No doubt the RBA would argue that a currency in the bottom of the range would be more helpful in rebalancing the economy from mining to non-mining sectors.
Does Europe Still Matter?
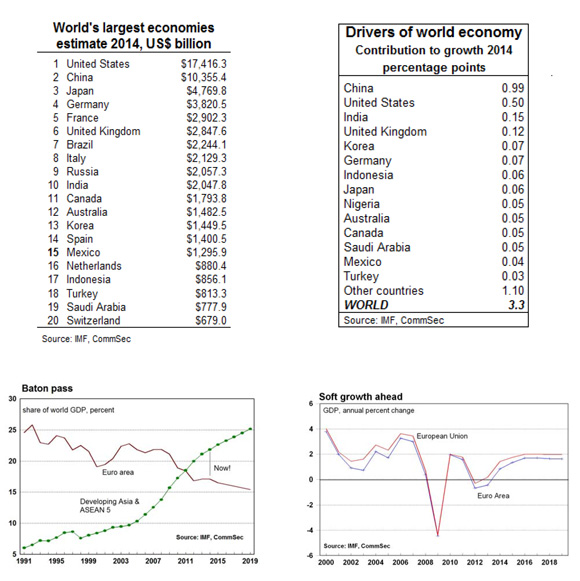
The International Monetary Fund updated its database in October. And the latest data shows that the US still dominates the list of the world’s largest economies. That is, if you express the data in US dollar terms. If you use purchasing power parity as a means for comparison, the IMF data shows China with a 16.5 per cent share in 2014, ahead of the US with 16.3 per cent.
But if we stick to US dollars for comparison, there were seven European economies in the list of the 20 largest global economies. That group includes the UK, but excludes Russia and Turkey. Together, these seven nations accounted for around 19 per cent of the global economy.
But when it comes to assessing the countries that are largely responsible for driving global growth (share of world economy times economic growth) only the UK and Germany are listed as major contributors in 2014. And indeed the major seven European nations will add just 0.24 percentage points out of the 3.3 per cent expected growth for the world economy.
So does Europe matter? At present, it is clear that the focus is elsewhere – largely in Asia. The European Union accounts for 23.7 per cent of the global economy and the Euro Area 17.1 per cent, well behind Emerging market and developing nations at 39.3 per cent. In 2008, the EU was bigger. In 2016, the EU will represent a smaller share of world GDP than Asia. Investors need to adjust their view.
Will home prices slip or slump?
It doesn’t seem to matter what shape the broader economic environment is in, there will always be some concern about the housing market. Seemingly home prices are always either running too hot, or alternatively prices are falling and putting at risk the wealth levels of Australians. Or there are concerns that home building is either too strong, creating the risk of over-supply, or that there is not enough building occurring, leading to rental auctions.
And indeed over the past five years we have probably heard all these assertions. In the current environment, the main worry is that home prices are rising too strongly, resulting in some weakening of affordability levels of first home buyers.
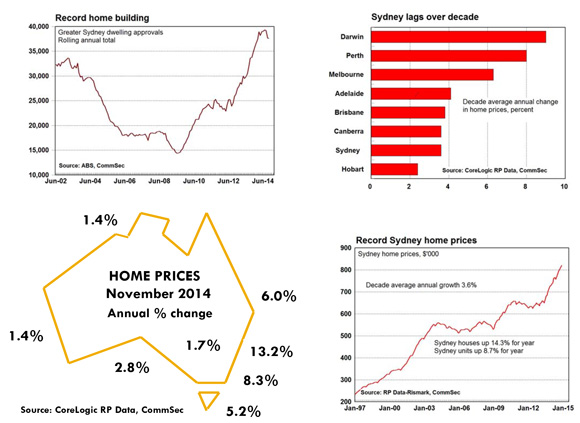
Worries about the strength of home prices are largely centred on Sydney, and to a lesser extent Melbourne. In November, Sydney home prices were up by 13.2 per cent on a year ago with house prices up by 14.3 per cent. And while this is lofty price growth, it is actually slower than the 16.7 per cent annual growth pace in April.
But Sydney home prices are merely responding to a shortage of supply as well as strong demand. A year ago the rental vacancy rate in Sydney was 1.6 per cent – an 18-month low and not far from the record low of 1.3 per cent.
Interest rates are low, new building has been weak, returns outside housing have been low for investors and population has been rising. So Sydney home prices have just been playing catch-up. Over the last decade Sydney home prices have risen by just 3.6 per cent on average per year, the second lowest of the capital cities.
But the supply is starting to rise. In the year to July just over 39,000 new dwellings were approved for construction. Over the next 12-18 months a record supply of stock will flood the market, leading to softer growth of home prices and potentially softer rents. In just four years, home building has doubled. But with the rental vacancy rate still low in Sydney, prices seem more likely to slip, rather than slump, and this will serve to reduce home price momentum in other regions.
What shape is the job market really in?
In both the US and Australia, the fate of interest rates remains very much in the hands of the job market. In the US, the Federal Reserve policymakers have taken the view that there is still is considerable slack in the job market despite stronger job gains and lower unemployment.
After the out-sized 321,000 lift in November non-farm payrolls (employment), the Federal Reserve will no doubt re-assess its views. Not only was employment up the most in three years but there were upward revisions in previous months’ data and hourly wages rose. In short, the Fed may be getting closer to raising interest rates.
In Australia, the job market has proved volatile, leading many to question the veracity of the data. For some, it’s the definition of employment. According to the survey conducted by the Bureau of Statistics, someone is classified as “employed” if they “worked for one hour or more for pay, profit, commission or payment in kind in a job or business, or on a farm (comprising employees, employers and own account workers).”
If it only takes an hour of work for someone to be classified as employed, then that clearly overstates the level of unemployment. Or does it? The same definition has been in place for over 20 years. So if unemployment has been understated, it’s been understated over the entire period.
And one of the best ways to cross-check the jobs data is to use the Census results – a ‘population’ survey rather than a ‘sample’ survey. At the time of the Census on August 9 2011, the proportion of people who reported that they were over 15 years of age, in the workforce and unemployed was 5.6 per cent. The unadjusted monthly unemployment estimate in the Labour Force Survey in August 2011 was 5.1 per cent while the seasonally adjusted estimate was 5.3 per cent. In other words, the results were very close despite numerous differences in the scope and methodology of the two surveys.
Whether the Reserve Bank elects to cut rates again or hold rates steady, much will depend on its assessment of the job market, where it’s headed, and what it means for wages and prices.
Rewind: The Big Issues for 2014
As we noted at the start of this report, we have been producing Big Issues for over a decade. And it is interesting – and perhaps even instructive – to rewind over the past year and assess what we had on the radar screen.
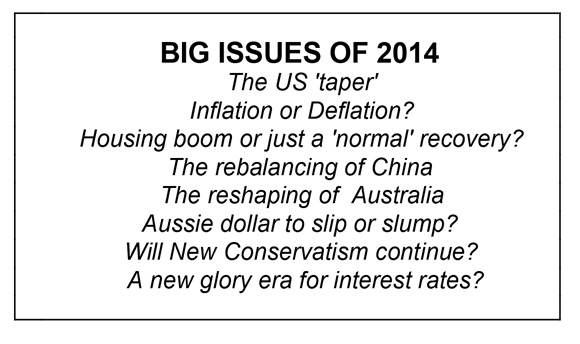
Looking ahead into 2014, we highlighted eight issues. And the first issue was The US ‘taper’. The reason why we highlighted it, is because we felt that uncertainty about the size and pace of the winding back of bond purchases would affect interest rates, sharemarkets and exchange rates. And indeed there has been volatility around the time of Federal Reserve meetings and when Federal Reserve members have given speeches. Interestingly, now that the taper has ended, the issue that has taken its place is the uncertainty about when rate hikes will begin.
Another of the Big Issues was Inflation or Deflation?. And as is clear from preceding pages, this issue has made a return this year with good reason – it still occupies the thinking of Northern Hemisphere central banks more than any other issue.
We were right to highlight the issue: Housing boom or just a ‘normal’ recovery?. Because while other central banks have worried about inflation, the Reserve Bank has debated whether so-called Macro-Prudential controls were needed to deal with exuberant borrowing by property investors.
Again, we believe that we were right in highlighting The rebalancing of China as a Big Issue for 2014. China is transitioning from an industrial powerhouse to an economy driven by the services sector. The economy has slowed over 2014 but the absolute contribution to the world economy remains bigger than any other economy.
Along a similar theme we highlighted the issue: The reshaping of Australia. It may not have elicited the same focus and attention as some of the other issues, but in February, Toyota followed the lead of Holden and Ford in announcing the closure of car manufacturing in Australia. But more positively was the November announcement of the China-Australia free trade agreement that further threw the spotlight on industrial change.
For financial markets, the fluctuations of the Aussie dollar held court and many echoed our Big Issue: Aussie dollar to slip or slump?. We noted “Over 2014 our currency strategists expect a similar trading range (to 2013), with the Aussie likely holding from the low US80s to the mid US90s.” We were in the ‘slip’ not ‘slump’ camp and this proved to be the case.
Last year we posed the question: Will New Conservatism continue? In the end, the answer was in the affirmative – much to the chagrin of the Reserve Bank Governor – he delivered a speech as recently as mid-November, encouraging businesses to invest more in their operations rather than sitting on cash reserves.
And we also posed another question: A new glory era for interest rates?. While we neglected to answer the question, we did note: “If inflation remains under control, there is no fundamental need to lift interest rates markedly.” And simply inflation was well contained in 2014, resulting in the cash rate remaining unchanged for the entire year. At present the jury is out on whether deflationary tendencies will dominate in 2015. So we could very well be headed for an era like the 1950s and 1960s when interest rates consistently held at low levels. Good news for borrowers; more challenging for investors.