Record numbers of Seniors in work. Apartment sales at 11-year highs
Detailed job data; New home sales
More seniors: The latest jobs data show that there are more people over 65 years of age in the “civilian population” than in the key “working” demographic of between 25-34 years. Participation of seniors in the workforce is at record highs. One in eight people over the age of 65 are working or looking for work.
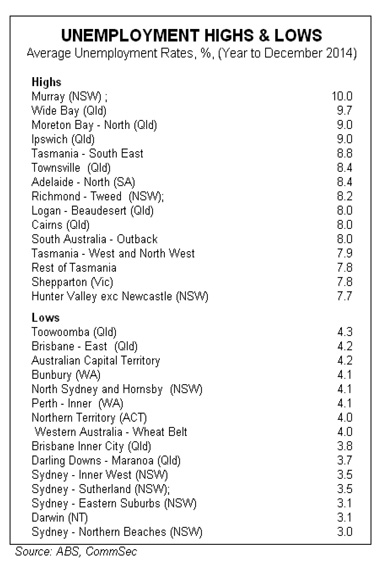
Jobless rates 2014: Unemployment averaged 6.1 per cent in 2014, up from 5.7 per cent the previous year. NSW and Queensland regions dominated both the listings of the regions with the highest unemployment rates and with the lowest unemployment rates.
New home sales rise: New home sales rose by 2.2 per cent in November after rising by 3.0 per cent in October. Sales of apartments are at 11-year highs.
What do the figures show and what does it mean?
The latest job numbers show that there are 3.52 million people over the age of 65, just ahead of the 3.50 million Australians aged between 25-34 years. And the seniors are keen to work. The participation of those 65 years and over in the workforce averaged a record 12.3 per cent in 2013, almost double the proportion as 13 years ago.
While the proportion of people in jobs or looking for work has eased in recent years, it is clear that the slowdown is driven by those under the aged of 24. Gen X and baby boomers are as active in the workforce as they have ever been.
The Murray region of NSW had the highest average unemployment rate in 2014 at 10 per cent. At the other end of the scale, the Sydney Northern Beaches had an average unemployment rate of 3 per cent. While regional jobless rates can prove volatile, the latest data confirm that the economy needs stimulatory policy settings in order to reduce high jobless rates.
Five of the 15 regions with the lowest jobless rates can be found in Sydney. The inner suburbs of Brisbane and Perth together with Darwin and Canberra also have relatively low jobless rates.
Of the 106 state and regional classifications, unemployment actually fell in 36 centres on average in 2014 with Tasmania and Northern Territory performing best.
On average, the jobless rate in Tasmania fell from 7.7 per cent to 7.2 per cent in 2014. And in the Northern Territory, the jobless rate fell from 5.1 per cent to 4.0 per cent.
Six of the 15 regions with the highest average unemployment rates in 2014 can be found in Queensland. Four of the 15 regions with the lowest average unemployment rates in 2014 can be found in Queensland. The results certainly add an extra degree of interest to the upcoming state election in Queensland.
The housing market is going from strength to strength. Dwelling starts are at record highs, pointing to strong construction ahead. And apartments are selling – with sales at 11-year highs – keeping the stock of unsold dwellings at sustainable levels. If construction was booming but sales were flagging, then this would set off warning bells about the potential for an over-supply of properties.
What do the figures show?
Detailed employment data
Apart from regional jobless rates (noted above) a raft of detailed job data was released today.
Average hours worked in 2014 was 32.7 hours per week, up from 32.0 hours in 2013, and just below the decade average of 32.9 hours.
Participation in the job market of those 20-24 years hit a record low in 2014: an average rate of 78.1 per cent. By comparison, the participation rate of those 55-59 years was at record highs of 73.2 per cent with a record participation rate of 12.4 per cent of those 65 years plus.
New home sales
New home sales increased by 2 .2 per cent in November following a lift of 3.0 per cent the previous month. Sales of multi-units surged in both October and November to reach their highest level since September 2003. But detached house sales dipped by 1.5 per cent in November 2014.
In November, detached house sales increased by 4.0 per cent in Victoria, rose by 16.0 per cent in Queensland, and rose 0.3 per cent in South Australia. Detached house sales fell in November in New South Wales (down 5.6 per cent) and Western Australia (down 10.6 per cent, after rising 24.8 per cent in October).
The Housing Industry Association releases data on the sales of new homes each month. The HIA collects the data each month from a sample of Australia’s largest 100 home builders. The survey covers around 14 per cent of the home building industry.
The Australian Bureau of Statistics (ABS) provides detailed labour market figures one week after releasing ‘top level’ statistics of employment & unemployment levels across states and territories. The detailed data is useful in identifying broader underlying trends and instructive about the health of the economy.
The job market is much more of a mixed picture than many assume. Investors need to pay more attention to the financial imperatives facing older Australians in order to get a better handle on the economy. No doubt the significant shift of worker numbers to older Australians has contributed to the ABS problems in calculating top level unemployment numbers. The fact that the numbers of those 65 years and above has exceeded the numbers between 25-34 years highlights the challenges for the Federal Budget in coming years.
What is the importance of the economic data?
The Housing Industry Association releases data on the sales of new homes each month. The HIA collects the data each month from a sample of Australia’s largest 100 home builders. The survey covers around 14 per cent of the home building industry.
The Australian Bureau of Statistics (ABS) provides detailed labour market figures one week after releasing ‘top level’ statistics of employment & unemployment levels across states and territories. The detailed data is useful in identifying broader underlying trends and instructive about the health of the economy.
What are the implications for interest rates and investors?
The job market is much more of a mixed picture than many assume. Investors need to pay more attention to the financial imperatives facing older Australians in order to get a better handle on the economy. No doubt the significant shift of worker numbers to older Australians has contributed to the ABS problems in calculating top level unemployment numbers. The fact that the numbers of those 65 years and above has exceeded the numbers between 25-34 years highlights the challenges for the Federal Budget in coming years.