Nikko AM Australia’s Energy Analyst, Warwick Cumming, recently visited the US to meet with shale oil and gas producers, gas consumers, service providers, consultants and brokers to gain an insight into how various Australian companies may be affected by the dramatic changes in the energy market.
Broadly, the outlook for the major energy commodities is as follows:
- Shale oil is free cash flow negative at spot prices – negative for BHP Billiton (BHP).
- Oil to be in oversupply well into calendar year 2016 (CY16) with a sustained recovery occurring in CY17.
- Natural gas to be in abundant supply in the USD 3 – USD 4/mmbtu (million British thermal units) range – positive for Incitec Pivot (IPL).
- Liquified natural gas (LNG) to be in oversupply until 2020 – negative for Santos (STO), Origin (ORG), less so for Woodside (WPL) and Oil Search (OSH).
This makes no allowance for the geo-political risks that are always a part of the oil market. The greatest risks come from a collapse of production in Venezuela and Nigeria, where both countries are struggling to maintain public order in the face of collapsing government finances.
Oil market dominated by shale efficiencies
Much of the focus in the oil market has been on how much shale oil production will close as a result of the price collapse and will this balance the market? However, production has proved to be far more resilient than expected with production costs falling from USD 80/bbl (barrel) to below USD 60/bbl.
The two factors contributing to this reduction in costs have been the sharp reduction in costs and the ongoing increase in productivity.
Capital expenditure has been cut by concentrating drilling on the most productive fields and suspending drilling in marginal fields and on new exploration. Chart 1 shows that the rig count has fallen sharply but only to levels seen in previous cycles. These reductions are not limited to US onshore. Since August 2014 when the oil price started to slide, the rig count in the Gulf of Mexico is down 46% and worldwide by 19%. This will ultimately reduce production and underpin a price recovery.
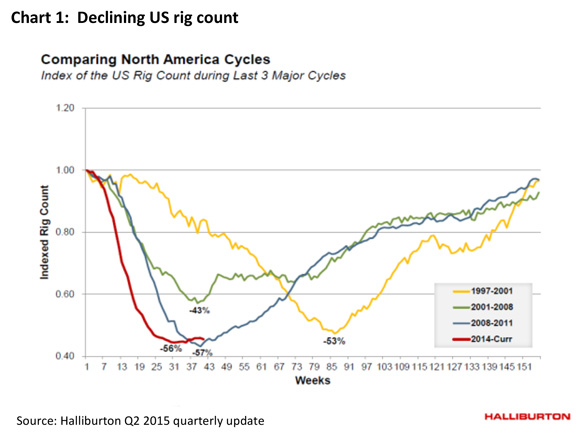

Operating costs have been cut by squeezing service providers. Halliburton, the largest of the US service providers has seen its margins decline and believes the industry is at or below breakeven in the third quarter. It sees further productivity gains and in its 2015 Q2 report is targeting its “future frack” as being 20% less capital, 35% less personnel and 40% less completion time.
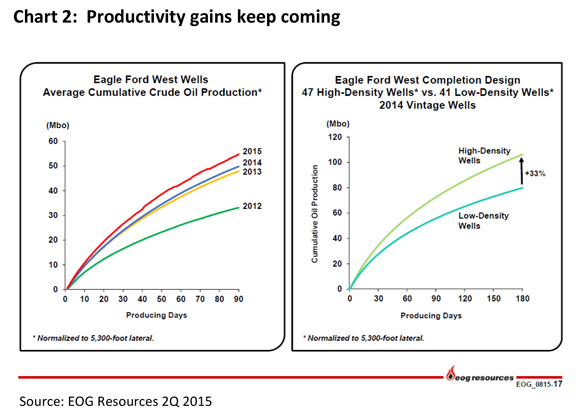
Productivity continues to increase. In three years, well spacing has fallen from 160 acres per well to 80, with 40 now being the norm and 20 acre spacing being achieved without any interference on adjoining wells in some areas. EOG Resources, one of the industry’s most innovative players, shows in chart 2 that it has increased output by 30% from its use of high density fracking.

However, the crunch for onshore production is expected in the coming six months and it will be driven by tighter financing.
According to Citi, US shale production as an industry has been free cash flow negative since 2010. It has required external funding from equity and debt markets to fund its shortfall and benefited from oil price hedging which is now rolling off. Reserve-based lending is reviewed on a six monthly basis with the next due in October. This bank lending is secured against the value of a company’s reserves using the forward curve which is 20% below the last review in April. In addition, US financial regulators have identified oil and gas as a source of lending risk to be carefully monitored. As this source of funding reduces and hedging expires, further cuts in US production are expected. Depending on where the oil price settles, this could be between 0.5 – 1 mmbbl per day which represents up to 25% of US shale production.
Is this enough to rebalance the market?
The market needs more than the above cuts to be balanced given the growth in OPEC (Organization of the Petroleum Exporting Countries) production and the weakness in demand. Saudi Arabia and Iraq have both increased production and Iranian production will grow with the progressive lifting of sanctions.
Consultants such as Wood Mackenzie and Facts, in addition to investment banks UBS, Citi and Goldman Sachs, see oversupply continuing into 2016. It is not until 2017 that a sustained recovery in prices toward USD 70/bbl is expected.
BHP is the only major S&P/ASX 200 company to have exposure to US shale oil production. It has cut capex from USD 3.7 billion to USD 1.5 billion and has achieved significant operating cost reductions. However, JP Morgan estimates that at current spot prices the US onshore operations are free cash flow negative – i.e. BHP does not recover the cost of drilling and operating a well. This exacerbates BHP’s current balance sheet problem, where it has to borrow to meet its commitment to a progressive dividend.
From gas importer to gas exporter
Gas was the initial beneficiary of the fracking revolution. In five years the US has gone from being a net importer to a net exporter in 2016 and having 100 years of gas resources at current levels of production.
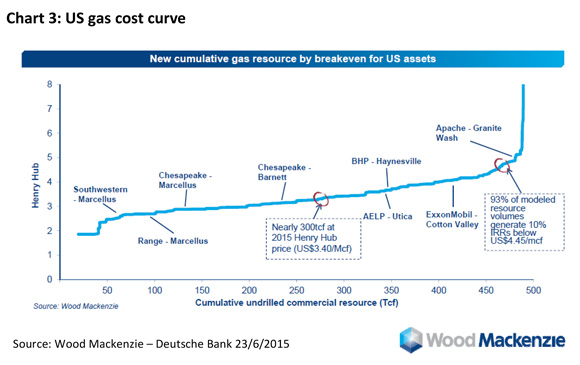

Chart 3 shows that the bulk of this gas is available at between USD 3 – USD 4/mmbtu. This may not be good news for a producer like BHP, but it is great news for a consumer such as Incitec Pivot (IPL).
IPL is building an USD 850 million ammonia plant, of which gas accounts for 75% of the operating cost. Due to the fall in the gas price, the return on the project is now looking better than was originally anticipated.
LNG production explosion
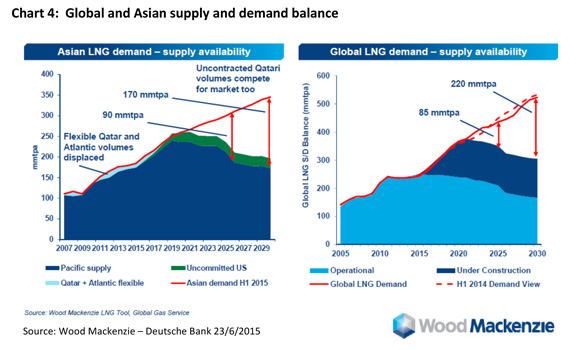
The global LNG market is expected to be in oversupply following the completion of 15 LNG trains in Australia and Papua New Guinea (PNG) from 2014 to 2016 and a similar number coming into production on the US gulf coast from 2016 to 2020. The explosion of US production has been driven by cheap US gas. When the oil price was at USD 100/bbl, traditional oil-linked LNG pricing into Asia was USD 15/mmbtu. US production based on Henry Hub gas pricing could be delivered into Asia at USD 10 – USD 11/mmbtu.
However, at the current oil price, oil-linked LNG contracts are now cheaper that Henry Hub-priced contracts and the US expansion has come to an abrupt halt. Chart 4 shows that the market is forecast to be in oversupply until 2021 when uncontracted demand reappears.

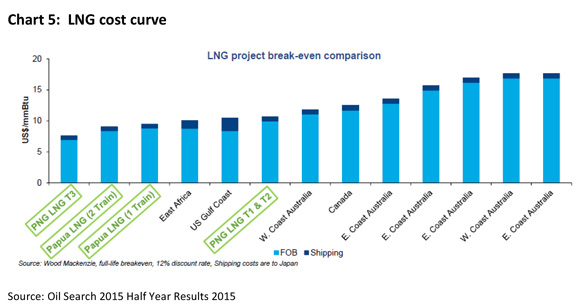
Given the four year construction time for new plants, contracts have to be awarded by 2017. Chart 5 shows that the lowest cost future projects are located in PNG. OSH has exposure to all of these projects, hence the takeover offer from WPL, whose Browse project sits mid-way up the cost curve.
The depressed LNG price in coming years will make life difficult for STO and ORG, whose high-cost Gladstone-based coal seam gas projects are just starting production. The reason for PNG’s advantage is the large conventional gas reservoirs that are rich in valuable liquid by products, in comparison to the unconventional East Coast coal seam fields that have high collection costs and no associated liquids.

By Warwick Cumming, Senior Analyst & Deputy Head of Australian Equities
———–