Key points
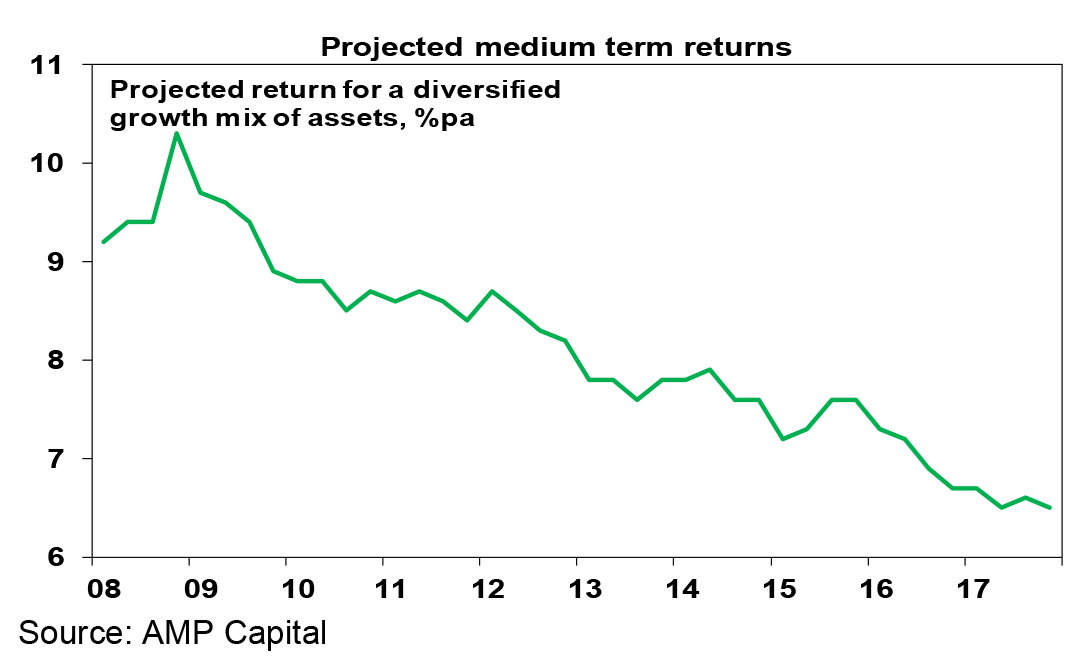
- A further fall in investment yields across most major asset classes points to a constrained medium term return outlook. For a diversified mix of assets, this has now fallen to around 6.5% on our projections.
- For investors the key remains to: have realistic return expectations; allow that inflation is also low so real returns aren’t down as much; focus on asset allocation; and focus on assets with decent & sustainable income.
Introduction
The last five years have seen strong returns for diversified investors thanks to double digit gains in shares (after a rebound from a mini bear market around the Eurozone crisis) and solid returns from unlisted commercial property and infrastructure. For example, balanced superannuation funds saw median returns of 9.3% per annum over the five years to September (after taxes and fees). Despite this our assessment remains that medium term (ie 5-10 year) returns will be constrained because of low investment yields across most asset classes.
Back in the early 1980s the medium term return potential from investing was pretty solid. The RBA’s “cash rate” was around 14%, 3-year bank term deposit rates were around 12%, 10-year bond yields were around 13.5%, property yields were running around 8-9% and dividend yields on shares were around 6.5% in Australia and 5% globally. Such yields meant that investments were already providing very high cash income and only modest capital growth was necessary for growth assets to generate good returns. As it turns out most assets had spectacular returns in the 1980s and 1990s and superannuation fund returns averaged 14.1% in nominal terms and 9.4% in real terms between 1982 and 1999 (after taxes and fees).
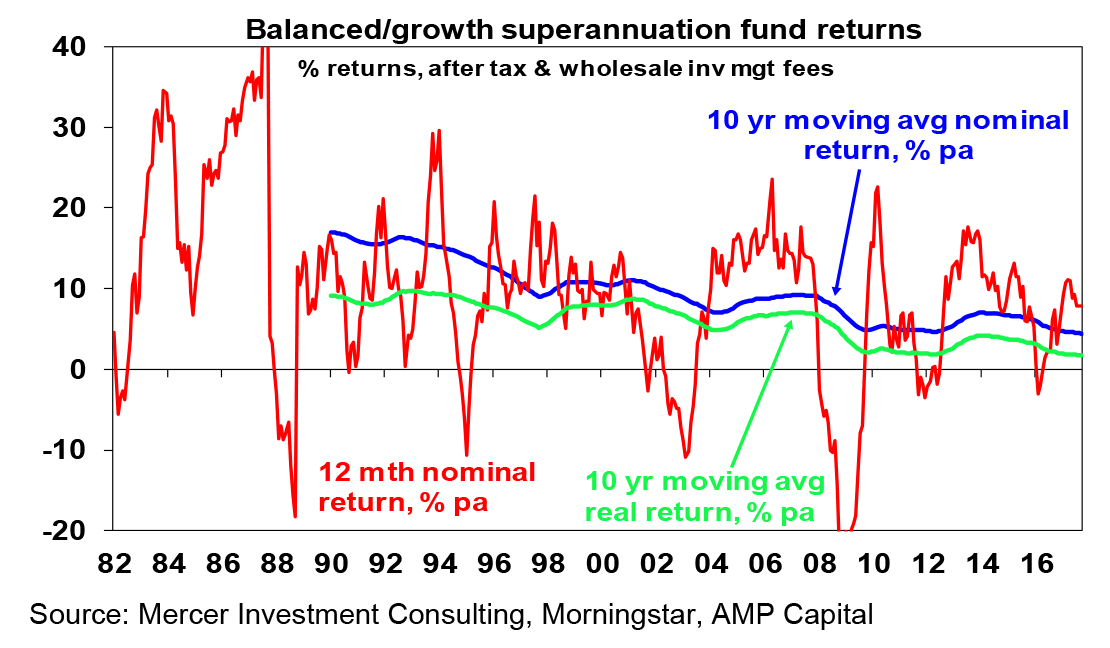

Since the early 1980s starting point investment yield have collapsed, resulting in slowing 10-year average nominal and real returns for superannuation funds as seen the chart above. Today the RBA cash rate is just 1.5%, 3-year bank term deposit rates are just 2.5%, 10-year bond yields are just 2.6%, gross residential property yields are around 3% and while dividend yields are still around 5.6% for Australian shares (with franking credits) they are around 2.4% for global shares.
Starting point yield matters – a lot!
Investment returns have two components: capital growth and yield (or income flow). The yield is the most secure component and generally speaking the level it starts at when you undertake the investment is key – the higher the better. So our approach to get a handle on medium term return potential is to start with current yields for each asset class and apply simple and consistent assumptions regarding capital growth. We also prefer to avoid a reliance on forecasting and to keep the analysis as simple as possible. Complicated adjustments and forecasting can just lead to compounding forecasting errors.
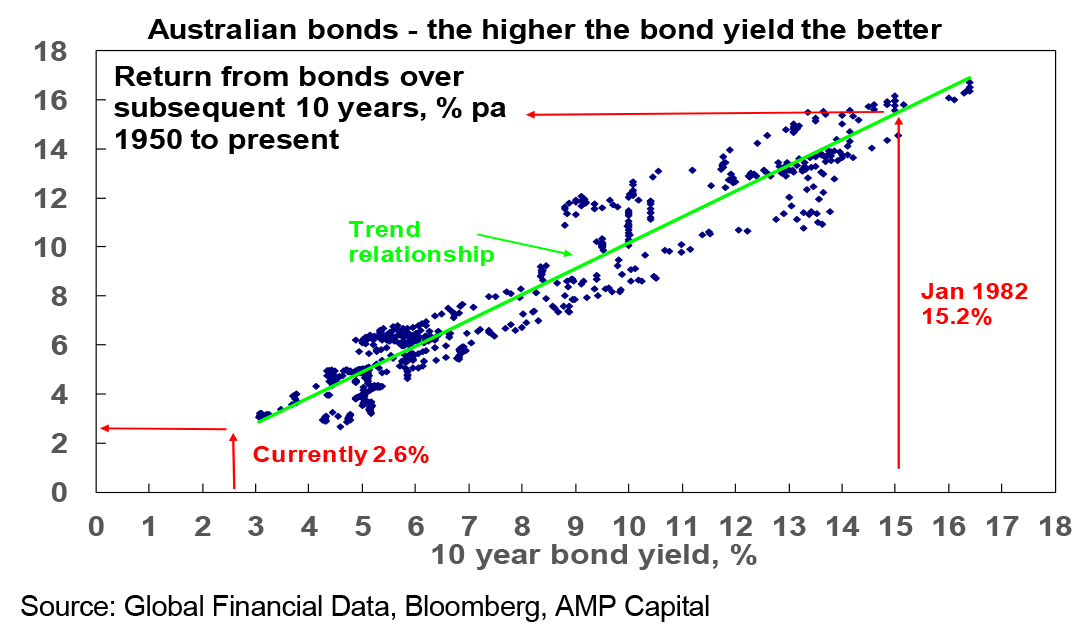
- For bonds, the best predictor of future medium term returns is current bond yields. If a 10-year bond is held to maturity its initial yield will be its return over 10 years. It can be seen in the next chart that the higher the starting point bond yield, the higher the subsequent return. We use 5-year bond yields as they roughly match the maturity of bond indexes.

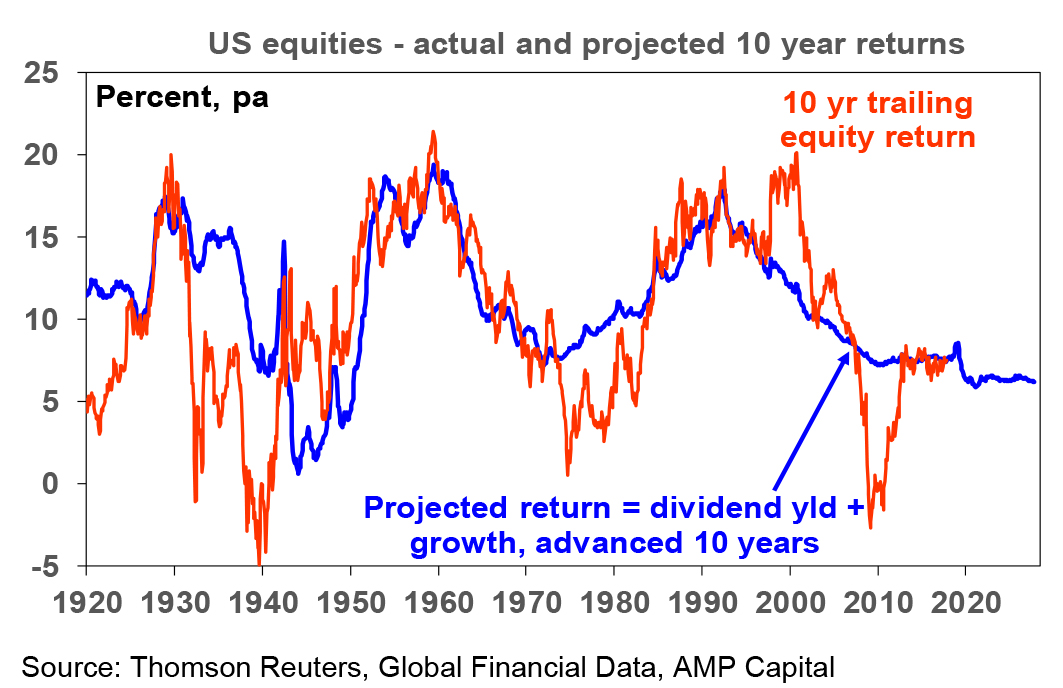
- For equities, a simple model of current dividend yields plus trend nominal GDP growth (as a proxy for earnings and capital growth) does a good job of predicting medium term returns. This approach allows for current valuations (via the yield) but avoids getting too complicated.[1] The next chart shows this approach applied to US equities, where it can be seen to broadly track the big secular swings in returns.

- For property, we use current rental yields and likely trend inflation as a proxy for rental and capital growth.
- For unlisted infrastructure, we use current average yields and capital growth just ahead of inflation.
Medium term return projections
Our latest return projections using this approach are shown in the next table. The second column shows each asset’s current income yield, the third shows their 5-10 year growth potential, and the final column their total return potential. Note that:
- We assume central banks average around or just below their inflation targets, eg 2.5% in Australia & 2% in the US.
- For Australia we have adopted a relatively conservative growth assumption reflecting constrained commodity prices and slower productivity growth.
- We allow for forward points in the return projections for global assets based around current market pricing – which adds 1% to the return from world equities.
- The Australian cash rate is assumed to average 2.75% over the medium term. Cash is one asset where the current yield is of no value in assessing the asset’s medium term return potential because the maturity is so short. So we assume a medium term average. Normally for cash this would be around a country’s potential nominal growth rate, but we have adjusted for higher than normal bank lending rates relative to the cash rate and higher household debt to income ratios which have pulled down the neutral cash rate.
Combining the return projections for each asset indicates that the implied return for a diversified growth mix of assets has now fallen to 6.5% pa and is shown in the final row.


Megatrends influencing the growth outlook
The assumptions for nominal growth used in these projections allow for several medium term themes: slower than pre-GFC growth in household debt; an ongoing backlash against the economic rationalist policies of globalisation, deregulation and small government; rising geopolitical tensions; aging and slowing populations; constrained commodity prices; technological innovation & automation; rapid growth in Asia and China’s growing middle class; rising environmental awareness; and the energy revolution. Most of these are constraining nominal growth and hence investor returns. However, technological innovation is positive for profits and some of these point to inflation bottoming. (See “Megatrends…”, Oliver’s Insights, July 2016.)
Key observations
Several things are worth noting from these projections.
The medium term return potential using this approach has continued to soften due largely to the rally in most assets which has pushed investment yields lower. Projected returns using this approach for a diversified growth mix of assets has fallen from 10.3% pa at the low point of the GFC in March 2009 to 6.5% now.

- The starting point for returns today is far less favourable than when the last secular bull market in shares and bonds started in 1982, due to much lower yields.
- Government bonds offer low return potential thanks to ultra low bond yields.
- Unlisted commercial property and infrastructure continue to come out relatively well, reflecting their relatively high yields.
- Australian shares stack up well on the basis of yield, but it’s still hard to beat Asian/emerging shares for growth potential.
- The downside risks to our medium term return projections are that: the world is plunged into another recession or that investment yields are pushed up to more normal levels as inflation rebounds causing large capital losses. These risks are referred to endlessly by financial commentators – but just allow that drawdowns in returns tend to be infrequent but concentrated and it’s been a while since the last big one.
- The upside risks are (always) less obvious but could occur if we see a continuation of the last year, ie improving global growth but inflation remaining low which could see a continuing search for yield further pushing up capital values.
Implications for investors
- First, have reasonable return expectations. Low investment yields & constrained nominal GDP growth indicate it’s not reasonable to expect sustained double digit returns. In fact, the decline in the rolling 10-year average of superannuation fund returns (first chart) indicates we have been in a lower return world for many years – it’s just that it only becomes clear every so often with strong returns in between.
- Second, allow that this partly reflects very low inflation. Real returns haven’t fallen as much.
- Third, using a dynamic approach to asset allocation makes sense as a way to enhance returns when the return potential from investment markets is constrained.
- Finally, focus on assets providing decent and sustainable income flow as they provide confidence regarding future returns, eg, commercial property and infrastructure.
By Dr Shane Oliver, Head of Investment Strategy and Chief Economist
——–