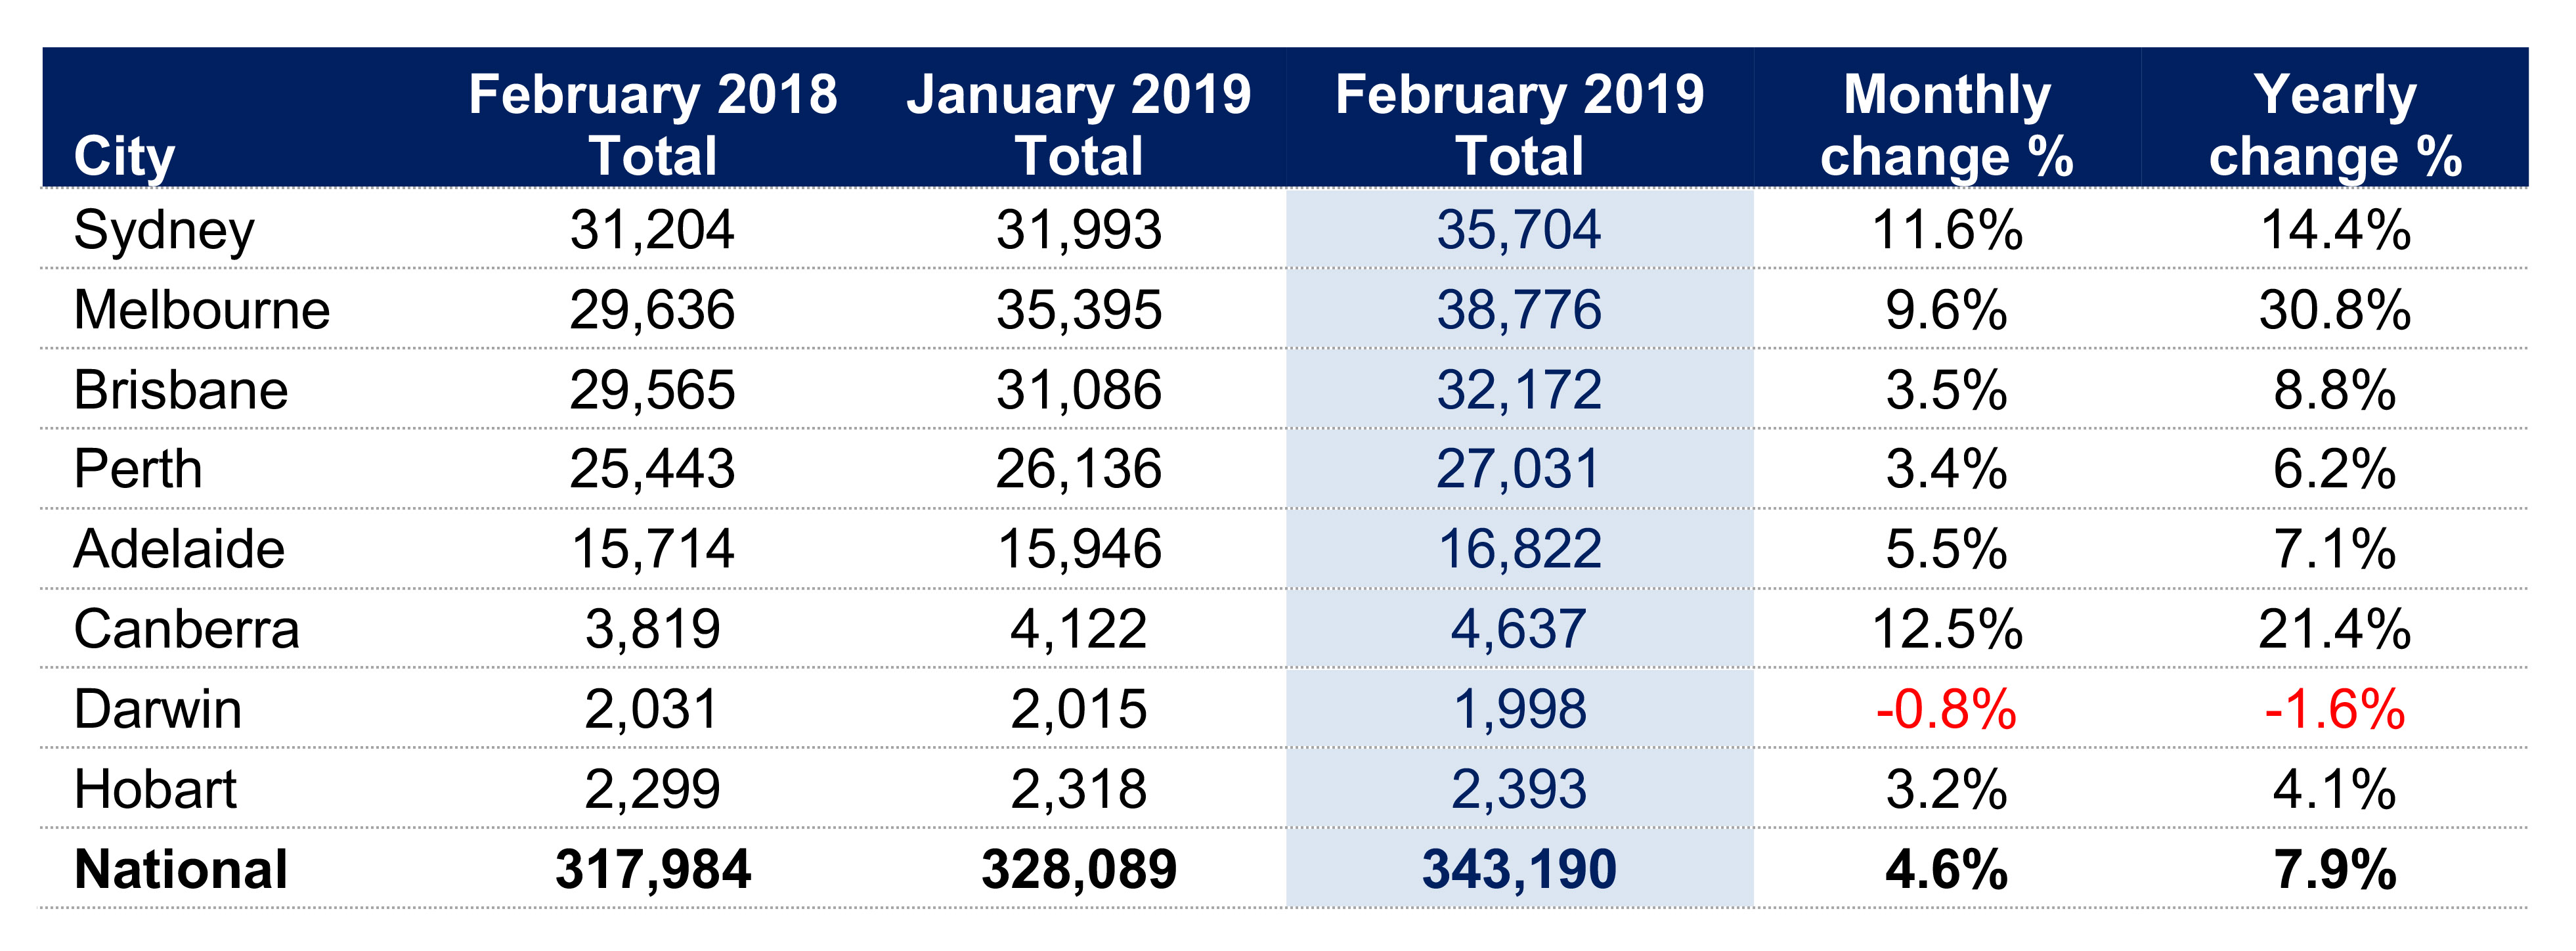
Figures released yesterday by SQM Research reveal national residential listings increased by 4.6% in February 2019 to 343,190 from 328,089 in January 2019 as homeowners re-emerged from the summer break to list their properties for sale.
All states experienced an increase in listings except for Darwin which was down 0.8% in February and down 1.6% year-on-year.
Canberra recorded the highest increase in listings at 12.5%, followed by Sydney at 11.6% and Melbourne 9.6%. Hobart recorded the lowest increase at 3.2%.
Compared to a year ago, national listings rose 7.9%. Melbourne’s year-on-year listings was the highest at 30.8%, followed by Canberra at 21.4%.

Louis Christopher, Managing Director of SQM Research, said: “The rise in February listings was expected as homeowners listed their properties with the new year well underway. The year-on-year listings, together with ongoing falls in asking prices still provide evidence of a weak national housing market.”
“Darwin was the only city to record a drop in listings, falling by 0.8% for the month.”
Asking prices
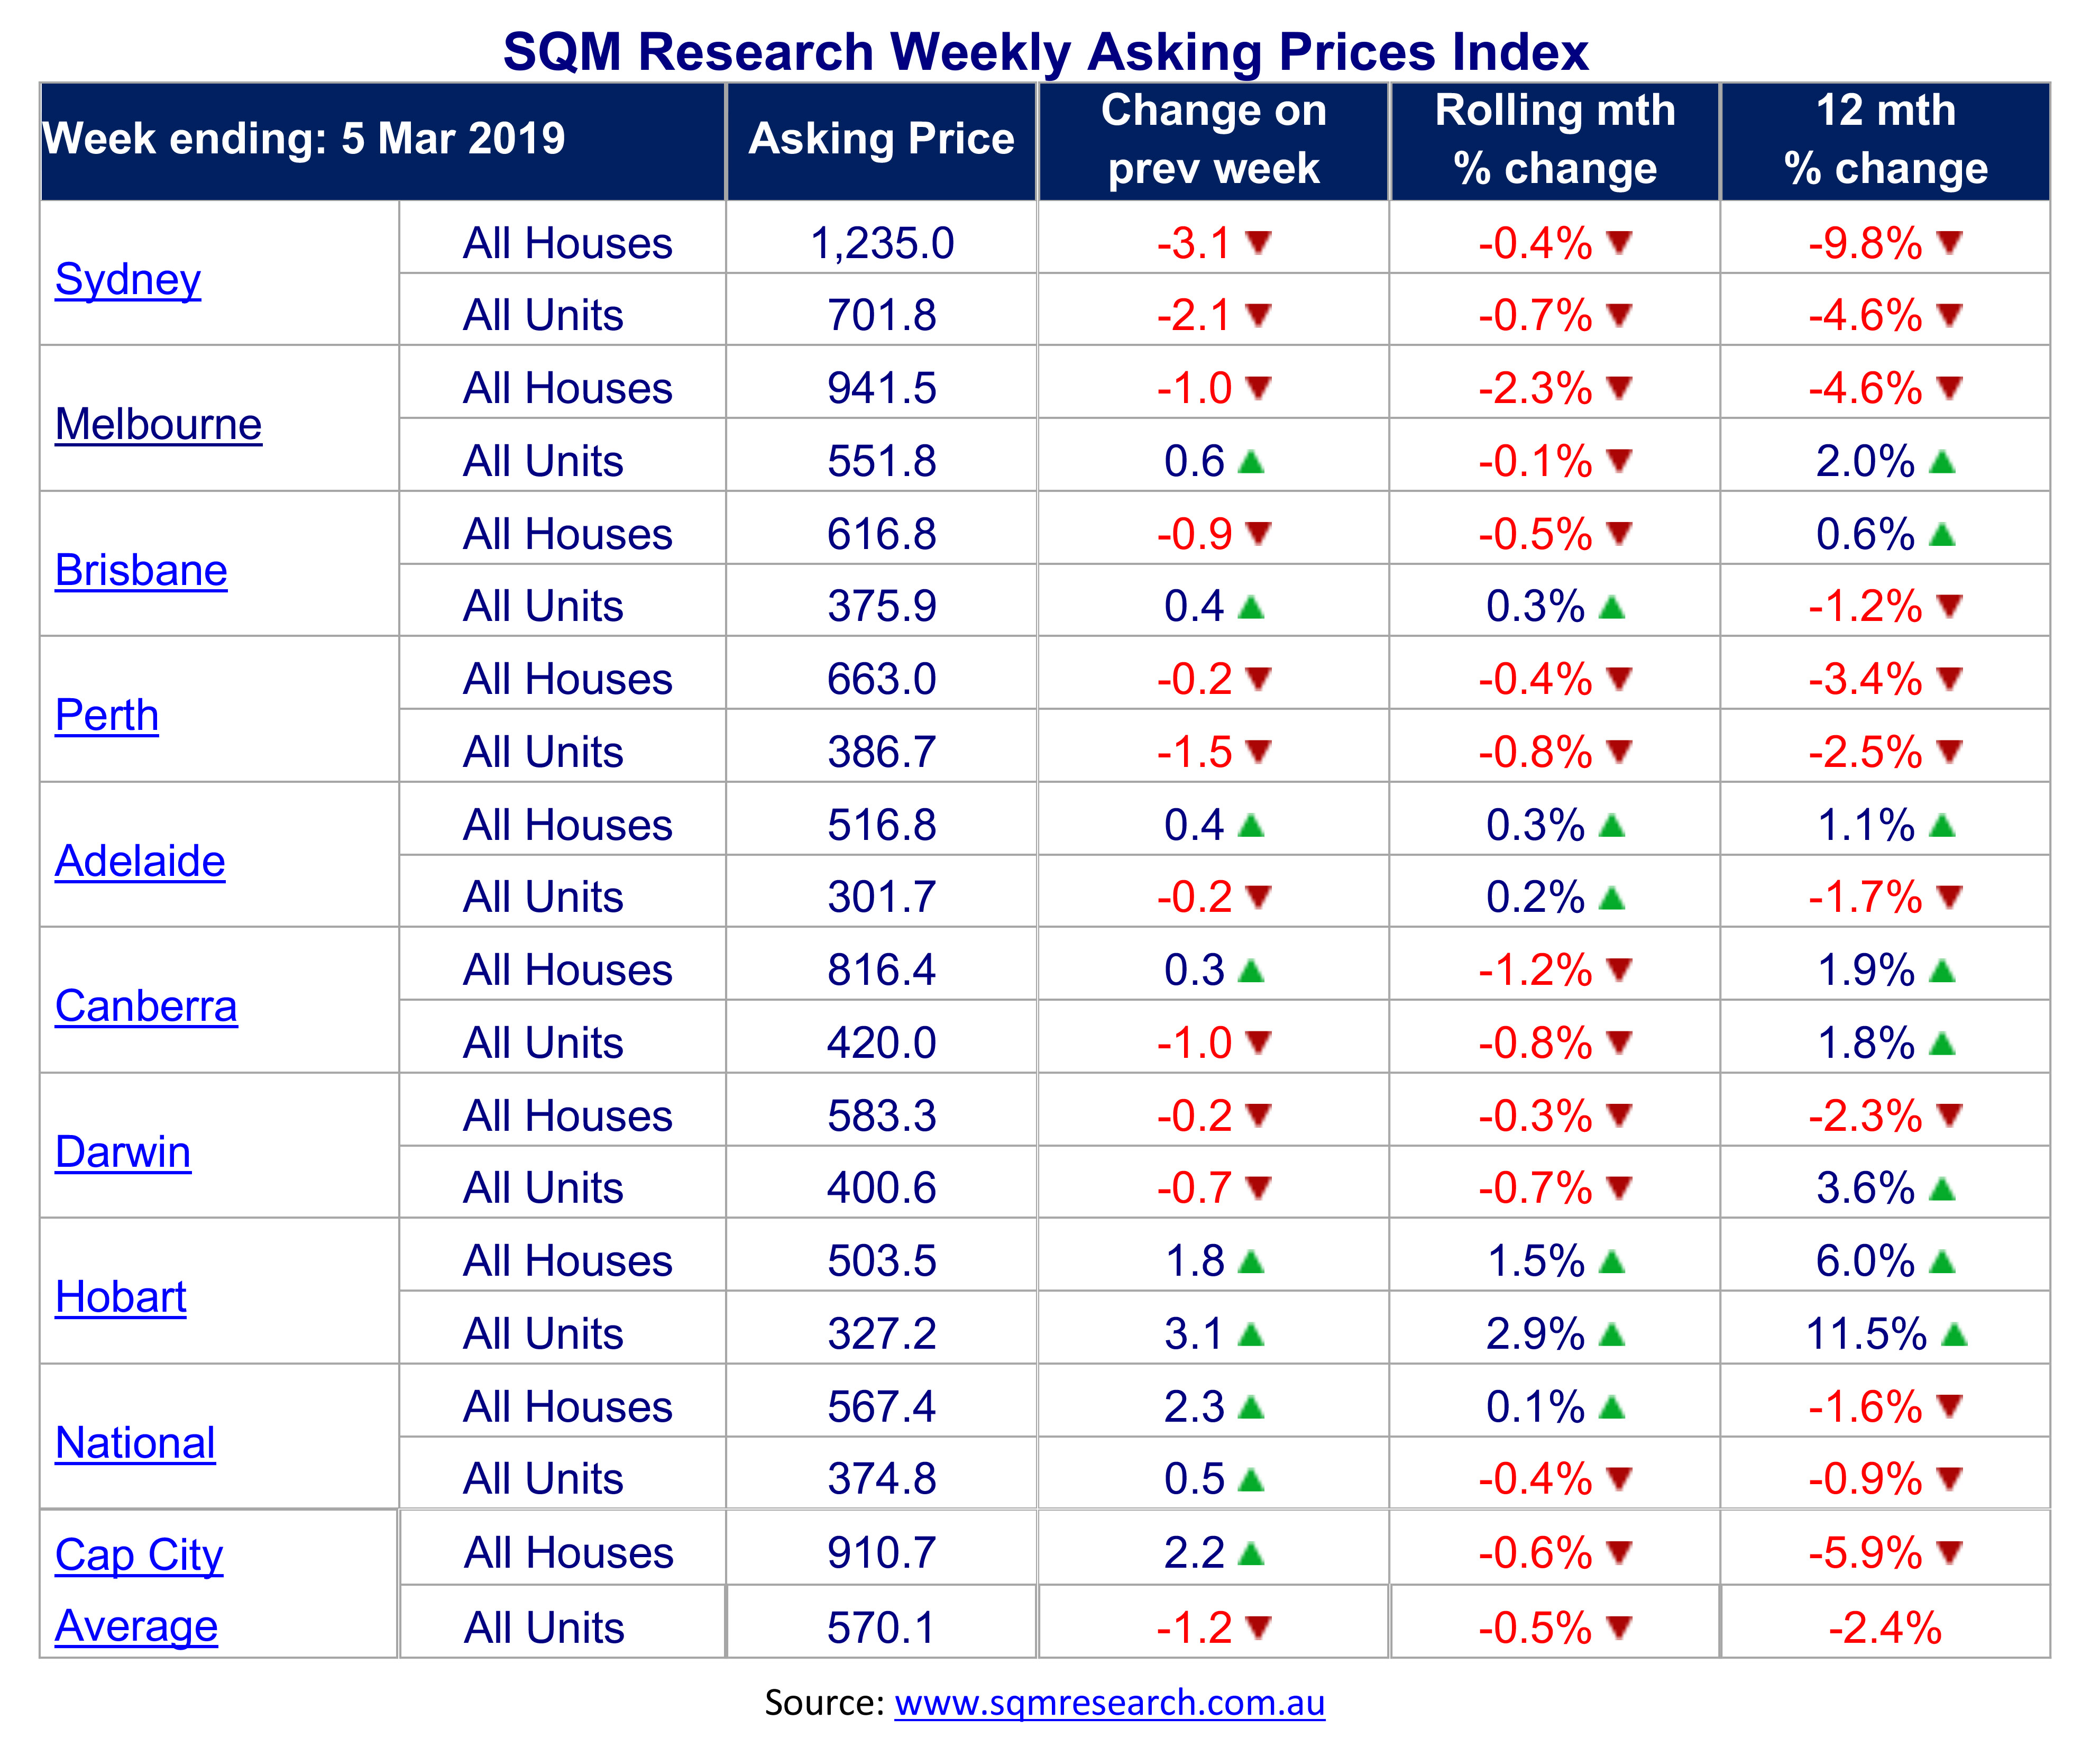
Capital City asking prices for units and houses declined by 0.5% and 0.6% respectively, for the month to 5 March 2019. Unit asking prices are now $570,100 and houses $910,700.
Melbourne’s house asking prices saw the largest monthly decline of 2.3%. The city’s unit prices declined by a modest 0.1%.
Hobart is still outperforming all states, posting increases in both unit and house asking prices over the month of 2.9% and 1.5% respectively. Adelaide is also slowly bouncing back with increases in unit prices of 0.2% and house prices of 0.3% over the month. Whilst Brisbane managed a 0.3% increase in units but a 0.5% decline in house prices.
Year-on-year capital city asking prices also experienced declines of 2.4% for units and 5.9% for houses, with Hobart continuing to show the strongest growth for both houses and units with a 6.0% increase in houses and 11.5% for units. Canberra also experienced yearly growth with 1.9% increase in houses and 1.8% increase in units. Sydney’s 12 month decline is now 9.8% for houses and 4.6% for units.

Key Points
- National residential listings increased by 6% in February 2019 to 343,190 from 328,089 in January 2019.
- All states experienced an increase in listings except for Darwin which was down 8%
- Canberra recorded the highest increase in listings at 5%.
- Hobart recorded the lowest increase at 2%.
- Capital City asking prices for units and houses declined by 5% and 0.6% respectively, for the month to 5 March 2019. Unit asking prices are now $570,100 and houses $910,700.
- Hobart is still outperforming all states, posting increases in both unit and house asking prices over the month of 9% and 1.5% respectively.
- Adelaide is also slowly bouncing back with increases in unit prices of 2% and house prices of 0.3% over the month.