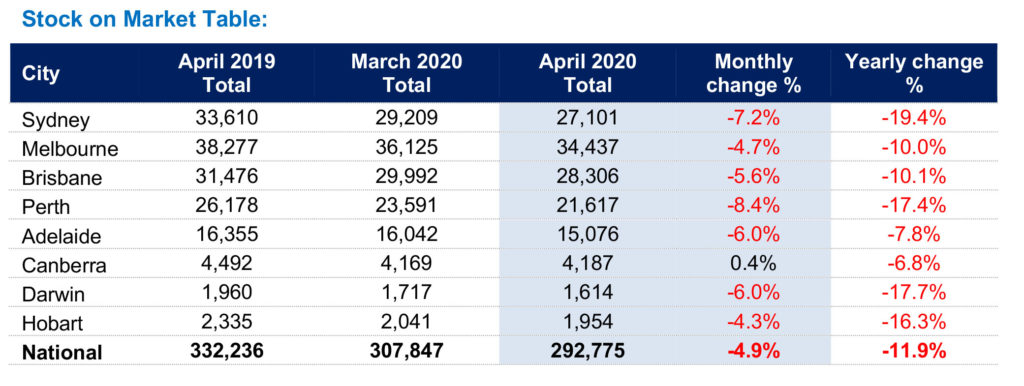
Figures released yesterday by SQM Research reveal national residential property listings decreased in April by 4.9% from 307,847 listings in March 2020 to 292,775. Compared to 12 months ago, listings were down by 11.9%.
All capital cities experienced decreases in property listings over the month except for Canberra which posted a marginal 0.4% increase.
The largest decrease was in Perth with an 8.4% decrease, followed by Sydney at 7.2% and Adelaide and Darwin both posted 6.0% decreases in property listings. Hobart had the smallest decrease of 4.3% in listings.
Year-on-year listings show more significant declines for all capital cities with Sydney recording a decline of 19.4%, followed by Darwin with a 17.7% decline and Perth a 17.4% decline this time last year.

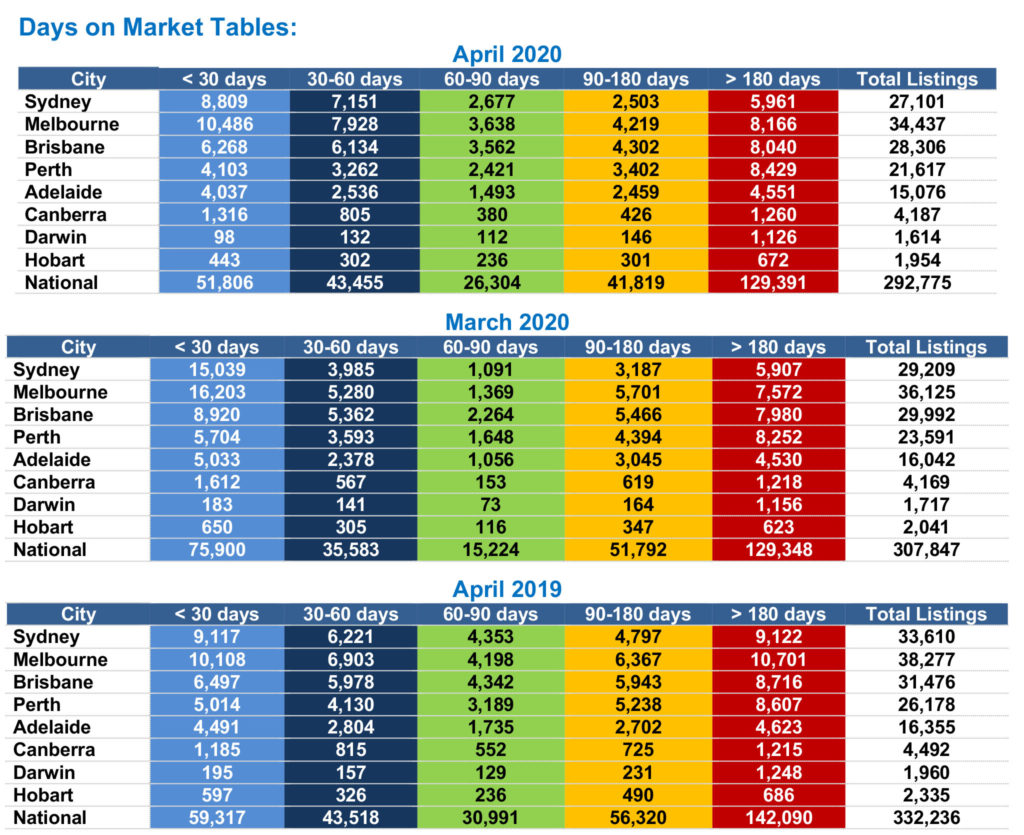
Louis Christopher, Managing Director of SQM Research said, “We confirm there was a large fall in new listings recorded over the course of April which impacted every capital city. We also note the surge in older listings, particularly for properties that have been on the market between 30 to 60 days. This tells me that sellers struggled to sell their properties over April and new sellers deferred listing. The housing market has clearly been weakened by coronavirus and the restrictions placed on the economy to limit the outbreak. With the lifting some restrictions over the course of May, we could see a lift in buyer activity for housing; however many issues persist such as the spike in unemployment and the ongoing closure of the international border.”

Asking prices
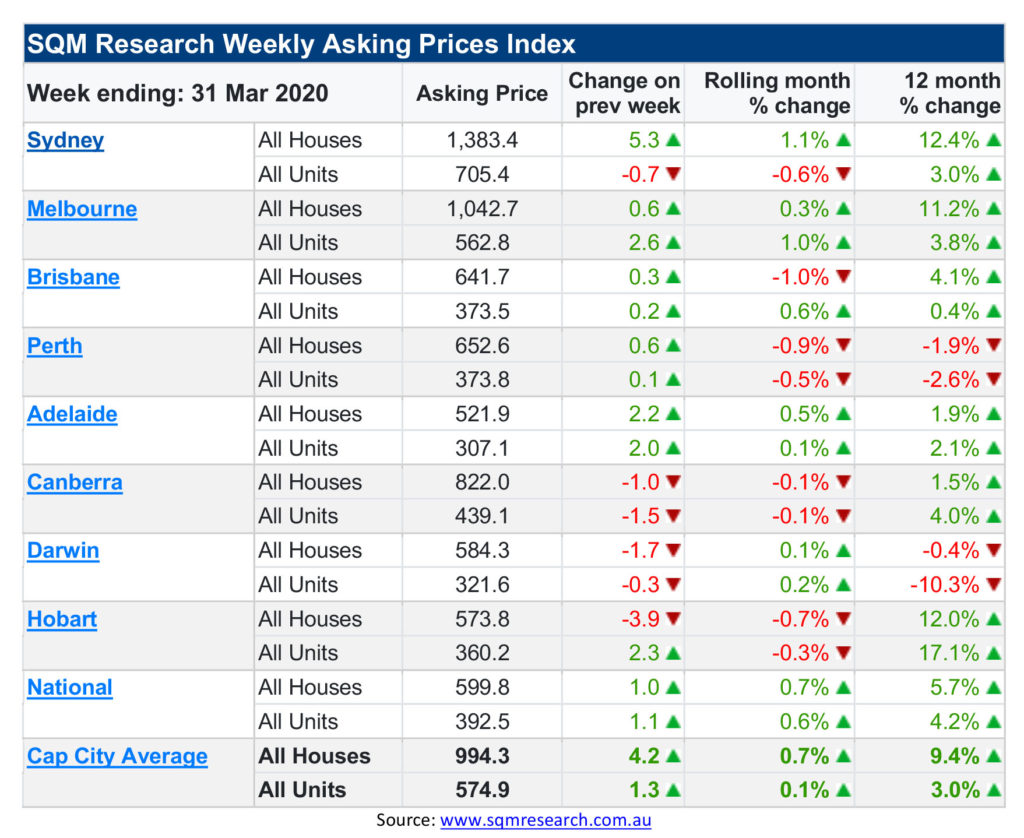
Capital City asking prices increased by 0.7% for houses and increased 0.1% for units, over the month to 5th May 2020. Unit asking prices are now at $574,900 and houses $994,300.
Compared to a year ago, the capital city asking prices posted increases of 9.4% for houses and 3.0% increase for units.
Over the month, some capital cities recorded marginal asking price increases, with the exception of Perth, Canberra and Hobart which all recorded declines for both houses and units.
Brisbane recorded the highest decline in house prices of 1.0% over the month, followed by Perth 0.9%, Hobart 0.7% and Canberra 0.1% decline in house prices.
Unit prices declined in Sydney by 0.6%, Perth 0.5%, Hobart 0.3% and Canberra 0.1%.
Melbourne, Adelaide and Darwin were the only capital cities to record increases in both house and unit prices. Strongest monthly growth was seen in Sydney house prices with a 1.1% increase and Melbourne’s unit market which saw a 1.0% increase.
Year on year, it was only Perth and Darwin that experienced declines in house and unit prices. All other capital cities showed some strong growth this time last year where house prices rose 12.4% in Sydney, 11.2% in Melbourne and 12.0% in Hobart.

Key points
- National residential property listings decreased in April by 9% from 307,847 listings in March 2020 to 292,775. Compared to 12 months ago, listings were down by 11.9%.
- All capital cities experienced decreases in property listings over the month except for Canberra which recorded a 4% increase.
- Perth had the largest decrease of 4%, followed by Sydney at 7.2%.
- There was a surge in listings that have been on the market between 30 to 60 days, suggesting a drop in sales activity for the month.
- Capital City asking prices increased by 7% for houses and increased 0.1% for units, over the month to 5th May 2020. Unit asking prices are now at $574,900 and houses $994,300.
- Compared to a year ago, the capital city asking prices posted increases of 4% for houses and 3.0% increase for units.