

Elayne Grace
The Australian Actuaries Climate Index shows that the Spring of 2020 exhibited extreme weather in comparison with the same season in previous years. While a temperature index value of this level in the Spring reflects less severe overall conditions than would be seen in Summer, it remains a noteworthy data point in the ongoing trend towards more extreme weather in Australia.
The Australian Actuaries Climate Index is updated every quarter. It shows changes in the frequency, or rate of occurrence, of extreme high and low temperatures, heavy precipitation, dry days, strong winds and changes in sea levels across 12 regions that are climatically similar. Each season is compared to the same season in previous years and against a reference period of 1981-2010.
The Index is designed to provide an easy to interpret and valuable metric for actuaries, policy decision makers and the general public to refer to when monitoring changes in climate. It was launched by the Actuaries Institute in 2018.
“The trend in the Index is in line with the predictions by many scientists as to what a changing climate could look and feel like,” said Actuaries Institute Chief Executive, Elayne Grace.
“The Index is a great example of how Actuaries are expanding their frontiers into a wide range of fields. Their strong skills in navigating uncertainty and interpreting complex data are more valuable than ever,” added Jefferson Gibbs, Actuaries Institute President.
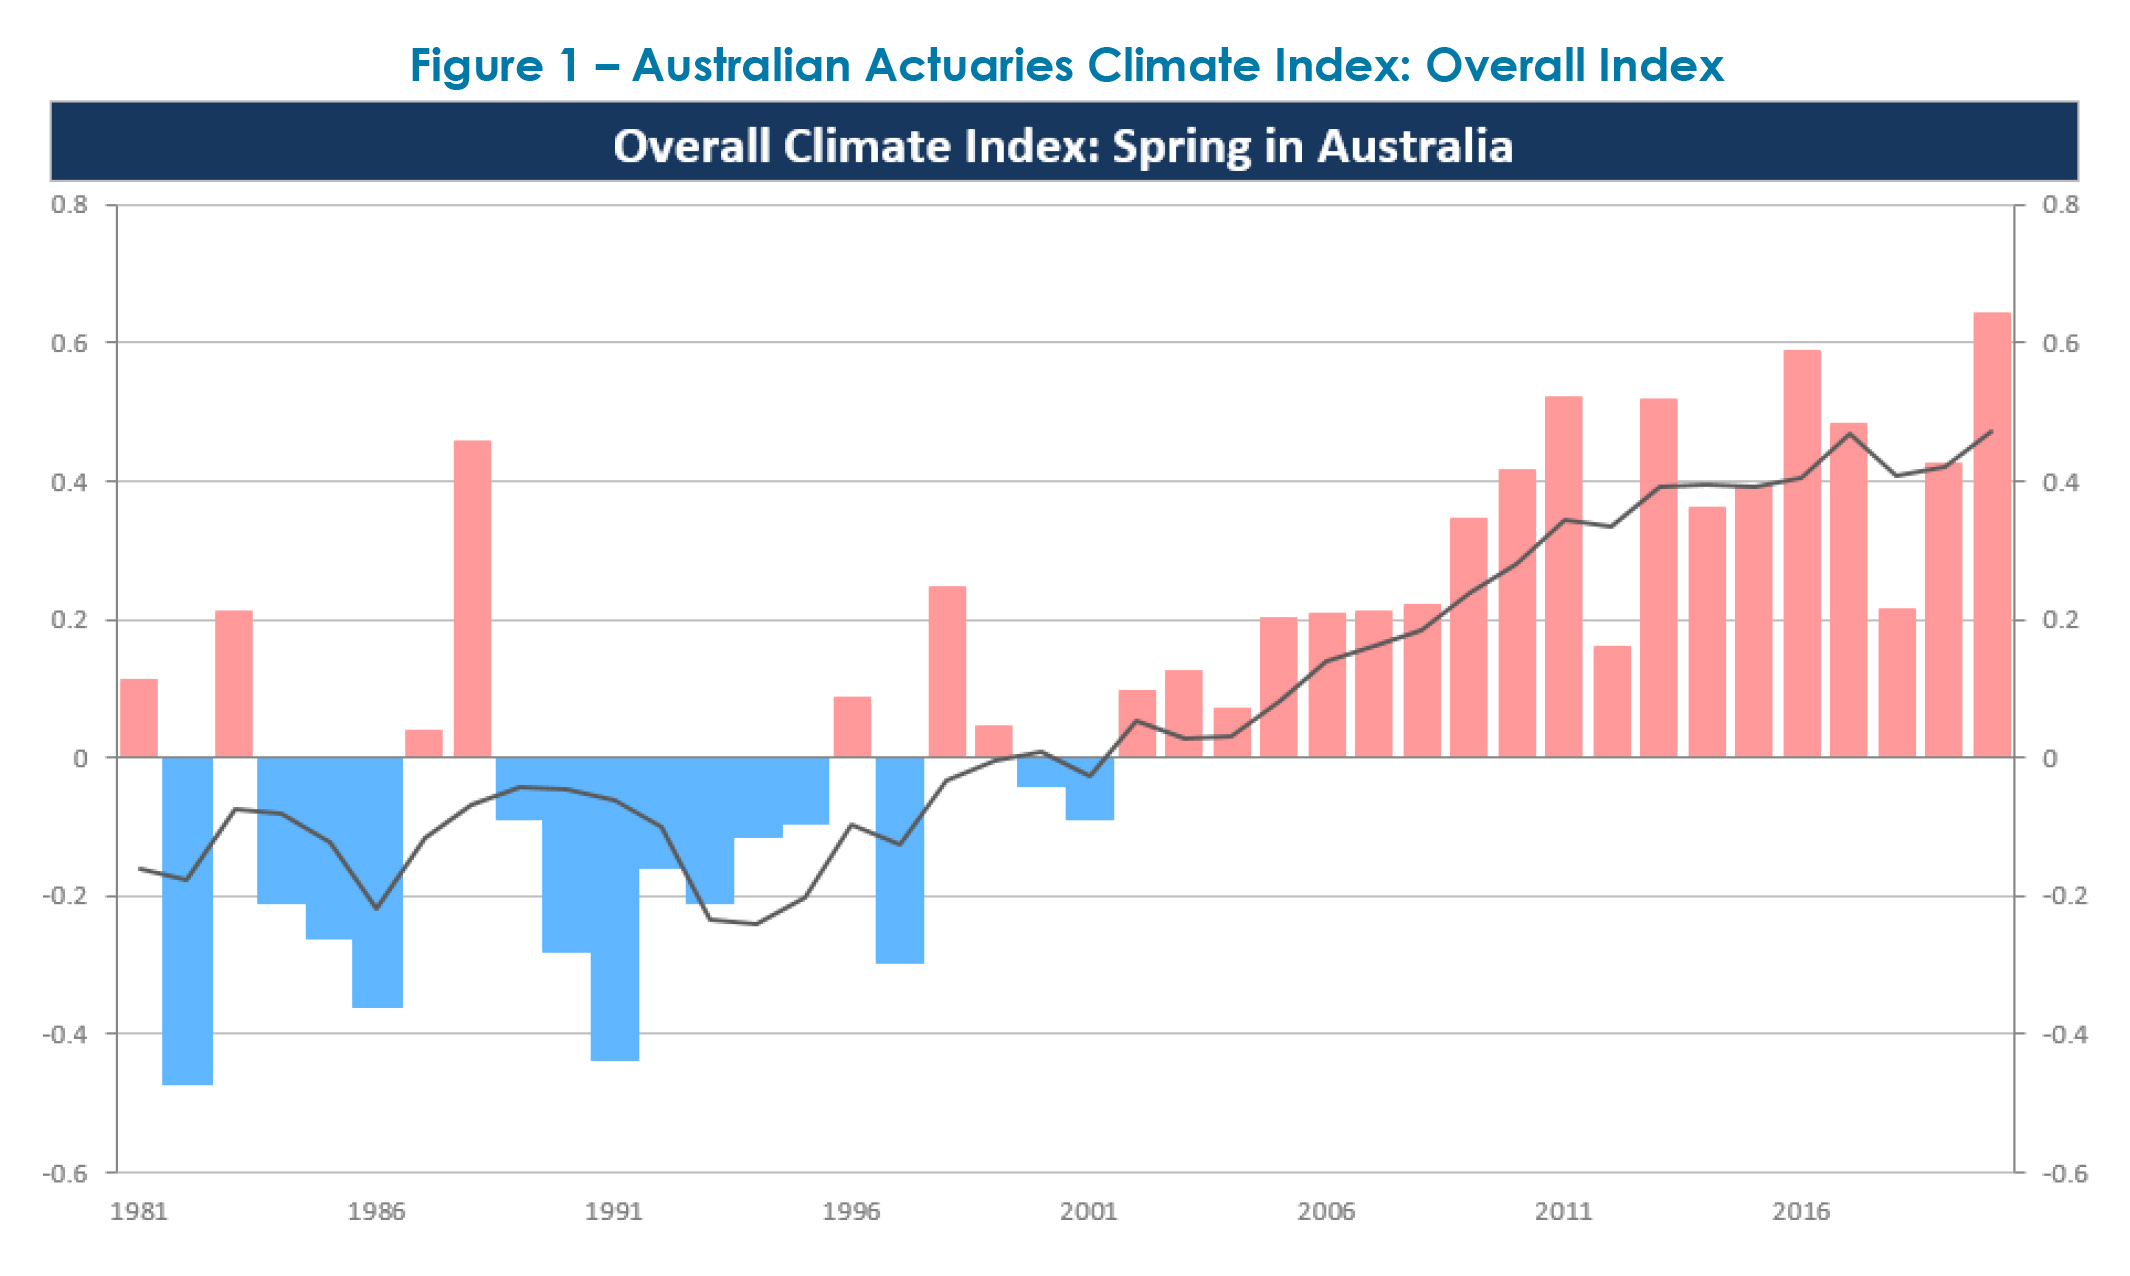
This Spring, all regions except the Wet Tropics recorded extreme high temperatures above the reference period average. Figure 1 shows the Index for Spring only, demonstrating a clearly increasing trend.

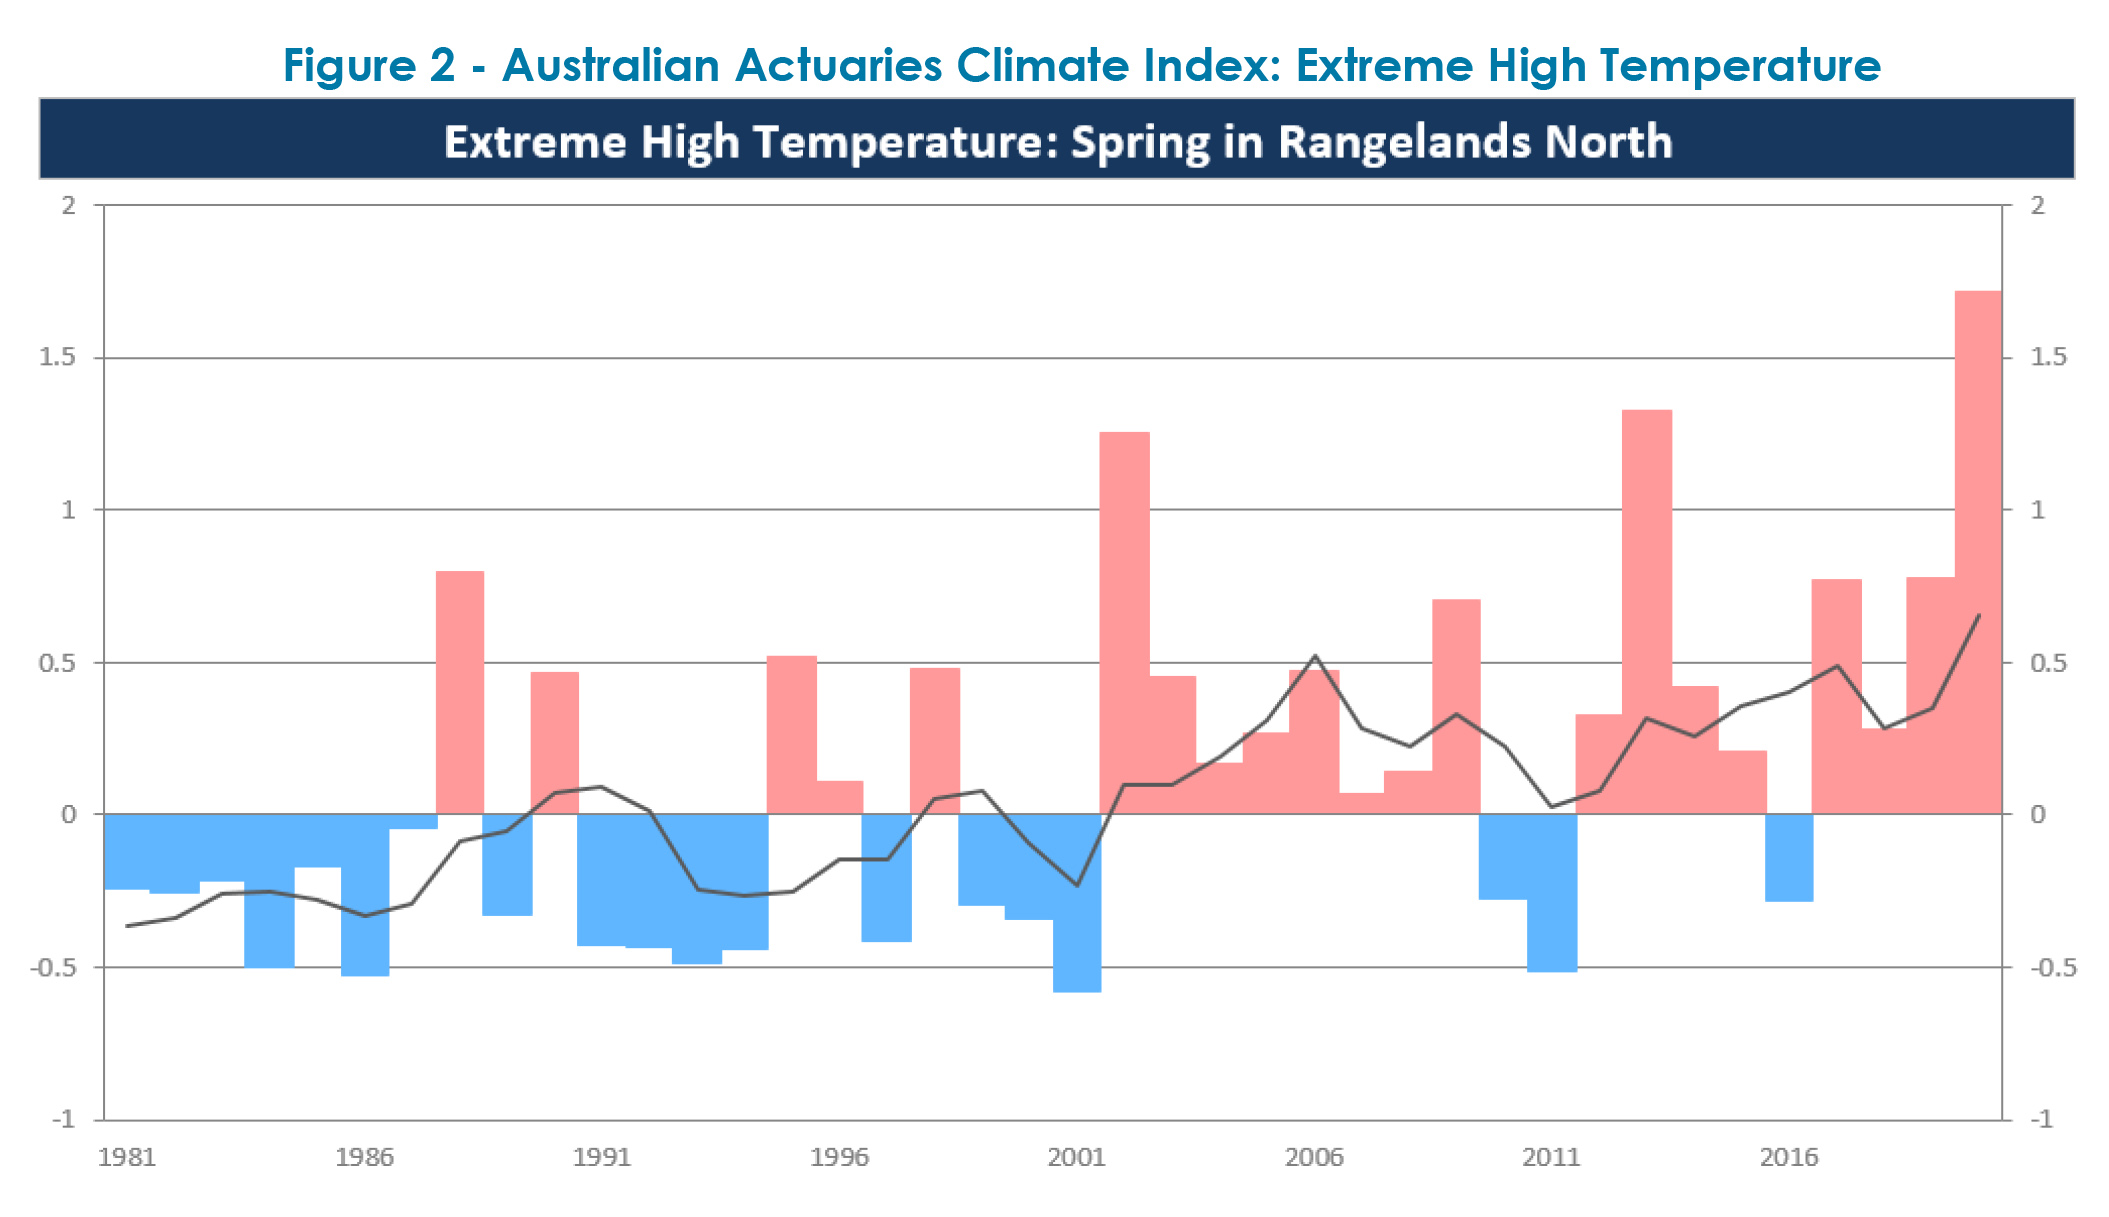
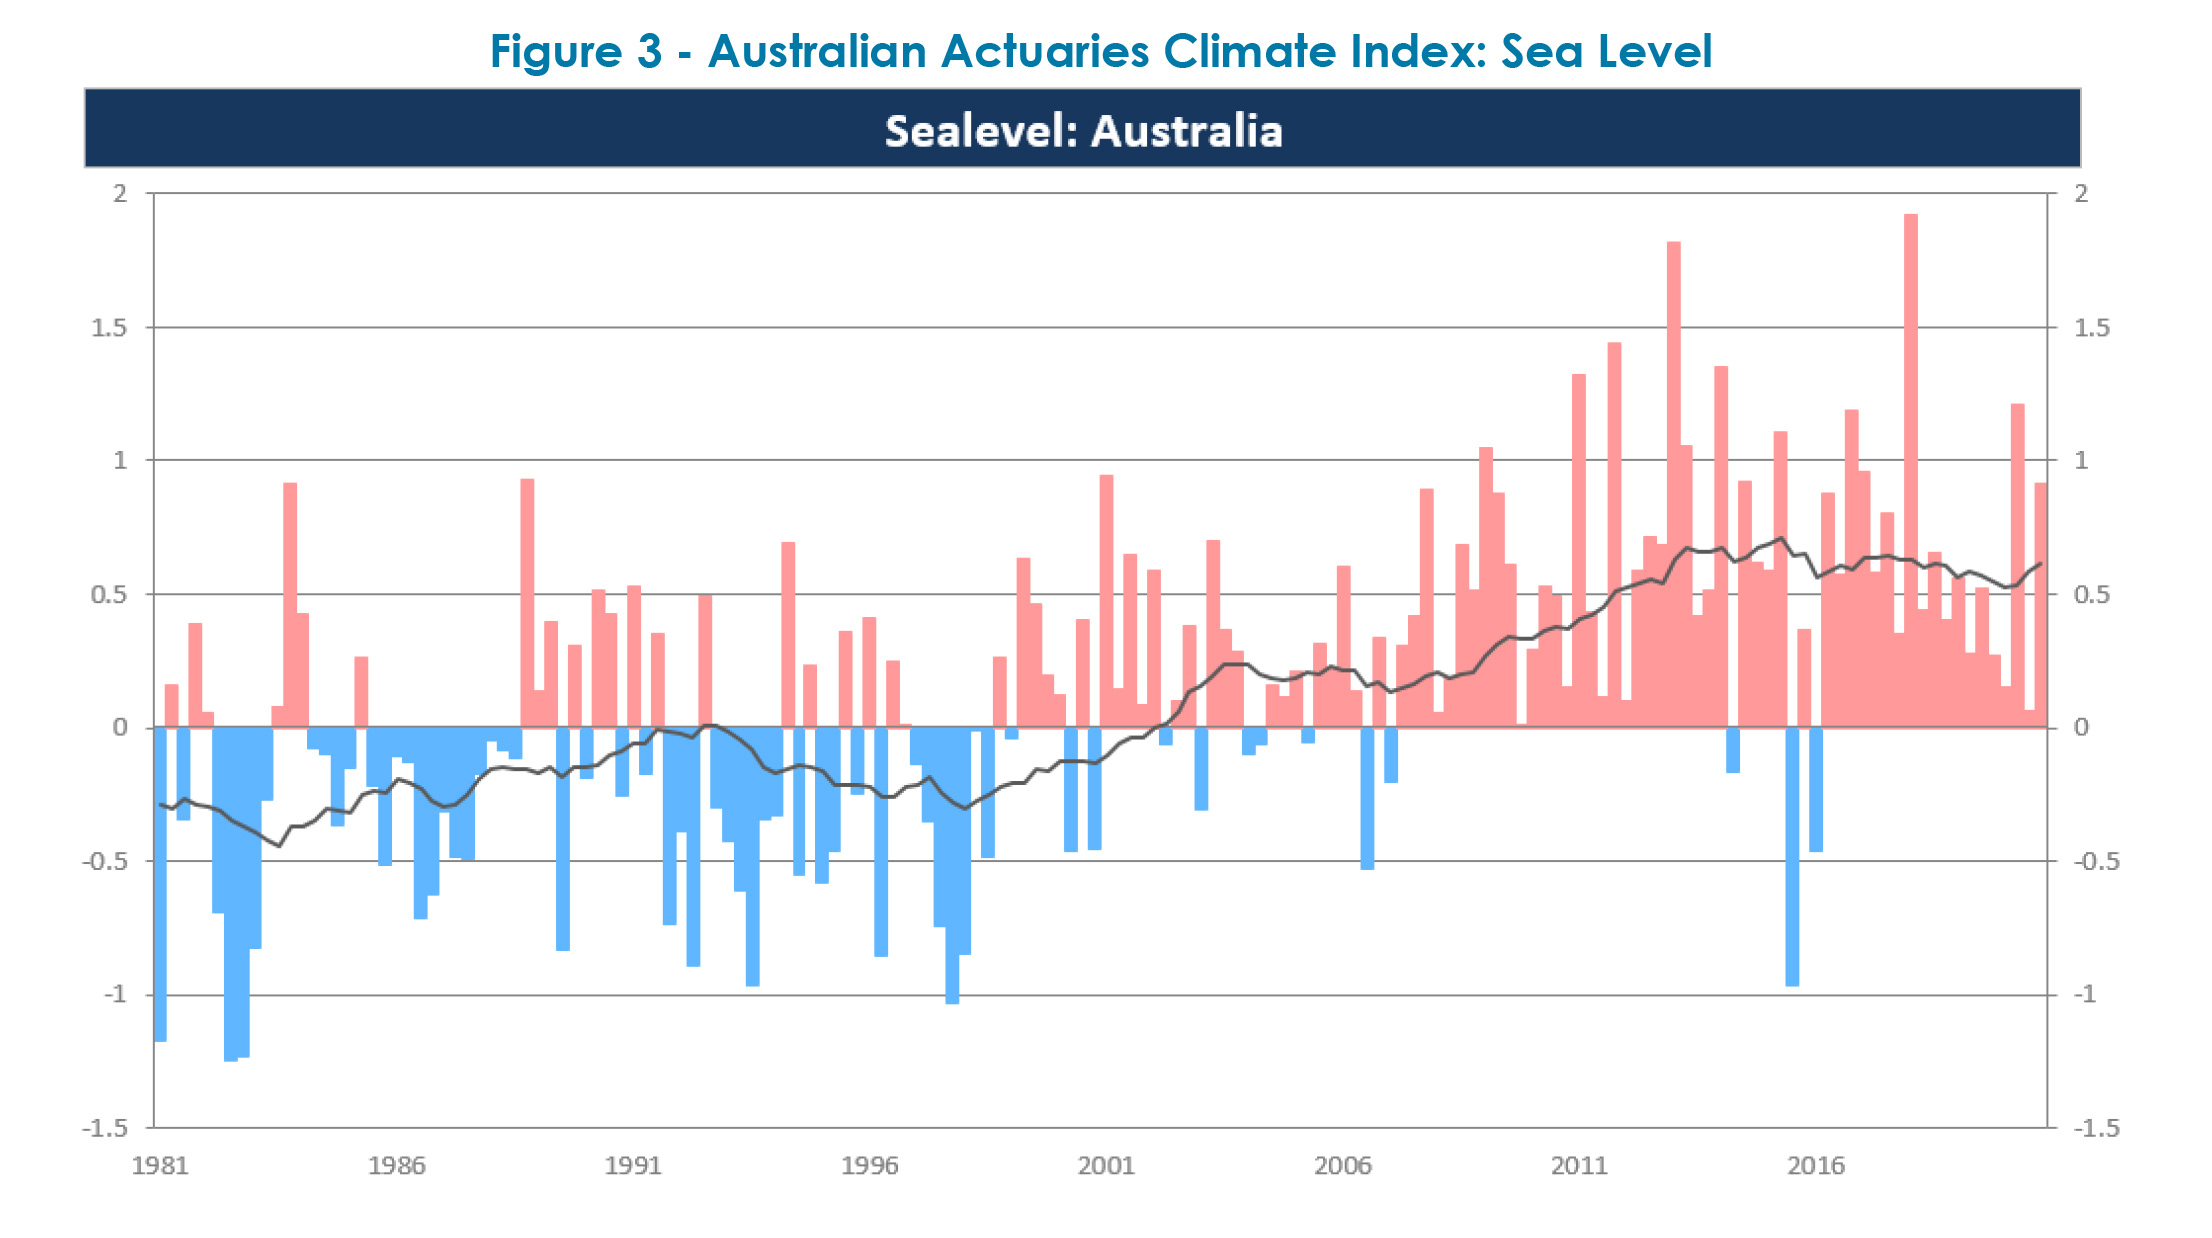
Many regions recorded index values within the top five highest on record. Notably, the Rangelands North, which stretches across WA, NT and into QLD, set a Spring record for extreme high temperature, as shown in Figure 2. Similarly, all regions in Australia recorded above reference period average sea level, as shown in the countrywide sea level index for all seasons in Figure 3.


The Southern Slopes (Tasmania) recorded the highest aggregate index value ever, while the Rangelands South recorded the second highest value. While most regions experienced extreme rainfall levels that were at or below reference period averages, these regions saw high levels of extreme rainfall. This benefited agricultural production in these areas, but also had a negative impact on harvesting activities[1].
The Bureau of Meteorology has also stated that the Spring of 2020 was Australia’s warmest Spring on record. It also confirms that while rainfall was below average for much of the country, certain parts of WA, SA and western parts of NSW and VIC experienced high levels of rain[2].
These conditions were influenced by the El Niño-Southern Oscillation weather system, which remained in the La Niña phase throughout the Spring. While this is typically associated with wetter conditions, the below average rainfall conditions seen in parts of Australia came about due to a temporary weakening of La Niña in November[3].
The Bureau of Meteorology believes La Niña peaked at the end of 2020, but that the Summer will continue to show above average rainfall, particularly in eastern parts of the country[4]. Australia can expect to see a less severe bushfire season than in the previous year, although the high levels of rainfall observed in certain regions in the Spring may result in increased fuel availability[5]. Note that even if overall conditions are less severe, regional bushfire outbreaks can occur, as is currently being seen in areas around Perth.
The Index is calculated by Finity Consulting for the Actuaries Institute at the end of each season, following the release of data from the Bureau of Meteorology. Footnote: References to temperatures, dryness etc. are based on the data underlying the AACI, which tracks changes in the frequency of extreme high and low temperatures, heavy precipitation, dry days, strong wind and changes in sea level, mainly concentrating on the 99th percentile of observations.
———-