

Stephen Colwell
Fee pressures have been felt across the Australian funds management landscape for over a decade. Whilst investors have benefitted from meaningful compression in traditional global long-only equities products, the global equities long/short peer group is often seen as an asset class that has withstood this trend.
The below graph highlights the median management fee of Zenith’s global equities long/short peer group and the average management fee of the long-only peer group over the most recent 10 years.
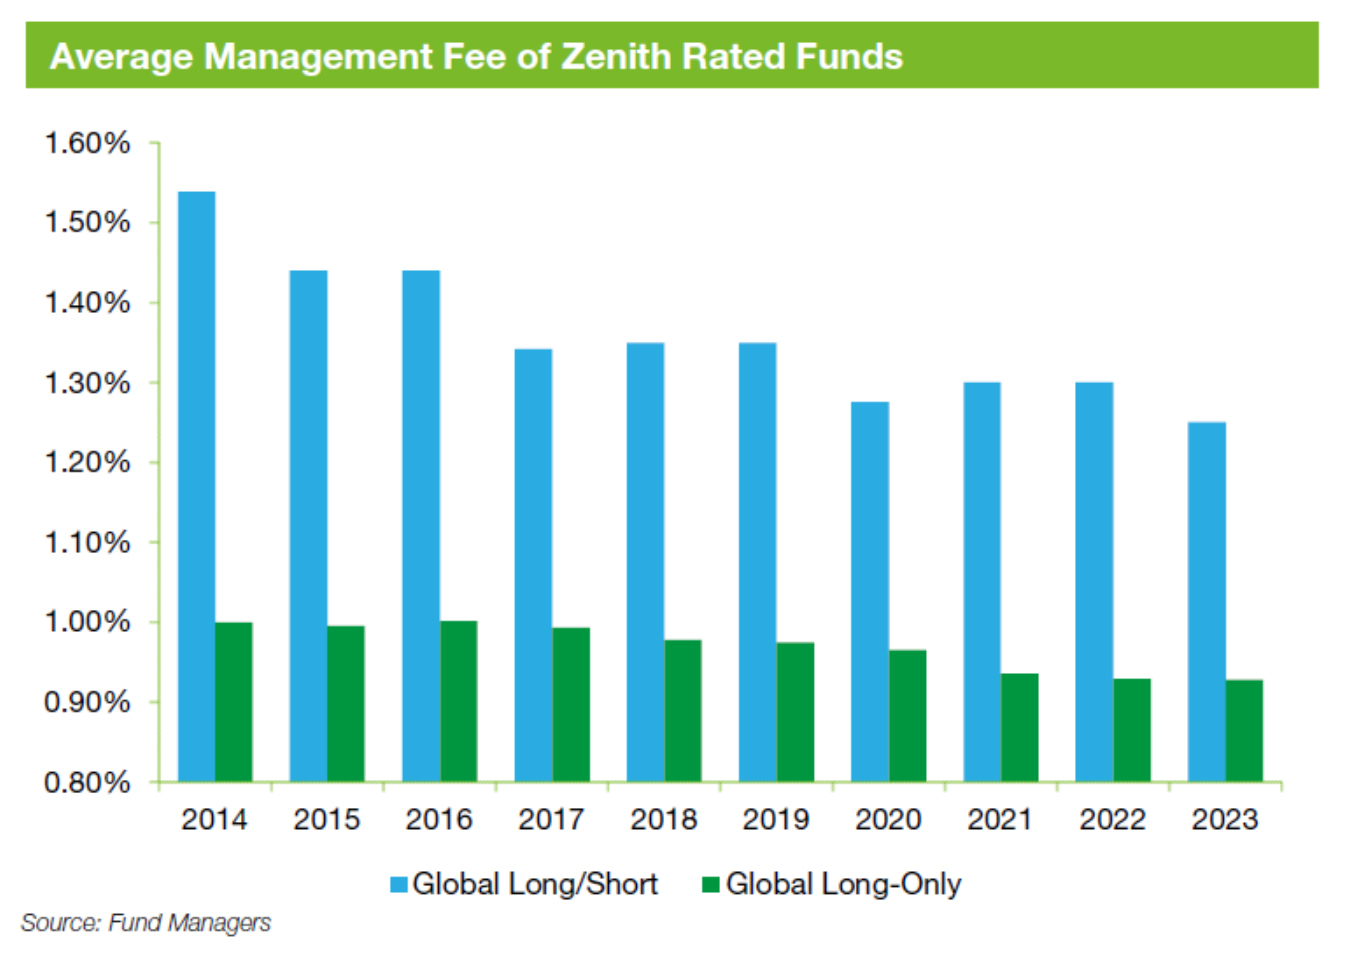

Having experienced many of the same industry dynamics as their long-only counterparts, the global equities long/short peer group has delivered a similar reduction in pricing. However, on the surface, it would appear the peer group remains significantly more expensive than their global equity long-only peers.
There is more to this than meets the eye. Let’s dig a little deeper.
Why do long/short funds charge a premium?
Long/short managers often operate with an absolute return focus, seeking to deliver a consistent level of return irrespective of the performance of the broader market. This can be achieved by dynamically adjusting the return and risk characteristics of the portfolio dependent on the current market environment.
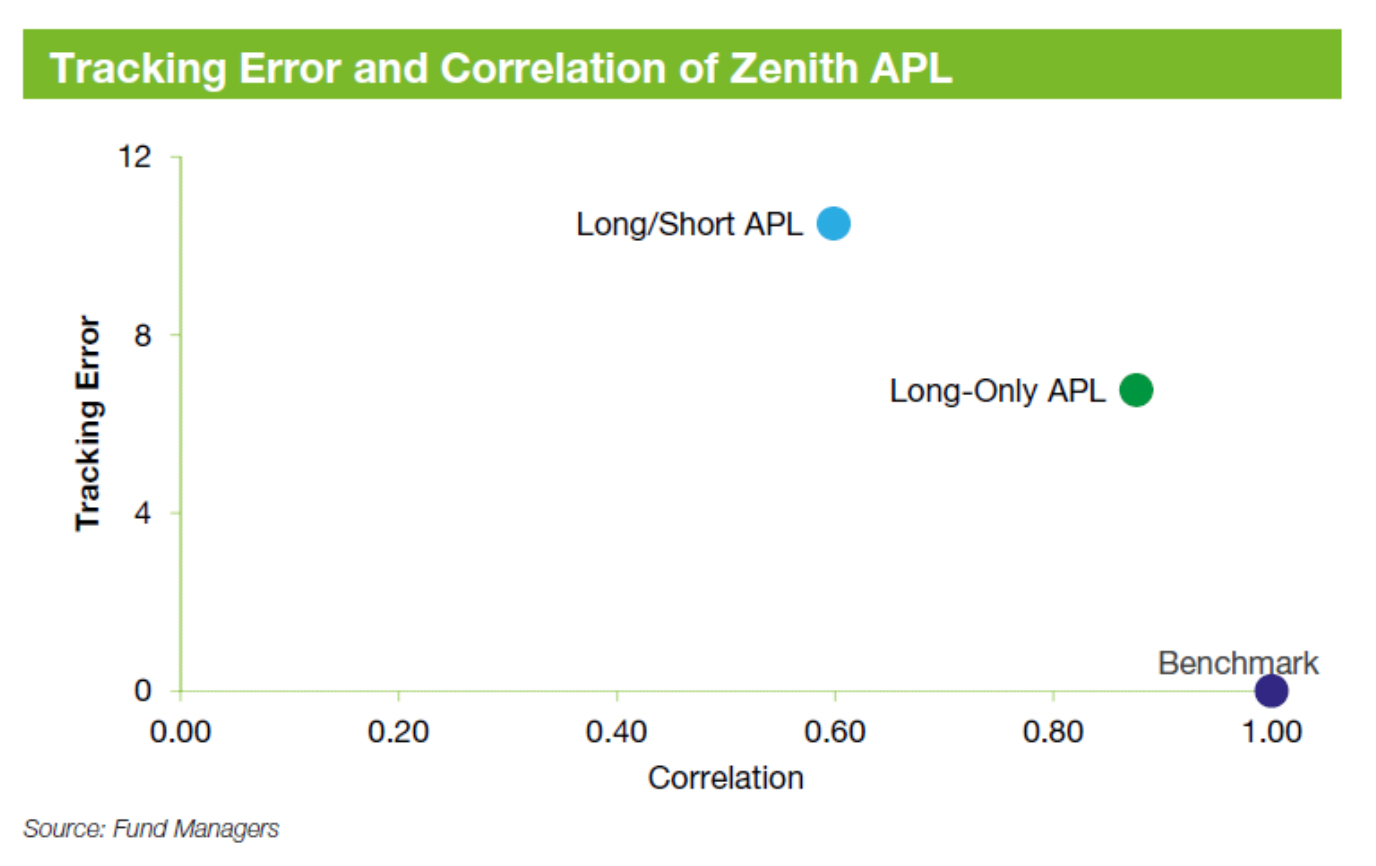
This contrasts with the long-only peer group, which typically generates a return profile more closely linked to the broader market. The graph below highlights the significant return and risk divergence of the peer group, relative to the broader market (as represented by the MSCI World Index $A).

To achieve these outcomes, managers have differentiated areas of focus. For example, the dynamic adjustment of exposures requires putting additional resources into understanding the broader macroeconomic environment.
Investment opportunities also need to be identified at either end of the spectrum, both long and short. The required cadence of investment opportunities is often higher in short portfolios too, with short positions generally having a shorter life cycle. This is illustrated in the chart below, which compares the expected portfolio turnover of the global equities long/short and long-only peer groups.
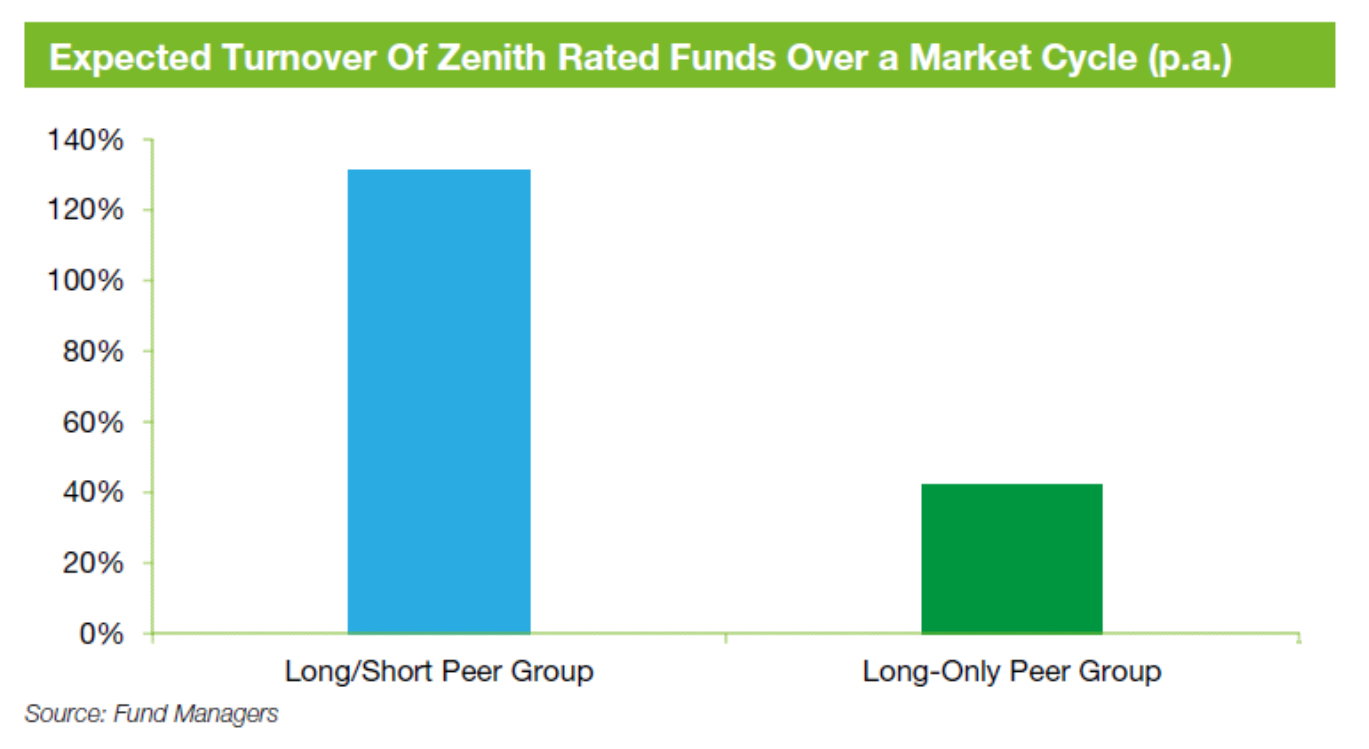

As seen above, there is an expectation that the global equities long/short peer group will be considerably more active in adjusting its positioning.
Capacity constraints should also be considered. Long/short strategies are usually constrained by their short portfolios, where managers must maintain nimble short positions that can be exited quickly with limited market impact. Where long-only peers could generally manage significantly more in assets, their long/short counterparts cannot. This is highlighted in the below graph which compares the average capacity of the two global equity peer groups, as at 30 September 2023.


Of the two peer groups, the average strategy capacity for the global equities long/short peer group was $US 6.6 billion, 66% less than their global equities long-only peers. This places a limit on the profitability of an investment manager and results in a scarcity premium.
Are long/short funds actually expensive?
Many geared products available in Australia charge management fees on a gross asset value basis. Under this structure, the amount an investor pays in management fees increases as the amount of leverage applied increases. This differs from the fee structure applied to long/short managers, who apply a flat fee that’s unchanged by the amount of leverage applied.
In the example below, we have simulated the difference in management fees paid under net asset value and gross asset value structures, at different gross exposures.
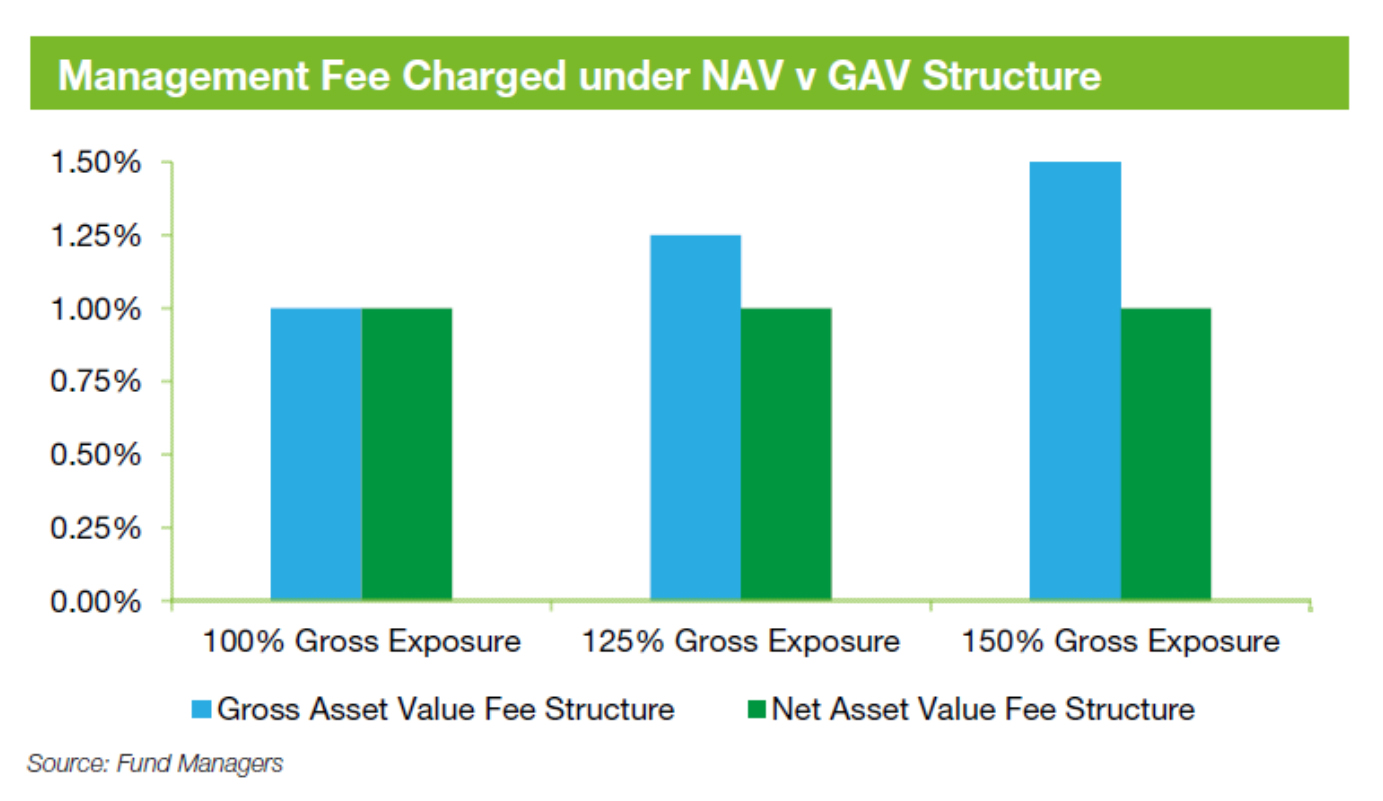

Given the global equities long/short peer group typically run an element of leverage in their products, it would appear investors might be getting a better deal than the headline management fee suggests.
The chart below highlights the average gross exposure of the global equities long/short peer group over the most recent 10 years.
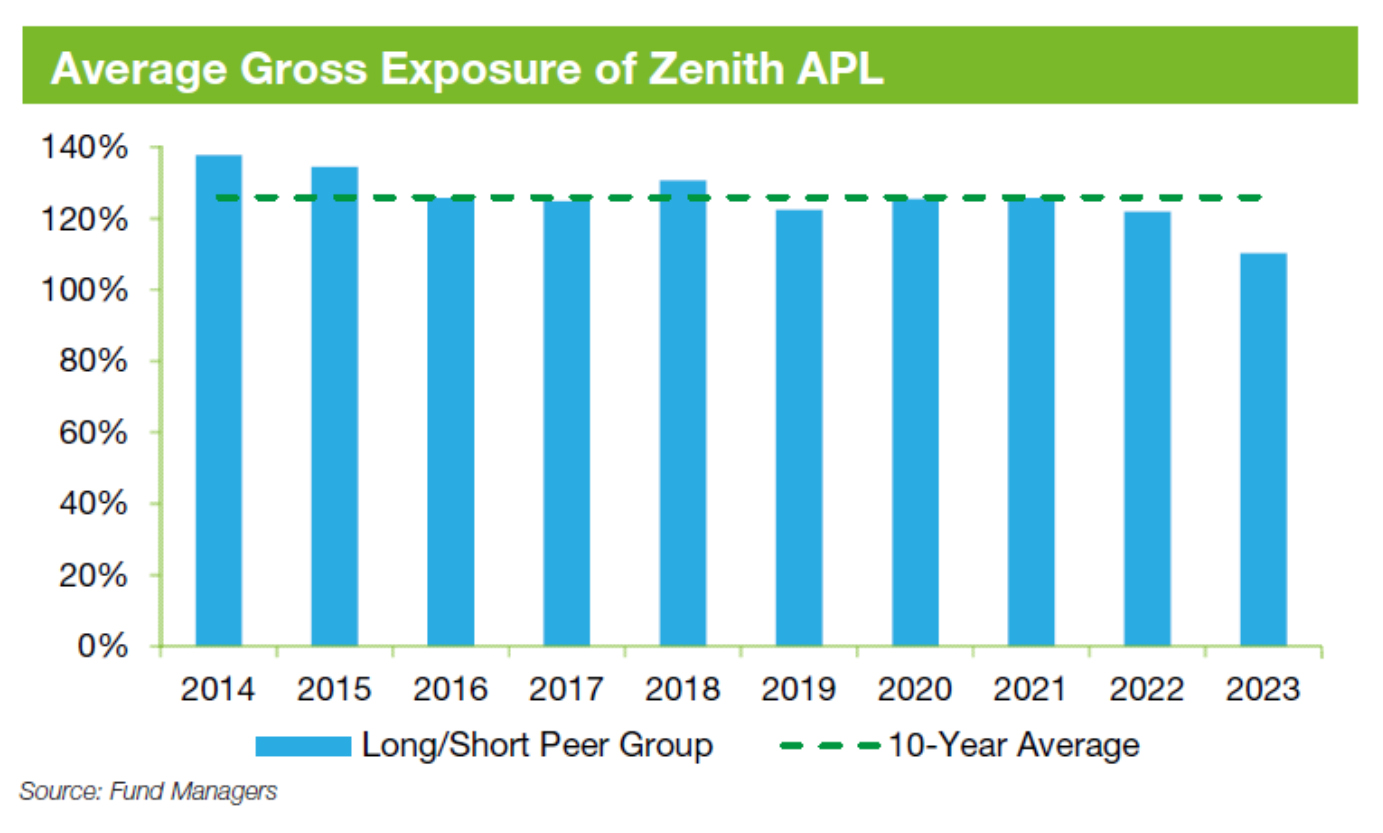

Despite the gross exposures of the peer group fluctuating materially on a product-by-product level, the peer group’s average exposure has remained relatively persistent. Over the period, the global equities long/short peer group has exhibited an average gross exposure of 126%.
Let’s level the playing field
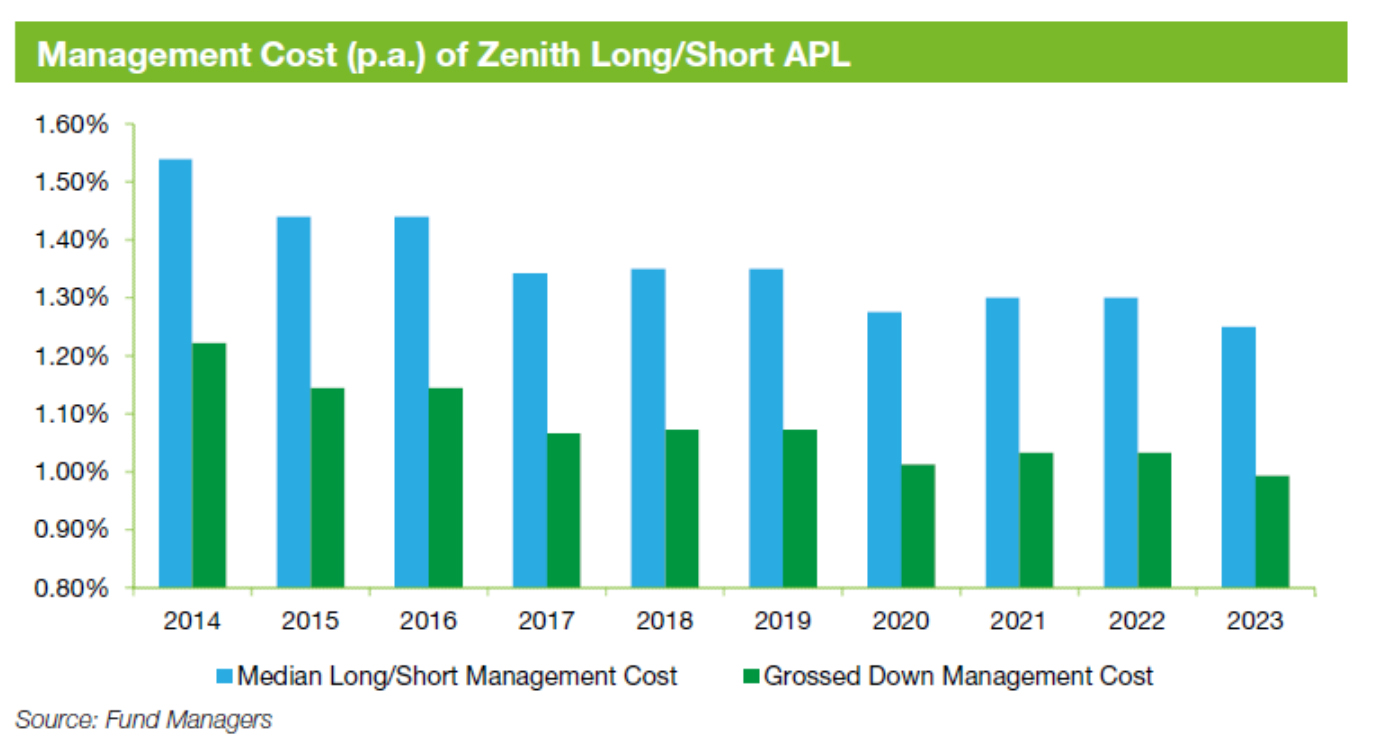
Given the different levels of gross exposure maintained by the long/short and long-only peer groups, we need to neutralise this element for a more robust comparison of management fees. To assess this, we have equalised the global equities long/short peer group’s level of gross exposure to that of its long-only counterparts, reducing the management fees on a pro-rata basis[1].
The below chart plots the adjusted median management fee of the global equities long/short peer group, assuming a reduction in gross exposure to 100%.

With two comparable datasets, we can isolate a more representative premium between the two peer groups. This is captured in the chart below.
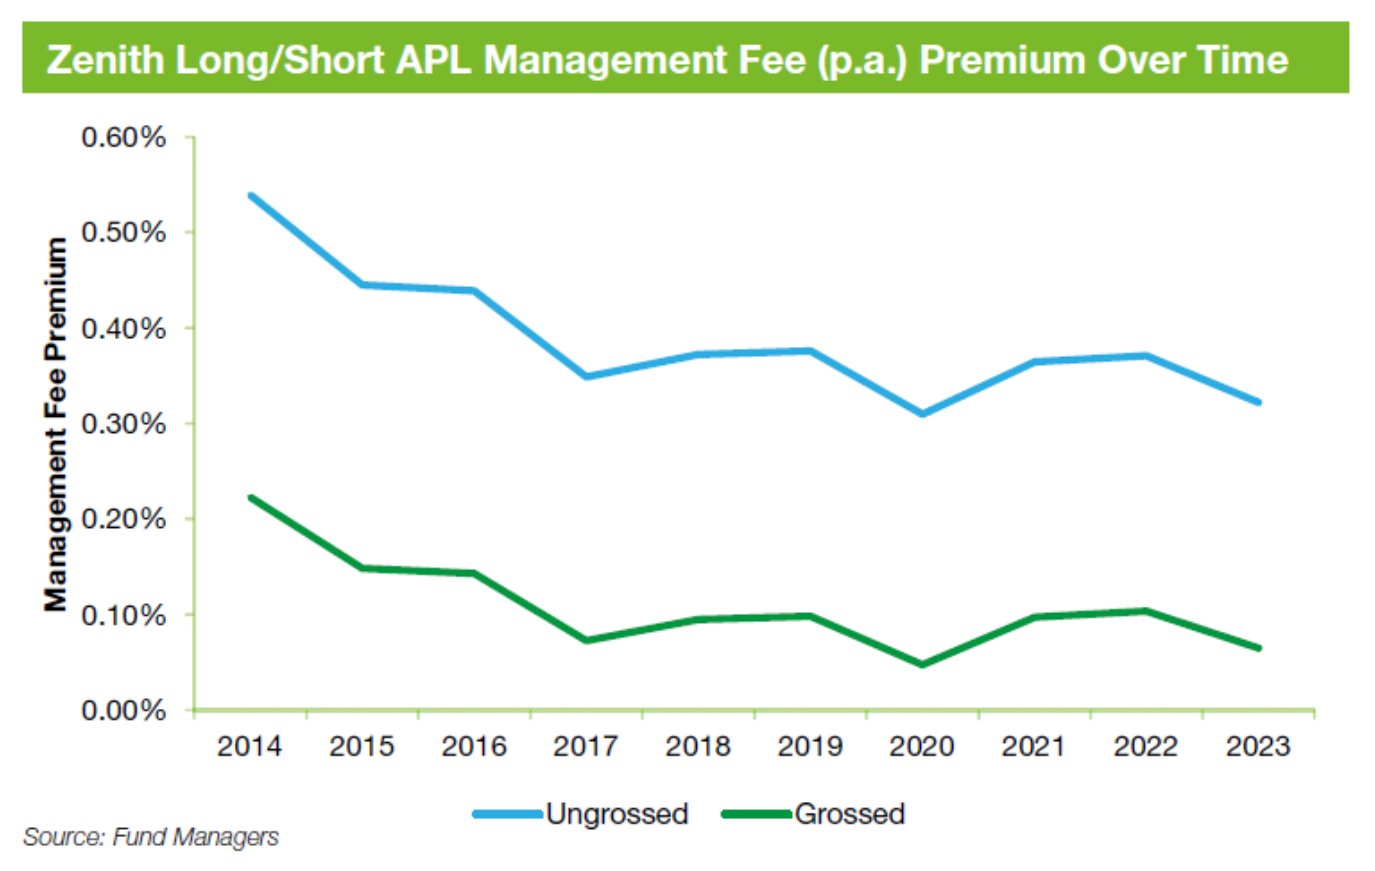

Under this framework, the premium charged by the global equities long/short peer group falls substantially. When comparing the peer groups 2023 management fees, the premium contracts from 0.32% p.a. to 0.06% p.a. Additionally, we note that the premium has been in a state of consistent decline, from 0.22% p.a. in 2014 to 0.06% p.a. in 2023.
What about performance fees?
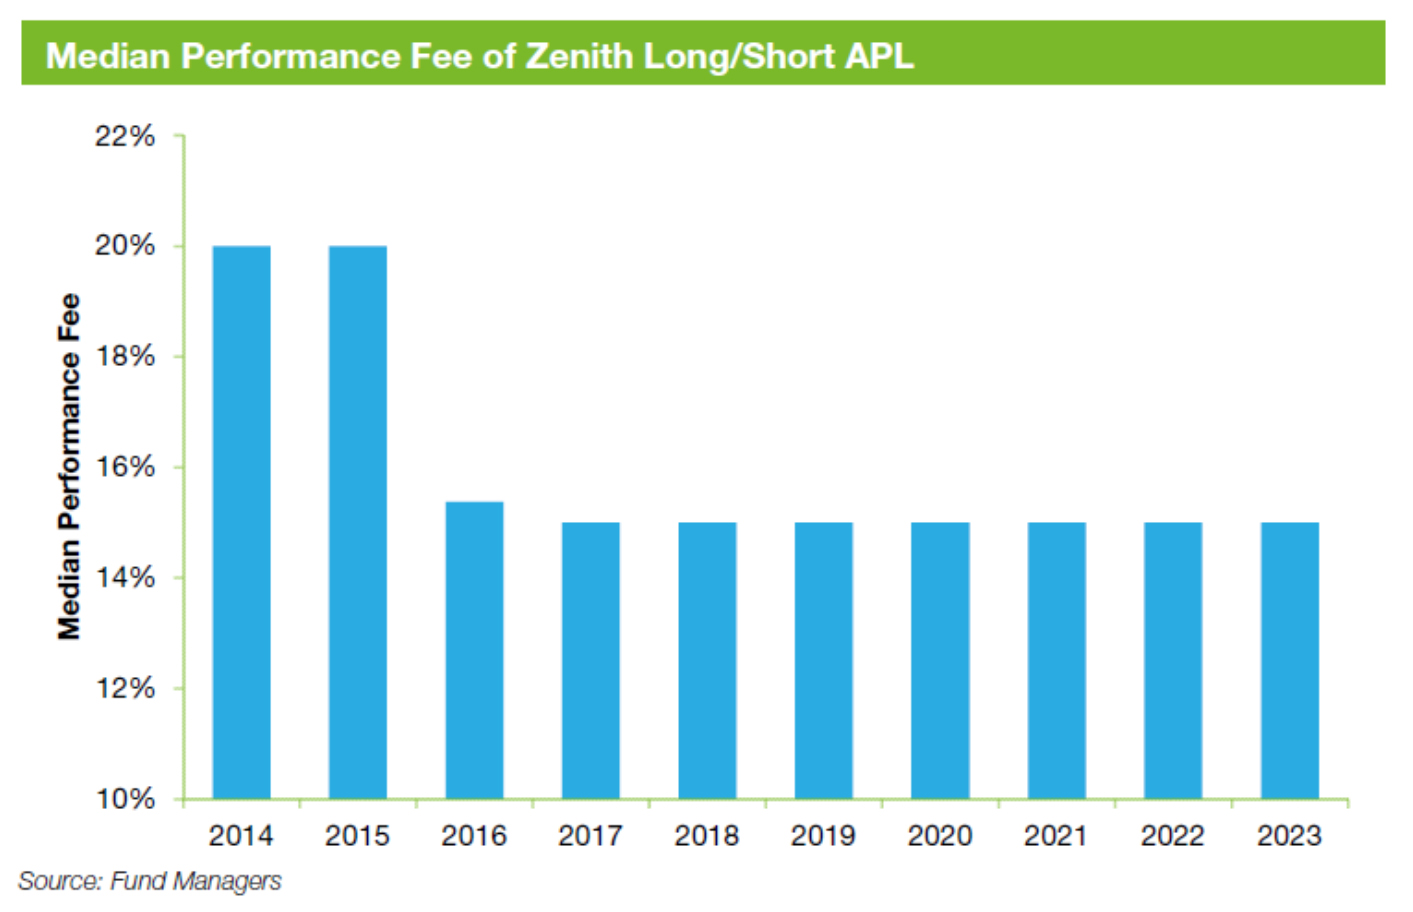
With our assessment focused solely on management fees, has there been a similar reduction in performance fees?
Thankfully, the days of 20% performance fees are gone, mostly, with the median performance fee of products that implement the structure having reduced to 15%.

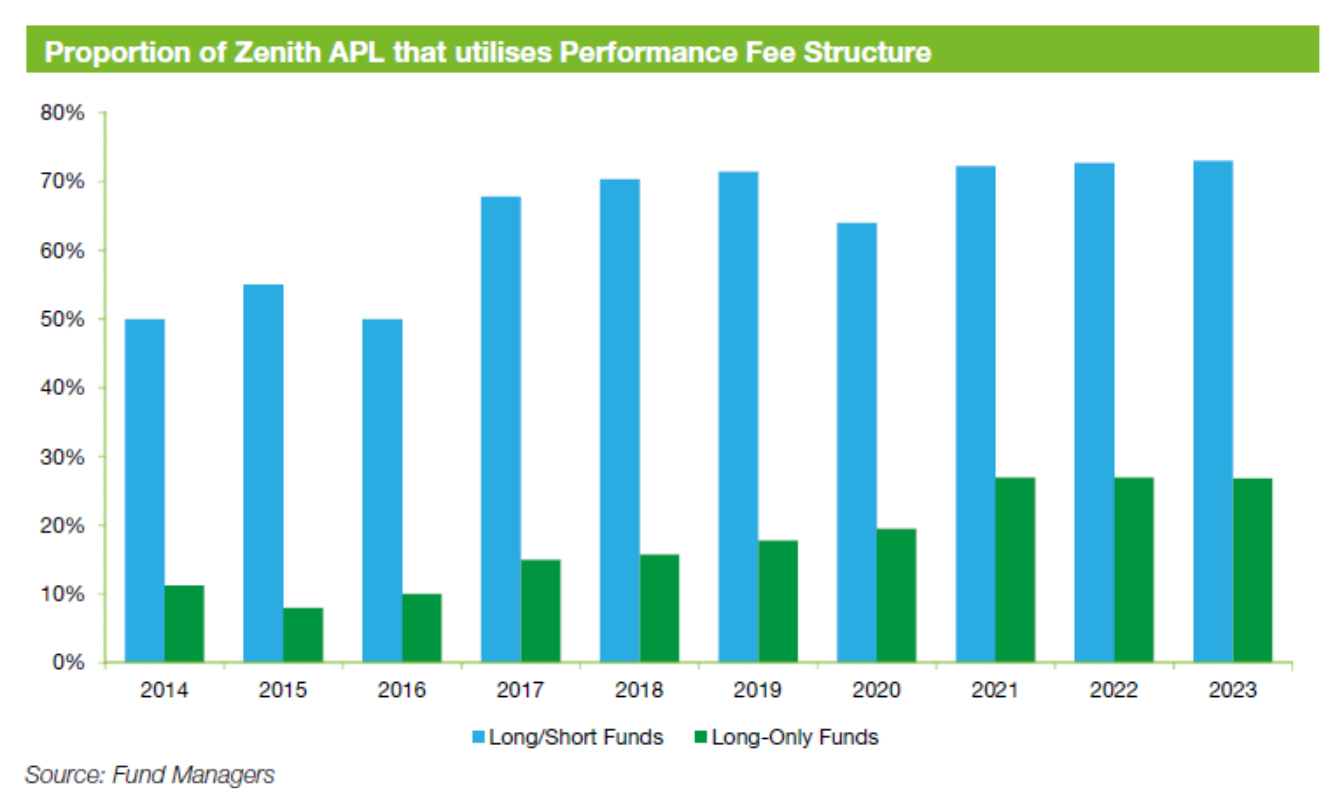

Interestingly, whilst the performance fee charged has reduced over the past decade, the utilisation of performance fees across our APL has increased.
The chart below illustrates the increased use of performance fee structures over the past 10 years in the global equities long/short and long-only peer groups.
Whilst the prevalence of performance fees in each peer group remains materially different, we have observed a comparable increase in the utilisation of the structure, with the global equities long/short and long-only peer groups seeing increased utilisation of 23% and 16%, respectively.
Given the capacity constrained nature of the long/short peer group, we believe the utilisation of performance fees is appropriate. Tighter capacity constraints in the global long/short peer group ensure managers are focused primarily on investment returns, with outperformance made much harder if products are impeded by capacity limitations.
You get what you pay for!
Given the analysis above, we believe that the premium charged for global equities long/short funds is marginal, at best, but how have global equities long/short products performed on investment merit?
The below graph highlights the impressive defensive characteristics of the global equity long/short peer group, with an assessment of the peer group’s upside and downside capture ratios over the most recent 10 years.
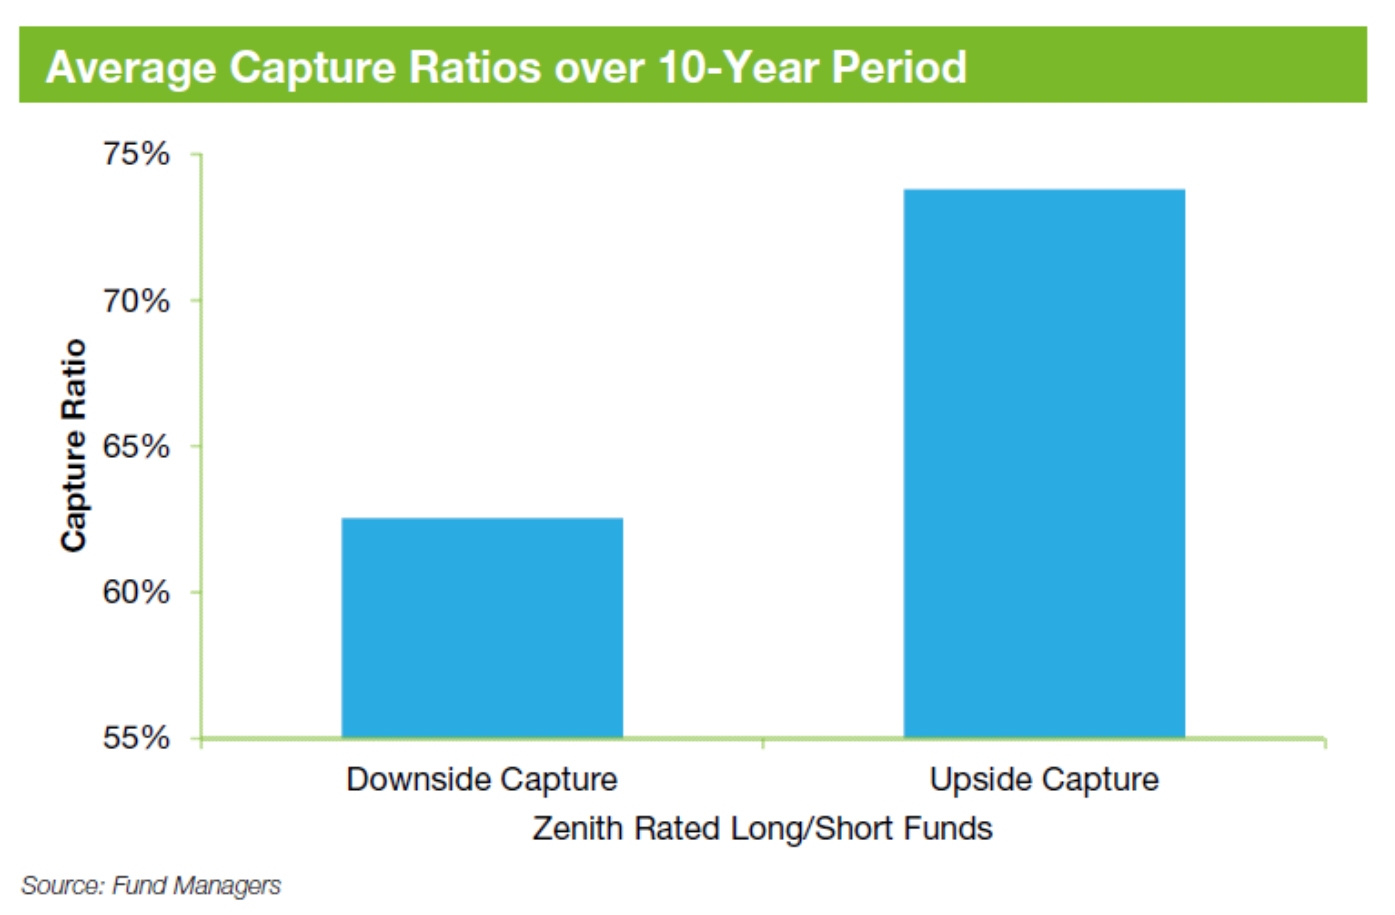

Over the assessed period, the peer group captured an average of just 63% of the market’s declines. On the other hand, managers were able to participate in over 74% of market upside. Whilst hindsight is 20:20, we believe investors have been appropriately compensated over the assessed period with strong risk-adjusted returns.
The long and short of it…
While global equity long/short funds may appear relatively expensive at first blush, there is much more than meets the eye. As legendary investor Warren Buffett succinctly surmises: “Price is what you pay, value is what you get.”
By Stephen Colwell, Senior Investment Analyst
——–
Notes: [1]
![]()
