

Chris Bedingfield
Chris Bedingfield from Quay Global Investors, shares 12 charts which look at some of the interesting trends in global real estate and what’s to come in 2024 and beyond.
Chart 1

What it means
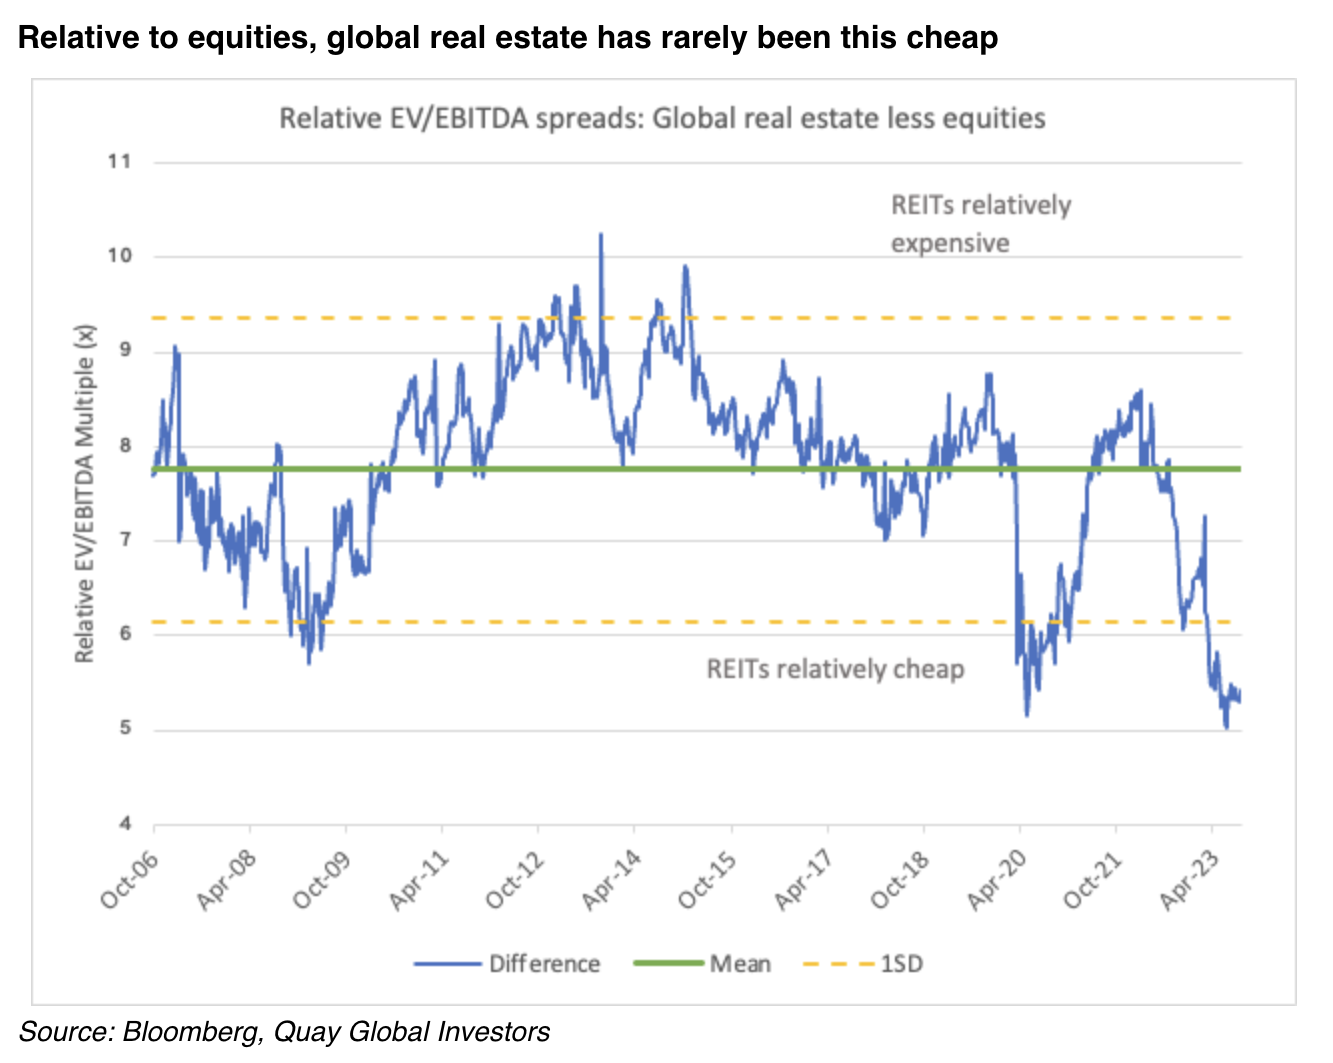
The chart depicts the simple difference between the expected EBITDA (earnings before interest, tax, depreciation and amortisation) between global equities and global real estate. The lower the number, the less expensive real estate screens relative to equities.
The chart explains the recent underperformance of the real estate asset class is less about operating fundamentals and more a story about macroeconomic factors, asset allocation and sentiment.
When is the right time to re-allocate?
As most Australian observers of the domestic residential market have discovered, a turnaround in sentiment and pricing does not always need a change in interest rate outlook. Right now, the sector is as (relatively) cheap as it has ever been over the past 18 years.
Chart 2

What it means
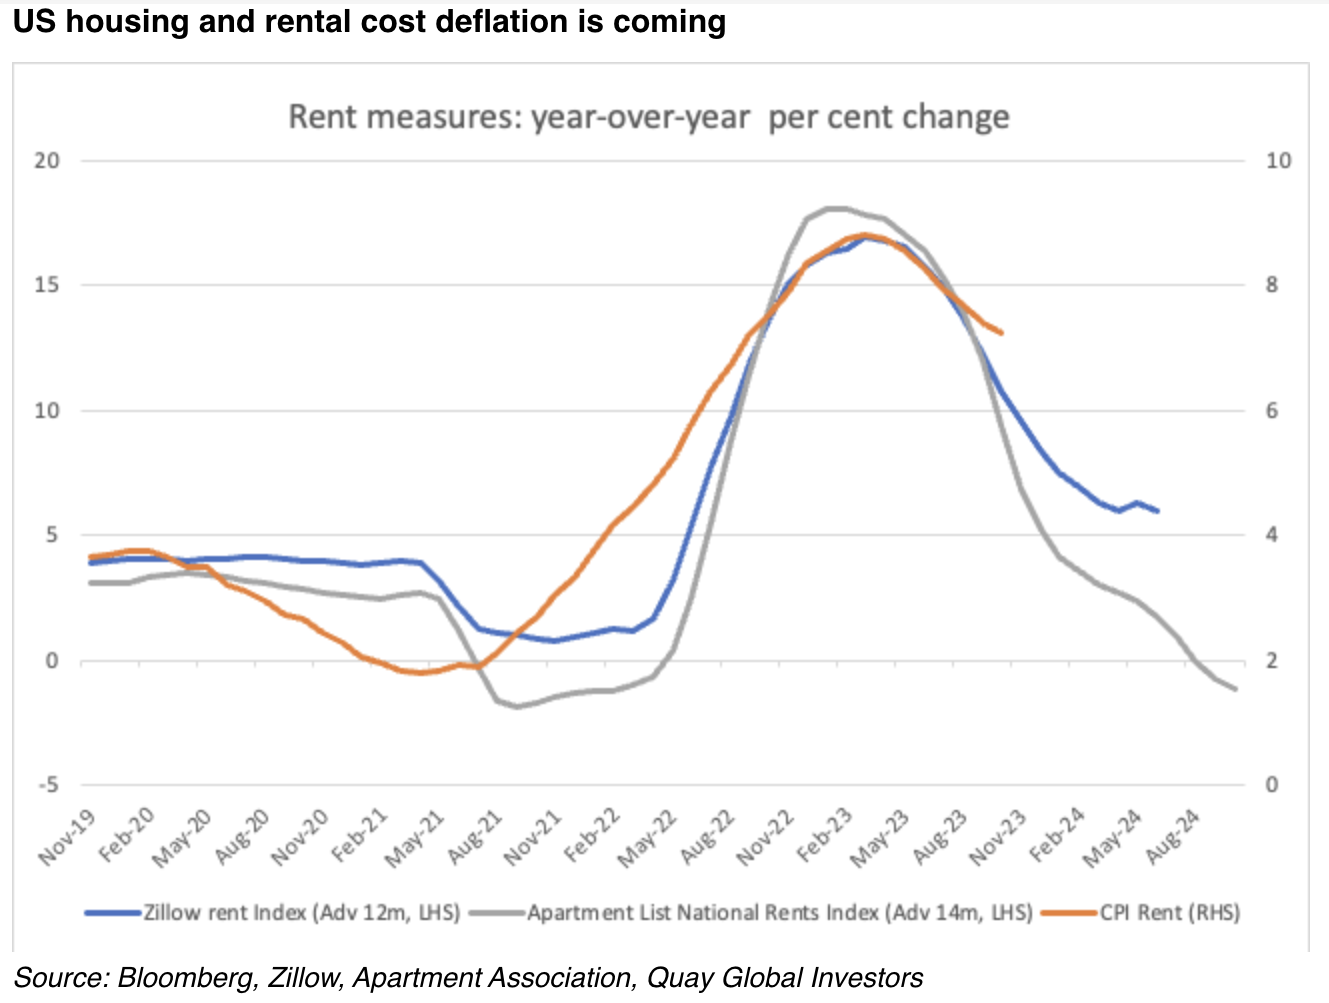
US inflation continues to climb down from the elevated levels of mid-2022. Some of this deceleration is helped by falling rental costs.
As we highlighted in our recent Investment Perspectives article, A big disinflation tailwind is coming, there is a lag between actual rental inflation and the data that feeds into the monthly CPI.
The chart above has been updated for recent data with the known private data set forward to adjust for the known ~12 month lag, and highlights the deceleration that is coming over the next few months. As predicted in our previous article, the BLS inflation data continues to track the forward private sector data. Eventually, the decline in housing costs will cut roughly two percentage points from the headline CPI (currently 3.2 per cent) data into 2024. It’s no wonder there is a growing consensus that the “Fed is done”[1].
Chart 3

What it means
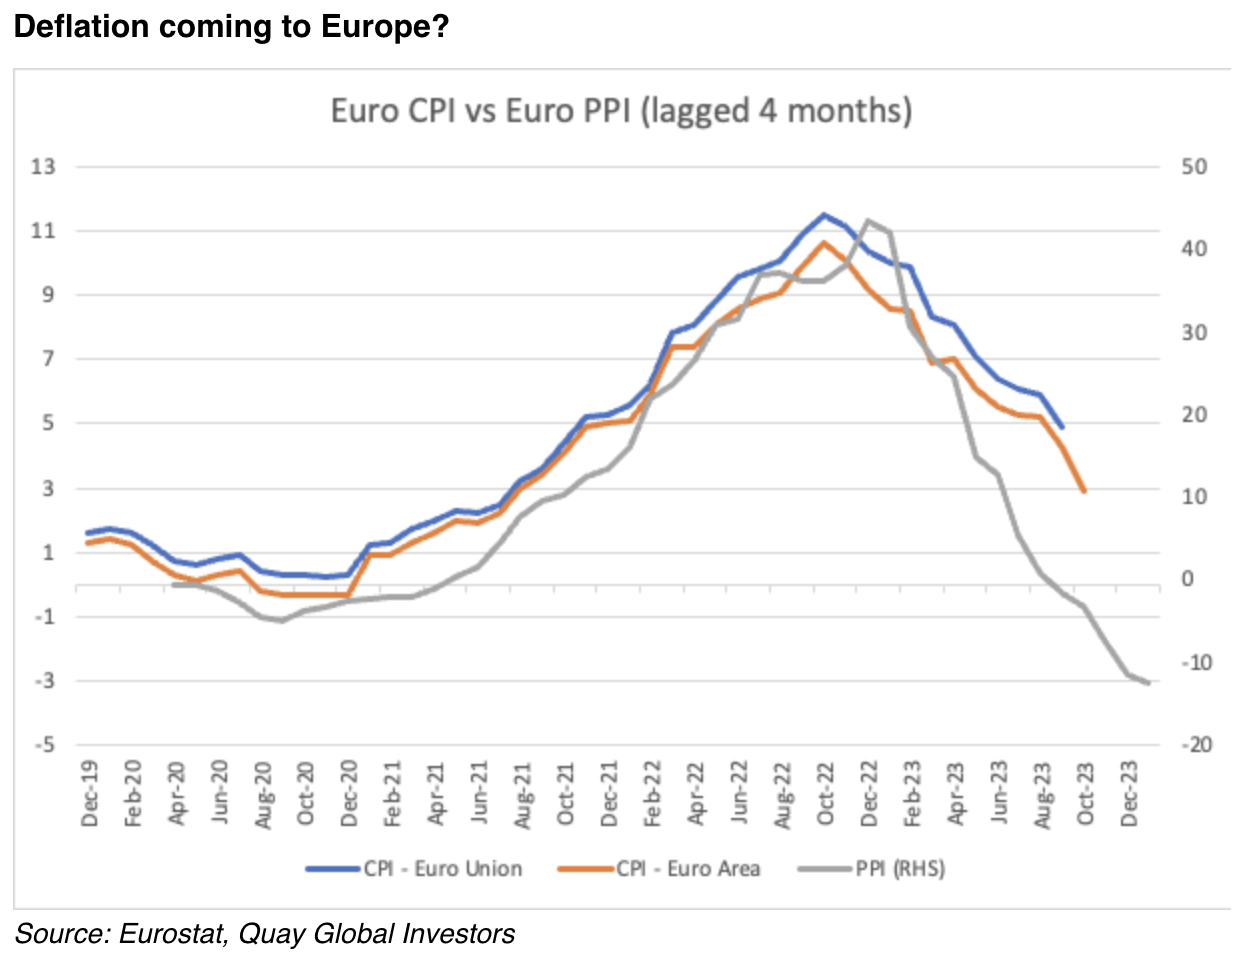
Not unlike the rest of the world, Europe suffered a significant increase in inflation post pandemic. Also, like the rest of the word, it was clear the inflation was largely driven by supply chain issues and was transitory.
One area Europe differs from most other western markets, is the fiscal response during the pandemic (10 per cent of GDP) was not as large as the US (~25 per cent), Australia (~17 per cent), or Japan (~15 per cent)[2]. As economies and supply chains normalize, there is a clear lack of aggregate demand such that the producer price index (PPI), a leading index for the CPI (see chart above), is now running at a deflationary low of -12.4 per cent. That’s not a misprint. It’s minus 12.4 per cent.
Along with weak economic growth and job losses, it seems reasonable to expect interest rate cuts into 2024.
Chart 4

What it means
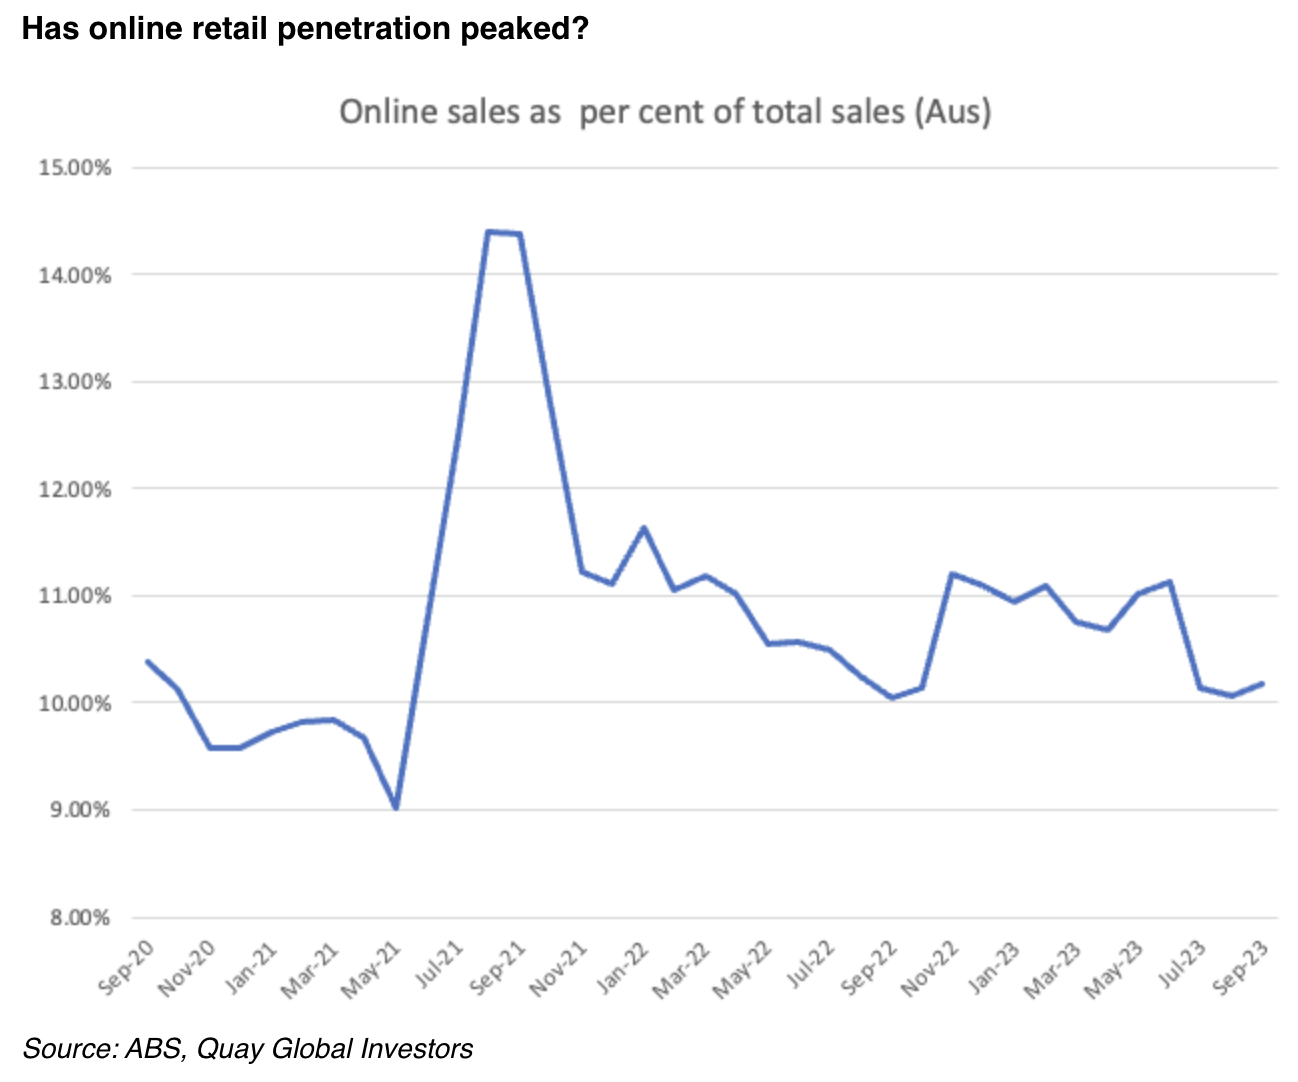
With the pandemic well in the rear-view mirror, it seems the gain in share from online retail has stalled. Using ABS data for online retail sales, the share of total sales now sits at around 10 per cent – a figure in line after the end of the first lockdown in 2020.
Worryingly for the e-commerce thesis, more recent data shows a significant drop in online sales, as bricks and mortar now appear to be gaining share. For example, in the three months to September 2023, Scentre Group (Australia’s largest Mall owner/manager) recorded retail sales growth of +3 per cent[3], compared to national sales’ growth of 2.1 per cent.
No wonder industrial landlords now want to talk about data centres.[4]
Chart 5


What it means
At a time where online retail penetration is potentially peaking, record amounts of new supply of industrial property is under construction. In fact, in the US, third quarter deliveries of new industrial property exceeded 170m square feet, just shy of the full year deliveries in 2019. To date, more than 450m square feet have been delivered in 2023, up 23.5 per cent on the record set in 2022[5].
For the past 10 years, industrial property was the “go-to” sector for specialists and generalists alike. To us, valuations and the overall theme look increasingly vulnerable.
Chart 6
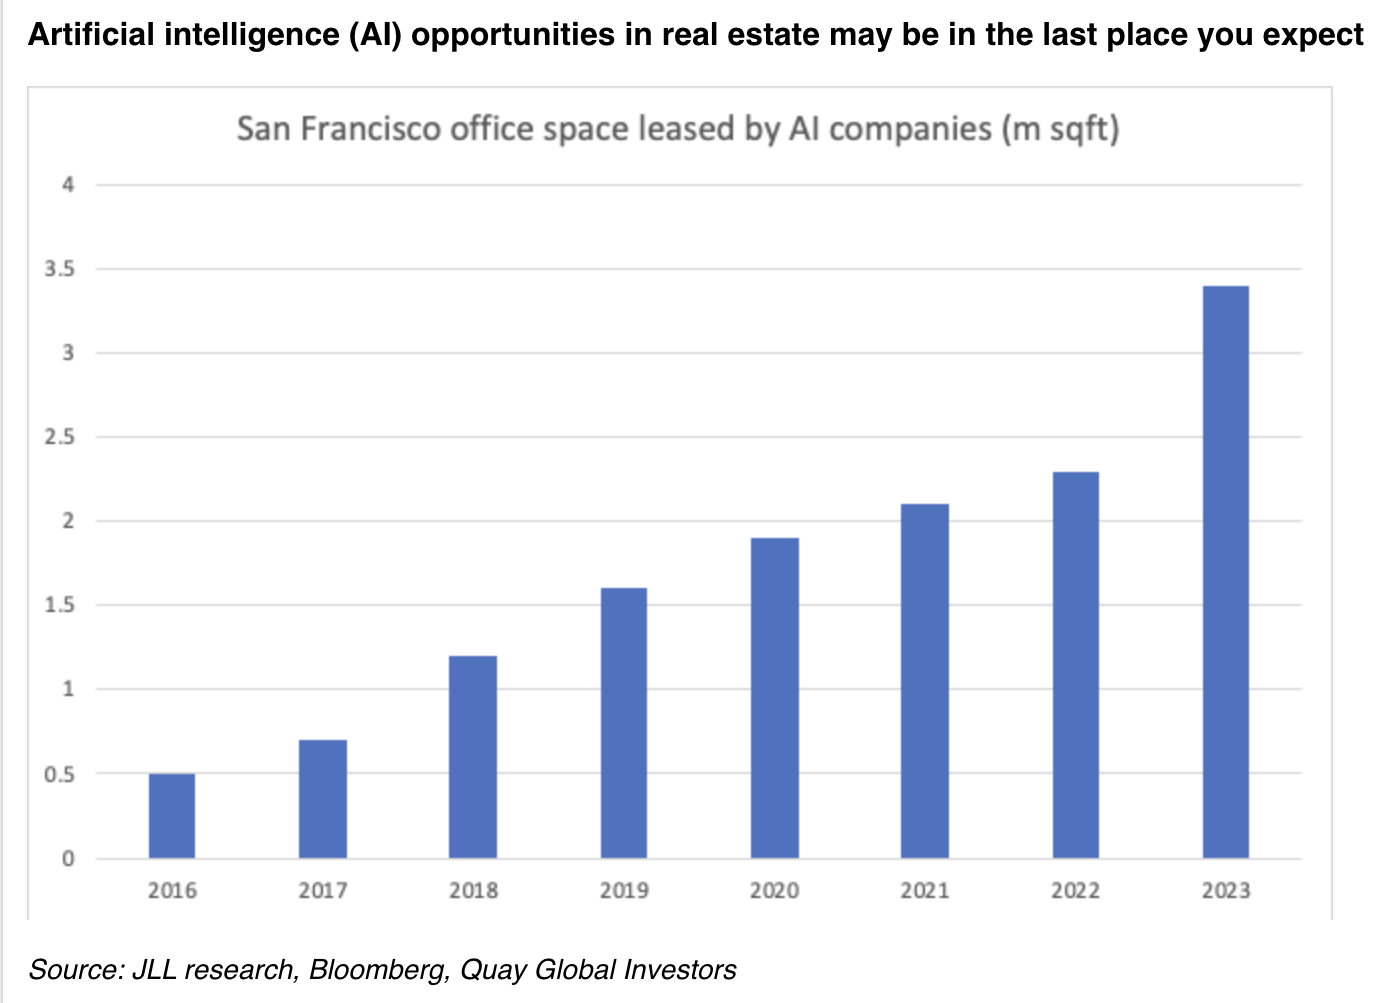

What it means
Great investment themes always feel compelling, but ultimately, investors make returns from valuation. If you can get both right, then significant opportunities may be on offer.
In recent years, the San Francisco office market has been the poster child for collapsing office values as vacancy rate soar past 30 per cent, and some office values down 75 per cent from peak[6].
However, there just may be a diamond in the rough. Today, 33 of the top 50 global AI companies (66 per cent) are headquartered in the San Francisco bay area[7]. And these companies require employees to work in the office[8], which in turn, is generating accelerating leasing demand as the above chart demonstrates.
It may take some time for the +30 per cent vacancy to be absorbed, but it feels there are significant opportunities in San Francisco for the patient real estate investor.
Chart 7
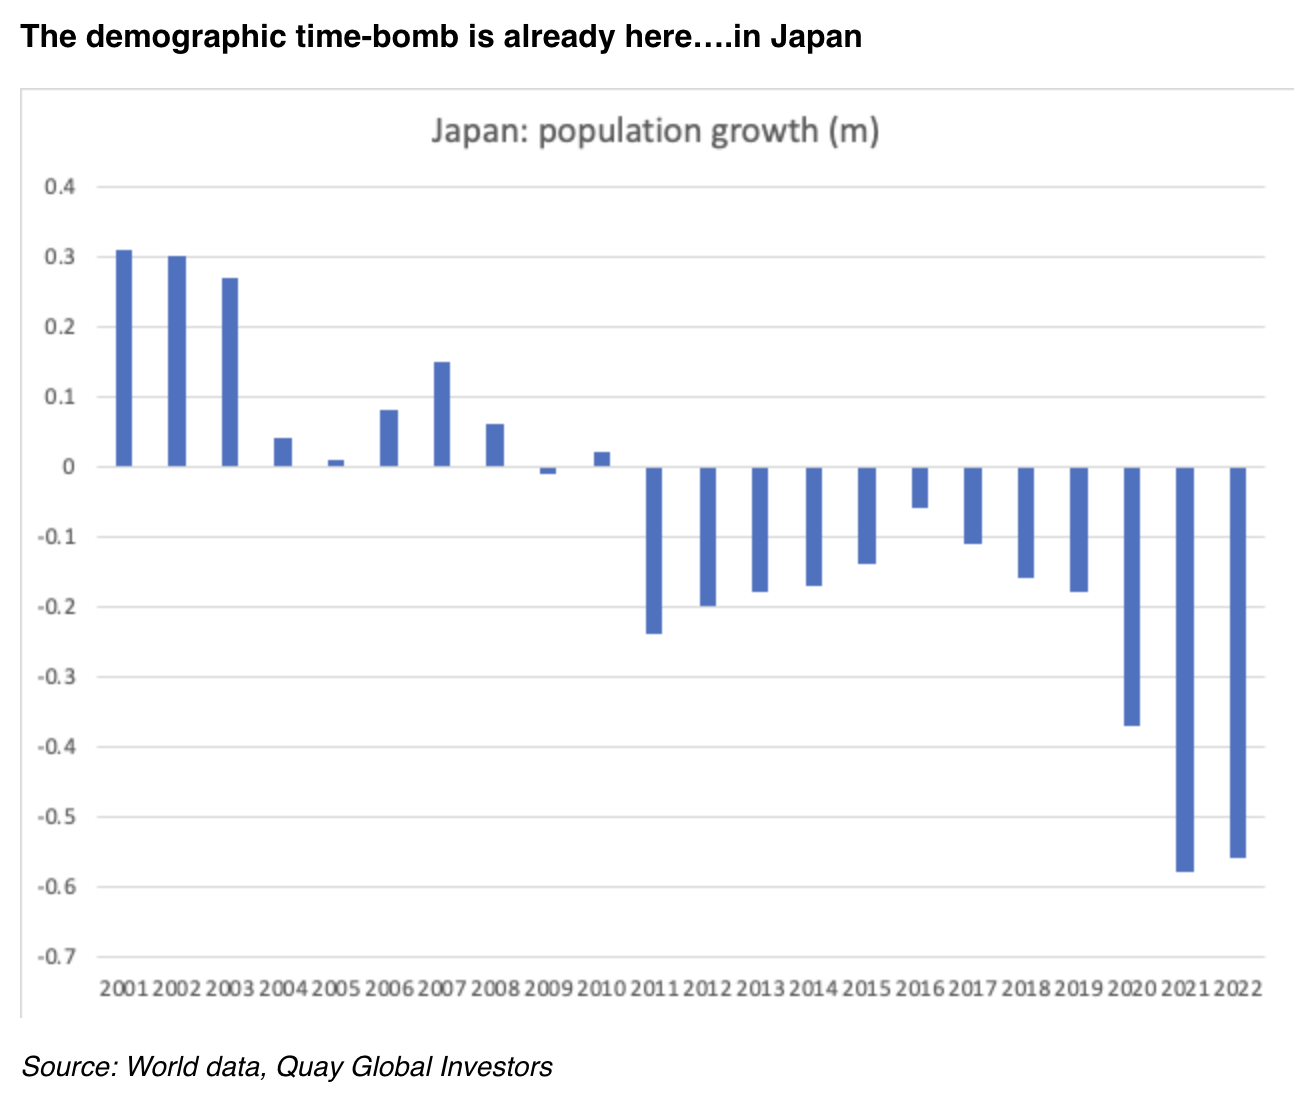

What it means
For the first time, each of Japan’s 47 prefectures posted a population decline in 2022. More the half of all municipalities in Japan are designated depopulation districts, schools are now closing, and more than 1.2 million small businesses have owners aged around 70 with no successors[9].
The implications for the local real estate industry (and potentially the banking sector) will be profound. Excess industry capacity (vacancy rate) is usually overcome with steady population growth; however this will not be the case in Japan.
The Japanese real estate market accounts for over 10 per cent of the global listed real estate index (developed). This is a slow moving, but very big, story.
Chart 8
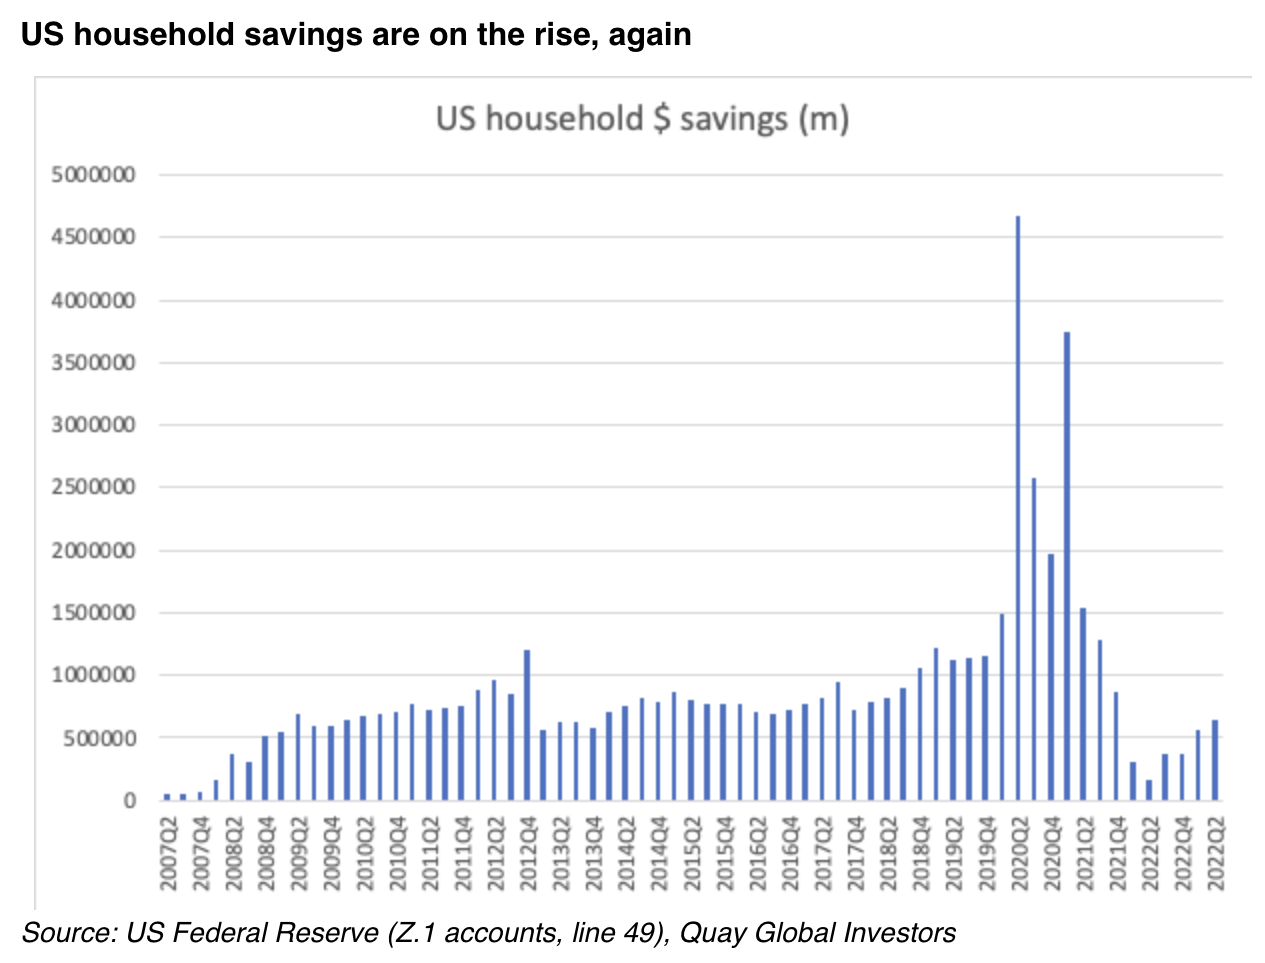

What it means
At the end of September, the Bureau of Economic Analysis updated its savings rate numbers and concluded that US “excess savings” during the pandemic are higher than previously believed[10]. As we detailed in our article from November 2021, Why the boom in household savings ain’t going away, one entity’s spending is always another’s income. So, when households spend, the income generally flows through to companies that pay wages and pay dividends from earned profits. Much of this simply flows back to households.
But now the rate of US household savings is growing again – adding a buffer to US household balance sheets. If there is any slow down or recession in the US, it seems unlikely to come from the household sector.
Chart 9
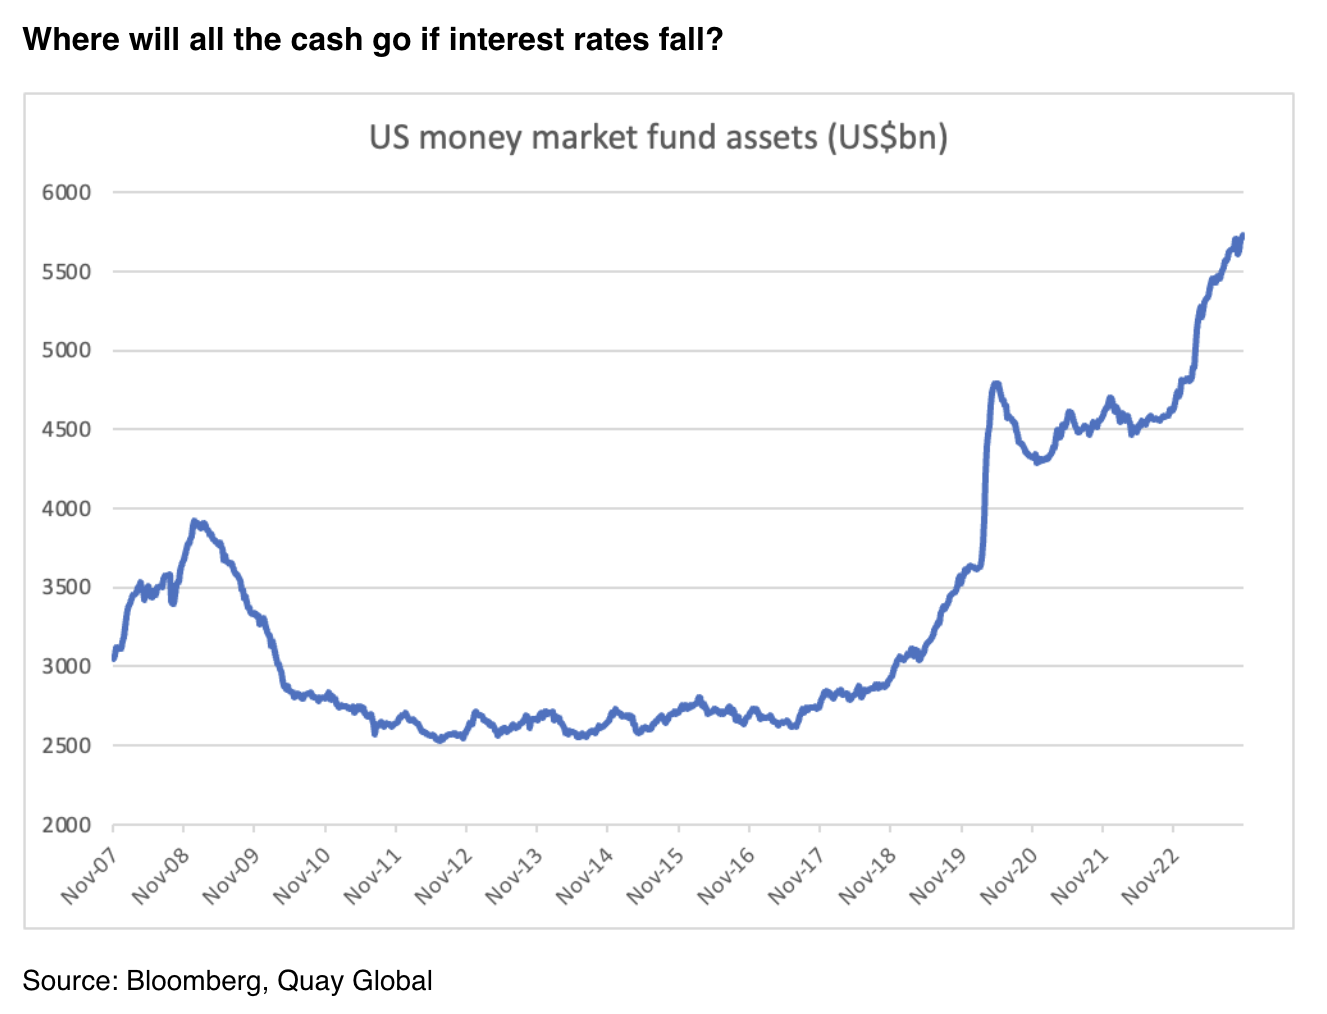

What it means
Where are these aforementioned savings accumulating? Not just in the banks, but more than ever, in money market funds (which in turn invest in high grade T-bills and bonds).
In a world of +5 per cent interest rates, this makes sense. But it also places the recent US equity market rally into impressive context – that there is a lot of investing firepower across a range of risk assets if or when interest rates begin to fall and cash begins to be re-invested again, as it did in 2009-2010.
Chart 10

What it means
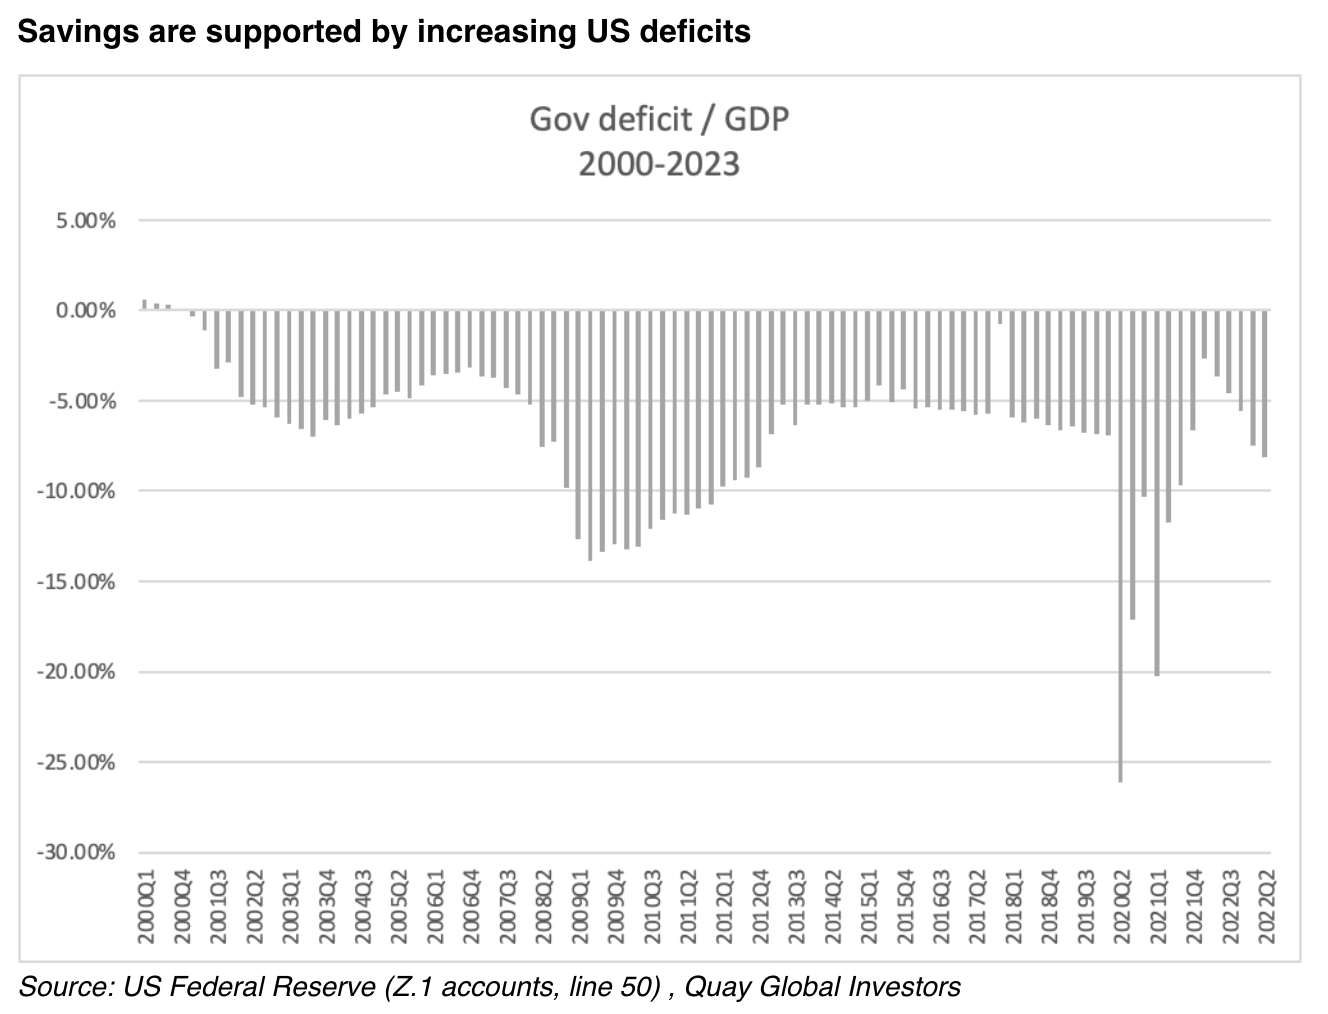
How can the US economy remain in such good heath while households are increasing their savings?
As we have previously highlighted, the answer is usually found via the change in sectoral balances. In this case, the re-acceleration in US government deficit (supported by rising interest payments on government debt balances) is adding money to the non-government sector, supporting incomes, profits and growth. As one entity’s financial loss (government) is exactly offset by another’s gain (non-government sector), the expanding deficit via higher interest rates is good news for the US economy and bad news for investors betting on a recession.
Chart 11

What it means
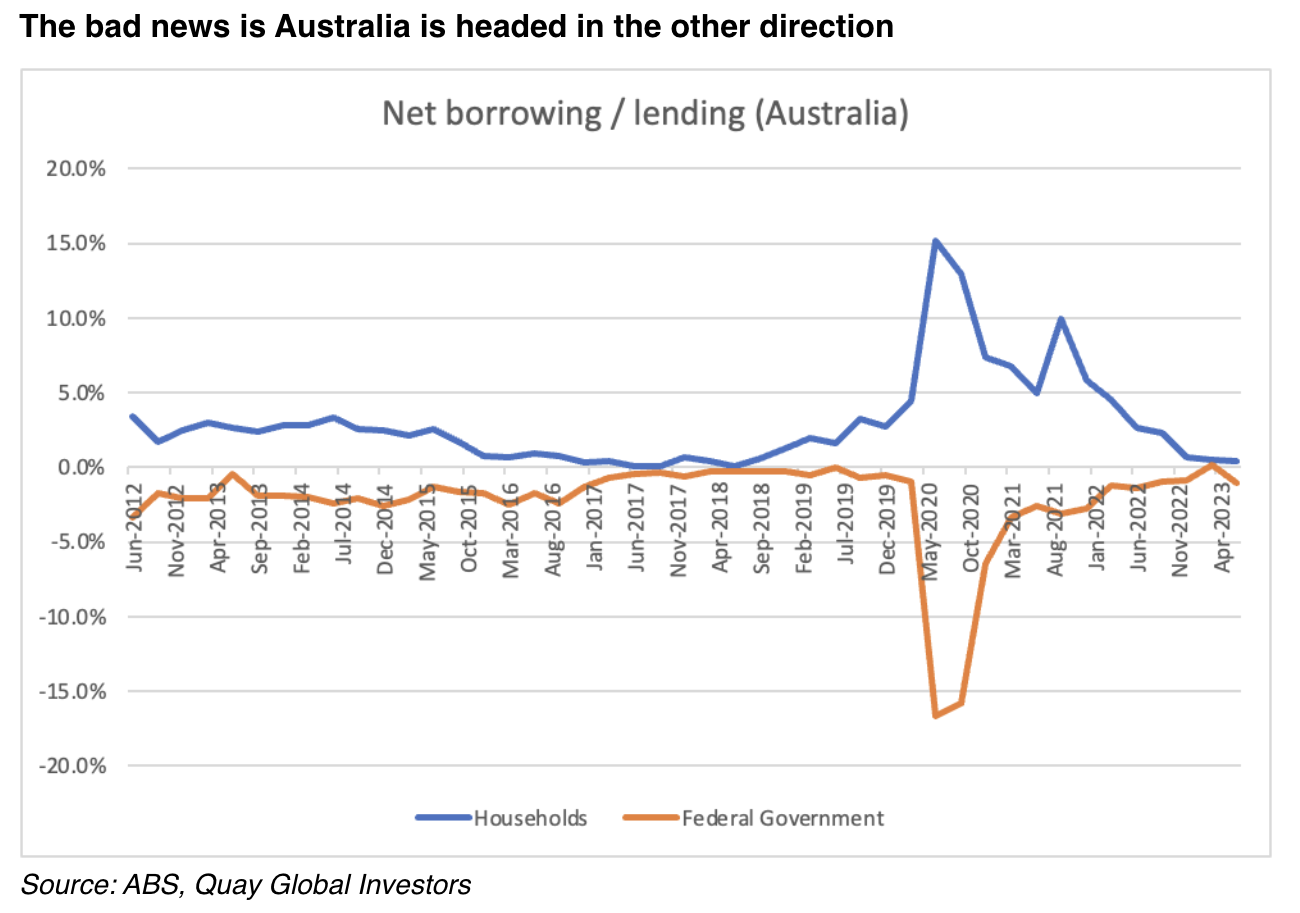
There have been recent signs of deceleration of the Australian economy. And while most will point to higher interest rates as the culprit, the federal government is playing its part via the fiscal balances.
The chart above highlights the near mirror image between federal government balances (net borrowing) and households (net lending). This should come as no surprise since the federal government’s so called “red ink” is equal to the non-government sector’s “black ink” simply by the laws of accounting.
As the current government lauds its attempt to deliver a “budget surplus”[11] the accounting reality is this will drain the non-government sector of much-needed net financial assets at a time of tight household budgets and elevated cost of borrowings.
If Australia does slide into recession in 2024, this will be a major cause.
Chart 12


What it means
Despite the near daily headlines of a predicted commercial lending crisis in the US post the Silicon Valley Bank collapse, US Federal Reserve data continues to point to positive credit expansion for most forms of commercial real estate (CRE). In fact, since the March banking crisis earlier this year, small US commercial banks (supposedly the most vulnerable) have extended a net $86.5 billion in additional commercial real estate credit.
As we highlighted in our article, Banks, balance sheets and bailouts earlier this year, commercial real estate includes a wide variety of asset classes, most of which continue to post positive growth in underlying cashflows, which enhances underlying credit quality. Office remains the challenged asset class, however, to date, overall credit continues to flow to the real estate sector.
A final brag…and thank you
As we close another year, as fund managers we often look back on our mistakes. What did we get wrong, and where could have we done better? This industry is quite efficient in assessing performance simply via the raw performance numbers. And on this basis, we feel we did ‘ok’, but can certainly do better.
We can however point with a certain amount of satisfaction to the quality and accuracy of our regularly published Investment Perspectives articles. And while this year’s economic and market environment may have surprised many, it has not surprised us. Our regular readers would have known, in advance, that:
- As per the Kalecki profit equation, US corporate profits were likely to remain robust post pandemic (as per our article published in June 2021).
- US interest rates would not slow the economy (as published in September 2022).
- A soft US economic landing was likely in 2023 (as published in December 2022).
- There were plenty of reasons to be optimistic in financial markets in 2023 (as published in February 2023).
- Australian residential property prices were likely to rise in 2023 (as published in March 2023).
- Concerns about the so-called “US banking crisis” were overblown (as published in April 2023).
- US disinflation was coming by year end (as published in September 2023).
Most of these views were non-consensus at the time. Most have turned out to be correct.
We always try to ensure our articles are of some value to our readers and strive to ensure our conclusions are backed by research, analysis and hard data. It’s this same rigor we apply to our stock analysis.
And a final year-end thanks to our investors and supporters. We take the responsibility of managing your money with the humility and gravity it deserves, and we continue to look forward to identifying the best research-backed global real estate opportunities into 2024.
By Chris Bedingfield, principal and portfolio manager
————