

There is a solid case for treating EM debt as a long-term core allocation rather than a tactical trade,
For advisers building diversified portfolios, especially those focused on generating income, Emerging Markets (EM) debt deserves consideration. The asset class has converged steadily toward Developed Market (DM) standards over the past decade, with governments improving fiscal discipline and central banks tightening monetary policy discipline. Rating agencies have responded with more upgrades than downgrades, and real yields now outpace inflation across much of the asset class, a feature increasingly hard to find elsewhere in fixed income.
The resilience shows up in how the asset class handles stress too. When conflict broke out in the Middle East this year, spreads barely moved, a muted reaction compared to past shocks. That appears to point to genuinely stronger fundamentals rather than complacency.
The result is a lower probability of the kind of shock that has historically caused spreads to blow out, since those episodes are typically triggered by recessions or sudden stops in economic activity, and neither looks imminent given the current capex-led growth cycle.
None of this means EM debt is risk free. Recession remains the biggest threat to credit spreads, and a shift in central bank policy could unsettle markets too. But in our view, neither risk looks imminent; combined with improving technicals (issuance has rebounded strongly in 2026 and inflows into external debt funds have reached around USD28 billion year to date[1]) the case for EM debt rests less on timing the market and more on holding it through cycles as a long-term diversifier.
For advisers reassessing client portfolios after a difficult stretch for the traditional 60/40 split, EM debt can offer a combination worth considering: reasonable income and a long-term track record of steady returns.
1. The role of EM debt for asset allocators
Since the birth of the asset class, EM debt has delivered superior risk-adjusted returns over most investable time horizons. One can think of EM sovereign as a marathon runner. It is possible to outperform it in the short term, but very hard to outrun it consistently. Yet this has long been overlooked by asset allocators. In the view of EM specialist Ashmore, investors remain structurally underexposed to this asset class both from a strategic asset allocation perspective, and cyclically, given the current market environment.
Fundamentally, EM sovereign is a credit asset class. Its risk premium has two main components. The first is rates, typically represented by US rates, which are more relevant for investment grade total returns. The second is the credit risk premium, which is more relevant for high yield. This is cyclical, as credit outperforms in high growth environments and underperforms in recessions. The ideal backdrop is a high growth-low inflation Goldilocks environment. The key risk, as shown in figure one[2], is stagflation. Another risk is relative value. This reflects the relative fundamentals, valuations and technicals of EM vs DM sovereign debt, which are discussed later in this article.
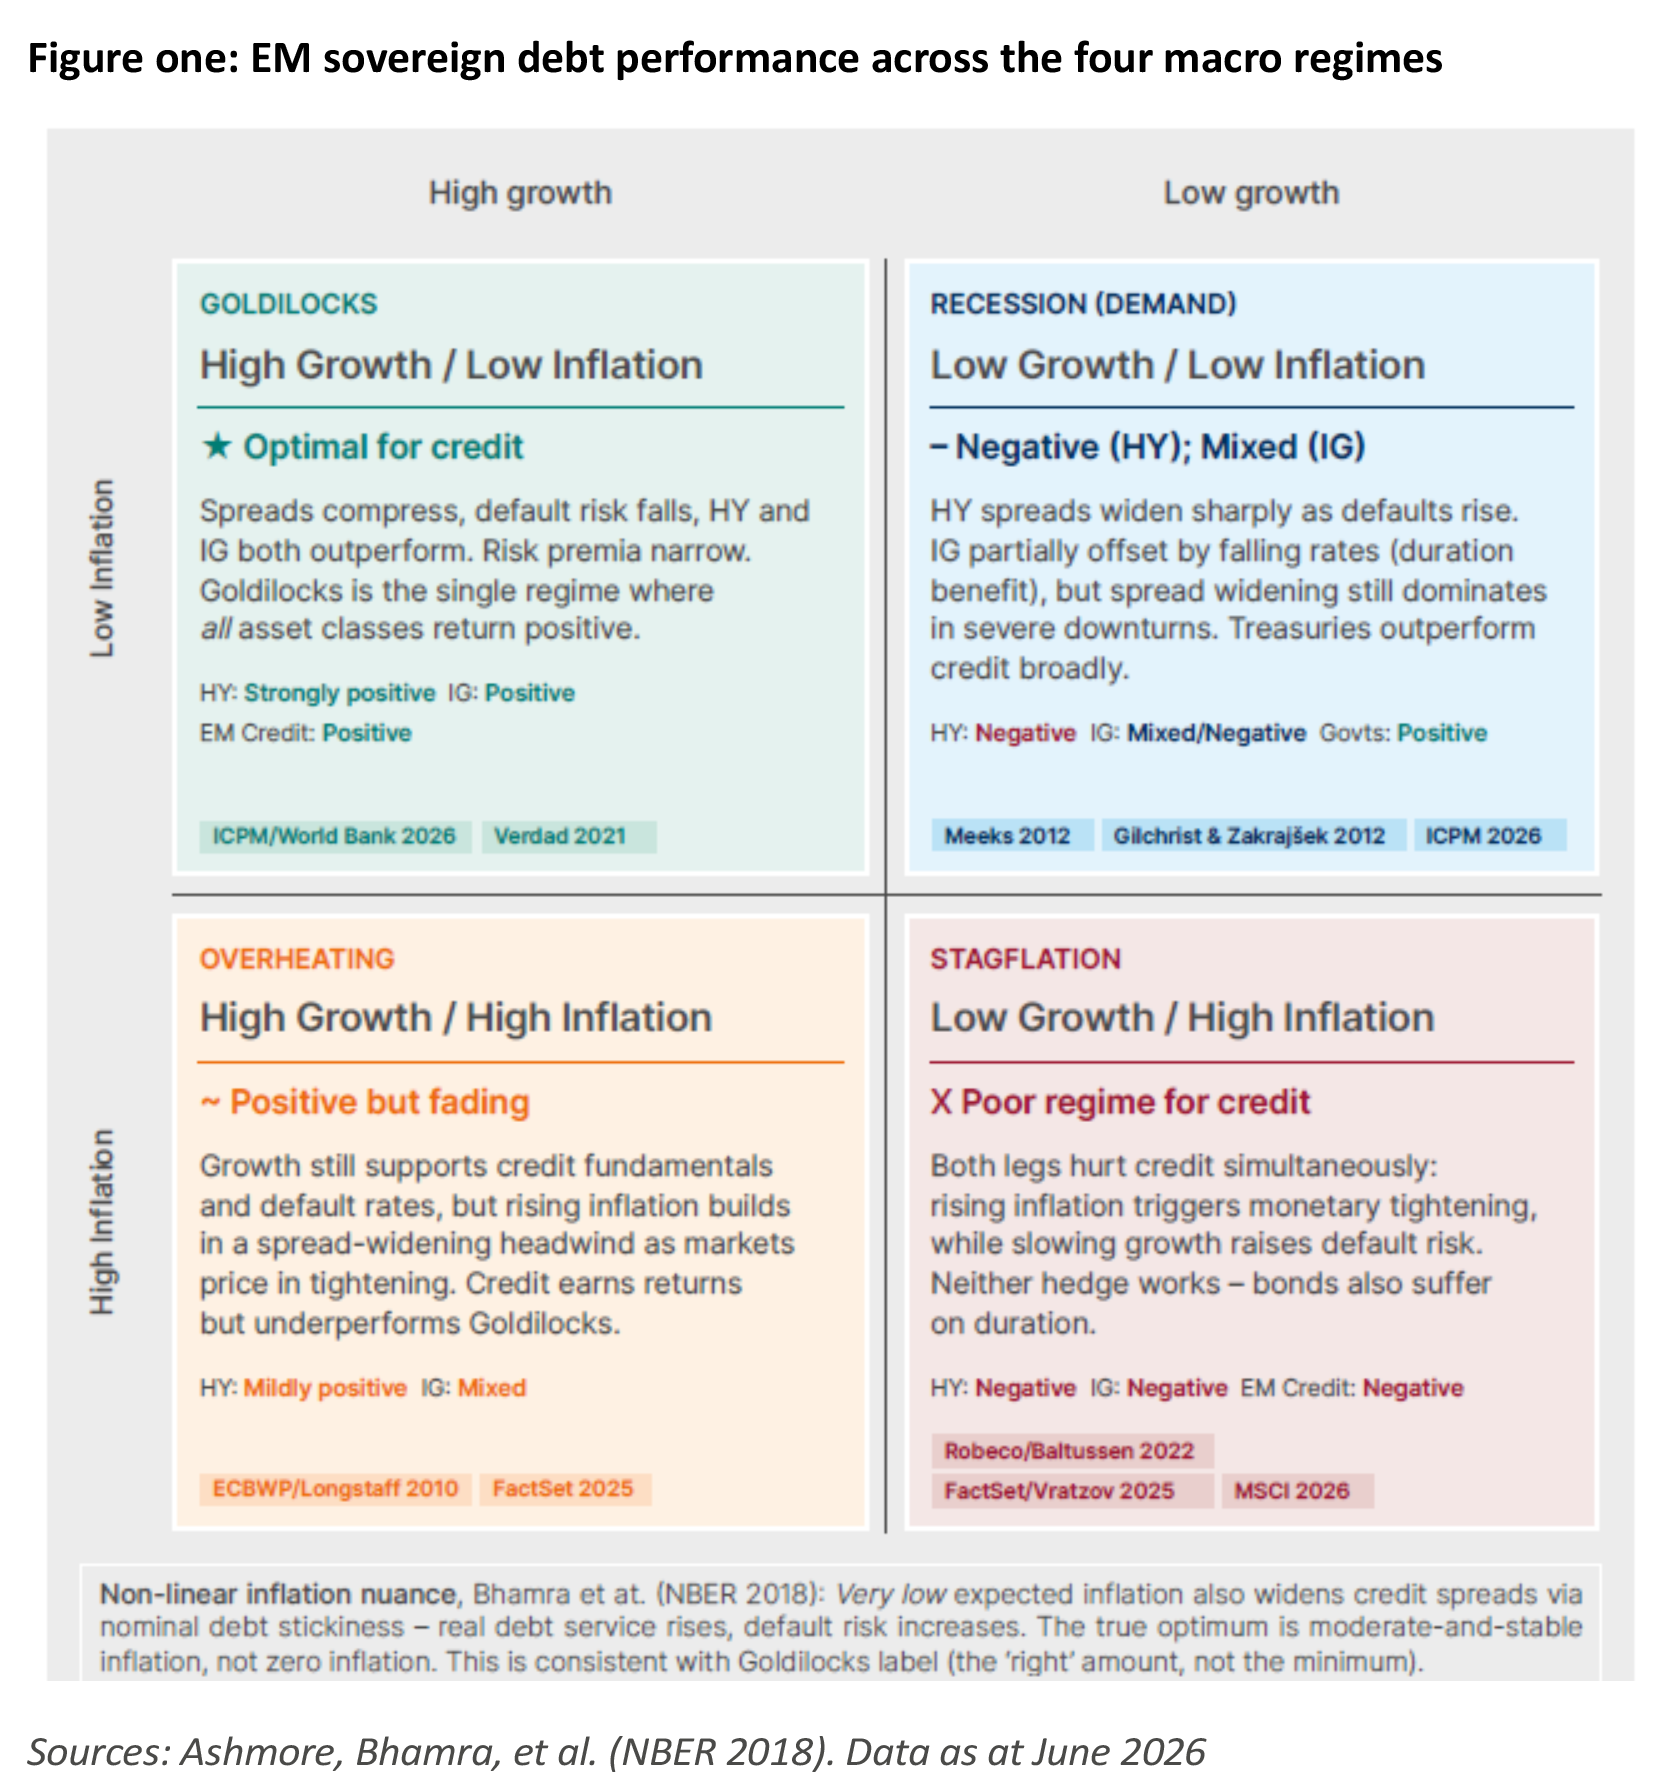

The macro regime analysis in figure one highlights that the main risk for the asset class is not rising core rates. Higher rates are usually driven by growth, which tends to be positive for credit spreads. The main risk is recession, where growth declines, credit freezes and defaults increase.
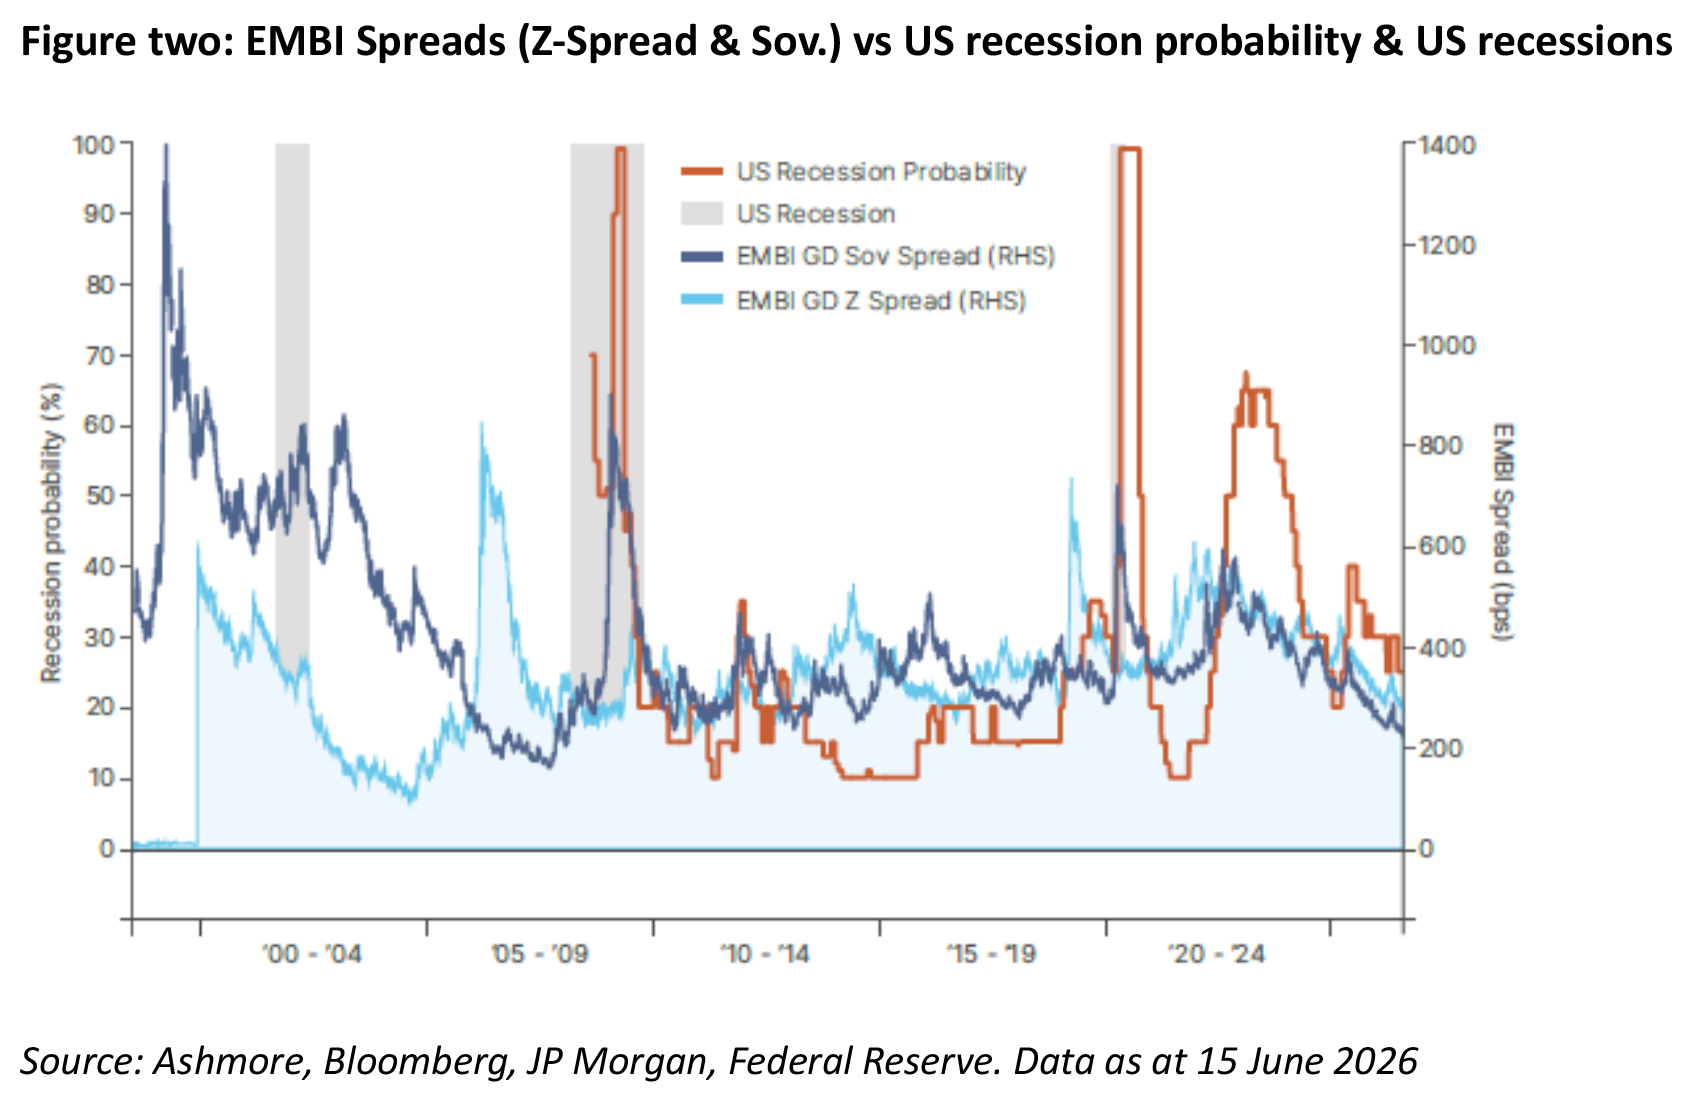
The most exposed assets in this environment appear to be highly levered companies and countries with few alternatives to roll over their debt. But credit spreads widen across markets regardless, even those with a low likelihood of default. Figure two illustrates how Emerging Market Bond Index (EMBI) GD[3] spreads have a large sensitivity to recessions, as well as fear of recessions:
- Widest spreads on record: 1997-2001 EM balance of payment & debt crisis
- Sharpest upward swings: 2008 GFC and 2020 Covid
- Wider spreads on fear of recessions: 2013 (taper tantrum), 2016 and 2022

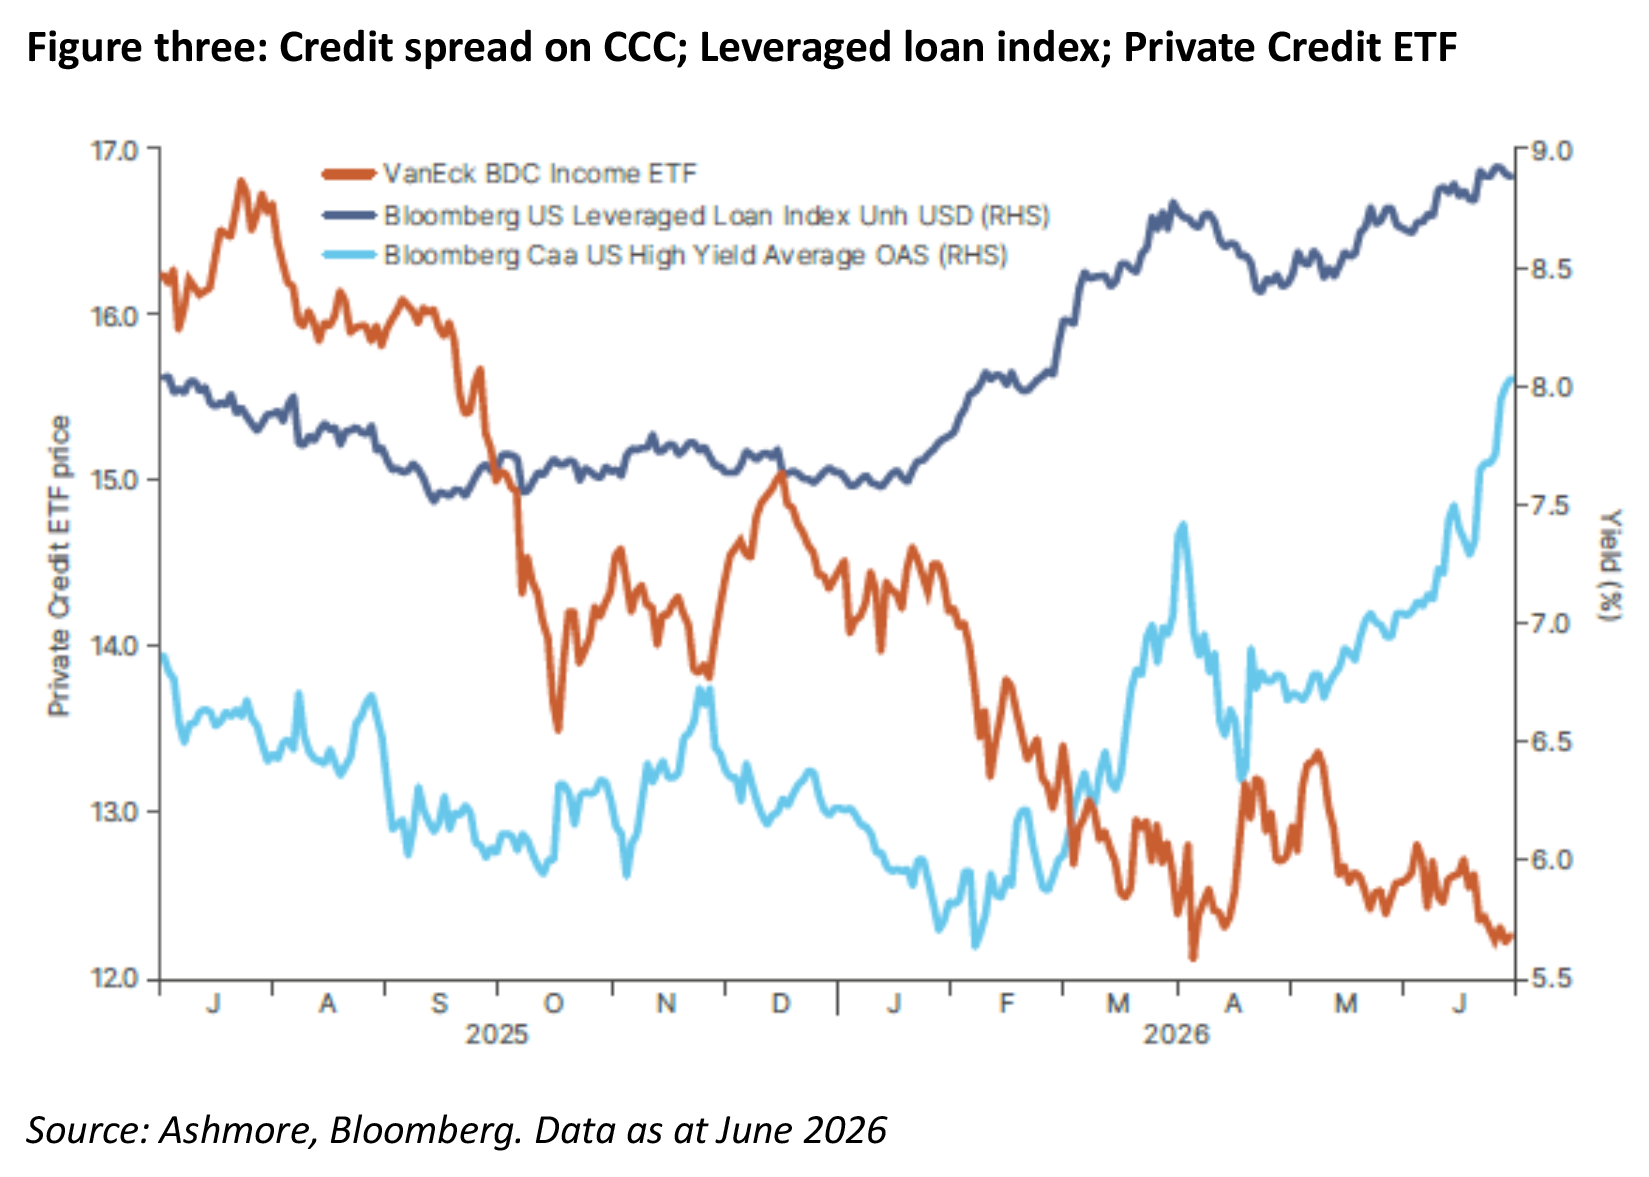
Even if markets were to price in a higher probability of a recession, the assets most exposed today are not in EM sovereign debt, but in developing markets. Credit spreads of CCC (or ‘junk bonds’), leveraged loans and private credit look more vulnerable, as shown in figure three.

Inflation is less of a risk than a change in the Fed’s reaction function
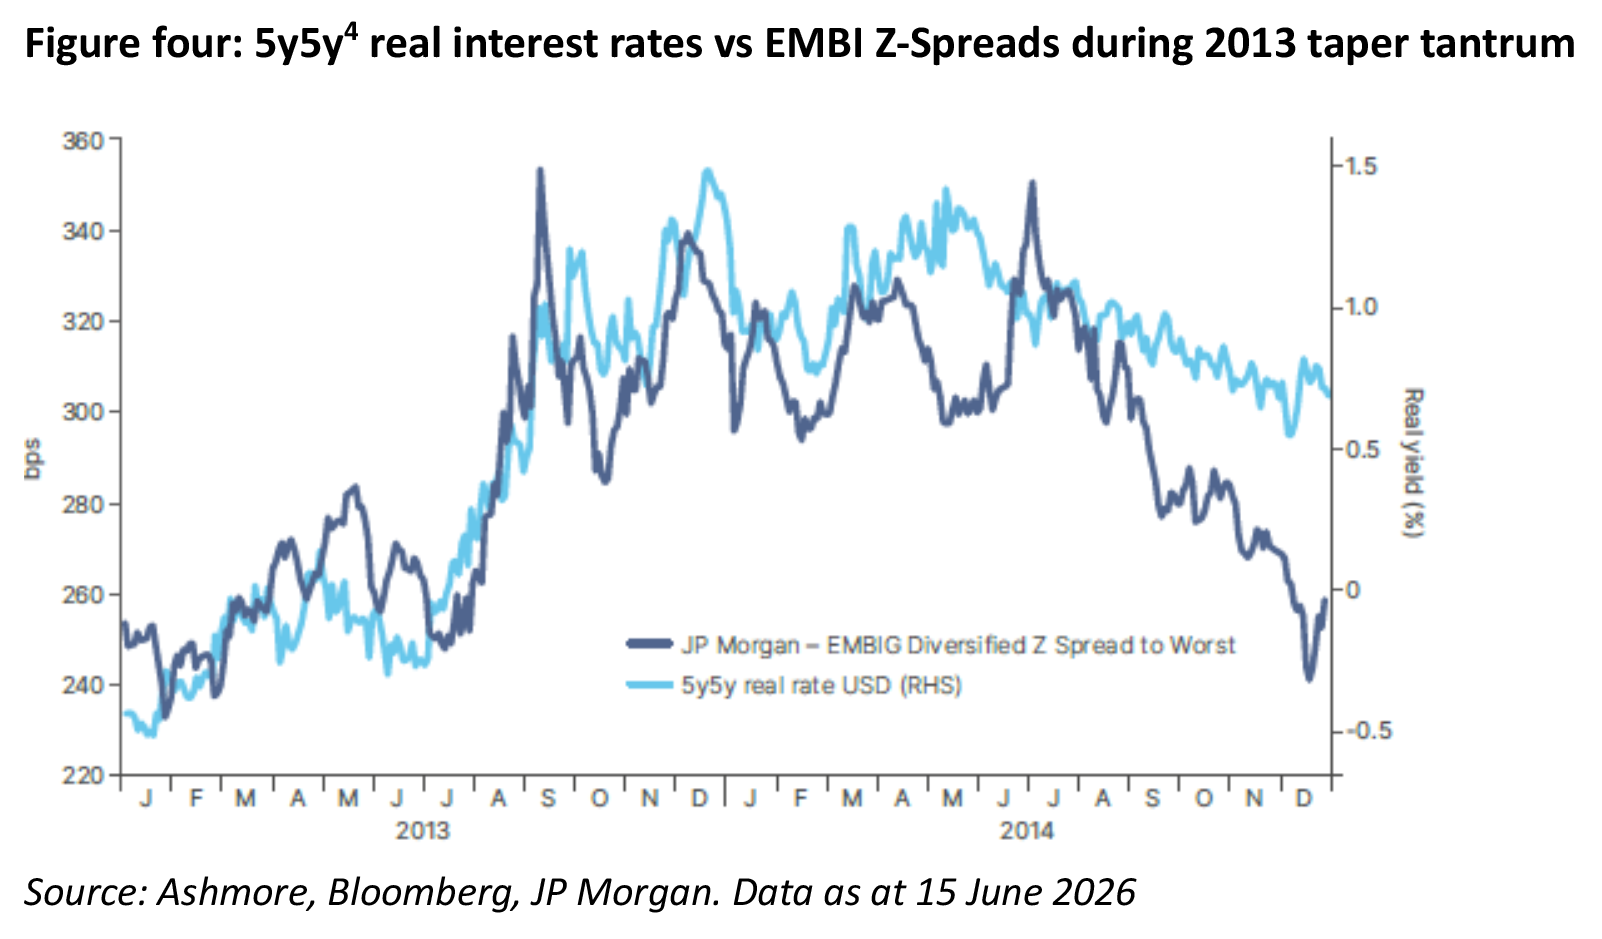
What drives the repricing of risk premia across credit asset classes is not inflation itself, but changes in the reaction function of the Federal Reserve (Fed), and other systemically important central banks. The 2013 ‘taper tantrum’, for example, led to a sharp rise in real interest rates, and therefore in the cost of funding for companies and sovereigns, despite no major inflationary threats, as shown in figure four.

The pandemic is another example. Markets were slow to react to the 2021 inflation spike, as investors remained comfortable with the Fed’s assessment that inflation would prove transitory, despite ample evidence to the contrary and repeated warnings from EM central banks. The sharp rise in risk premia came only in 2022, when central banks began to respond to inflation, as shown in figure five.
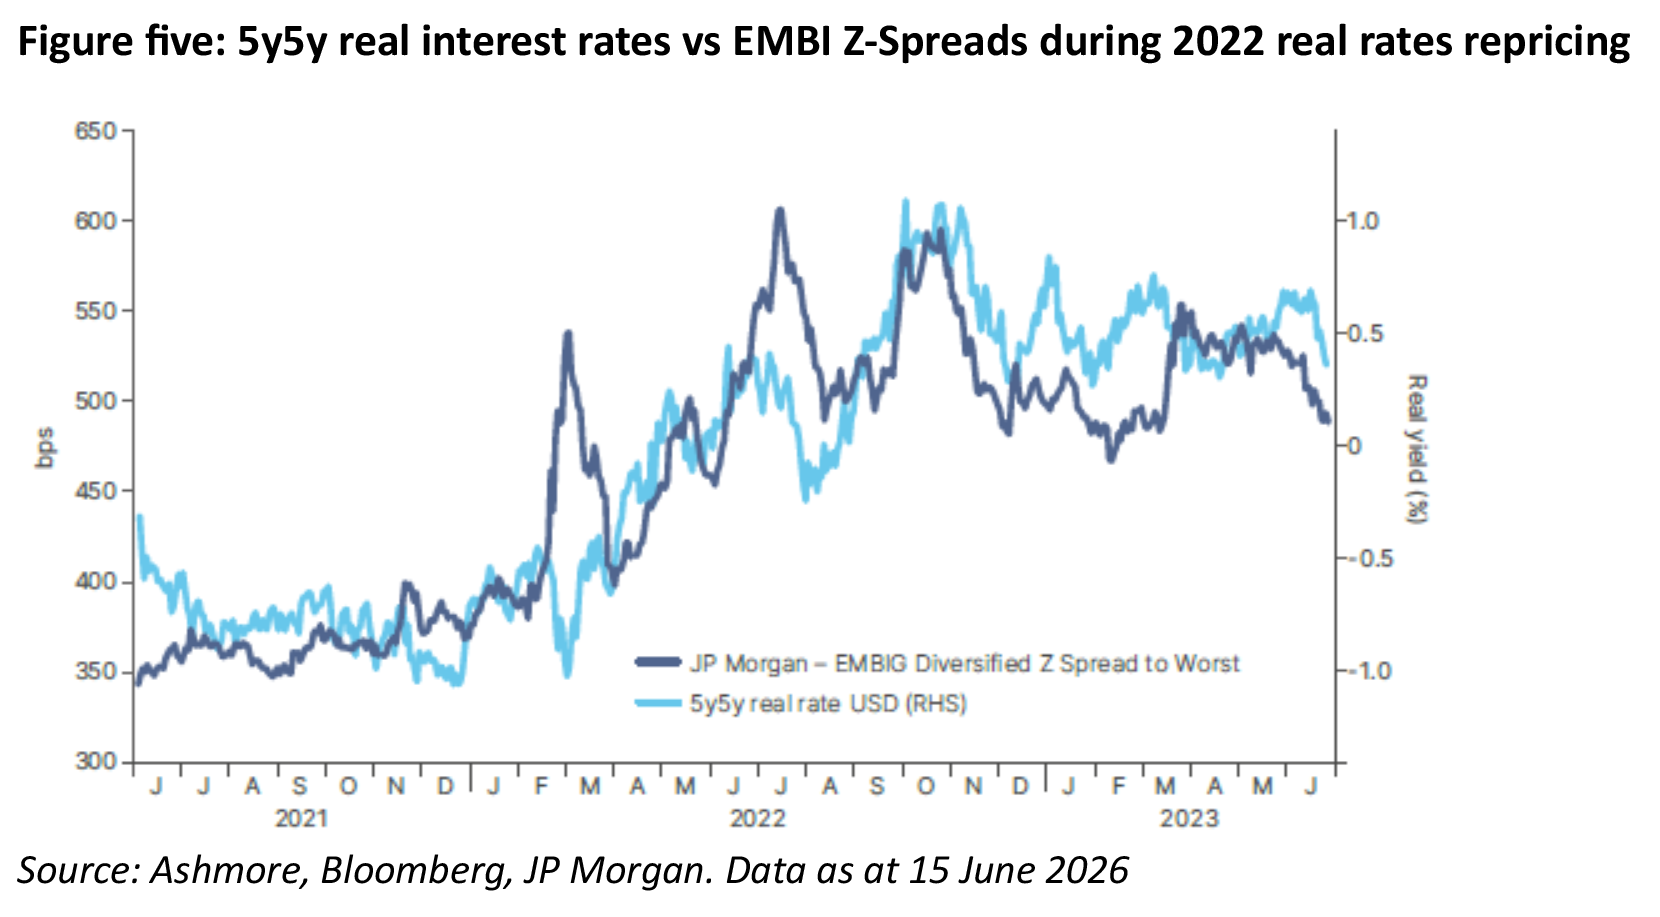

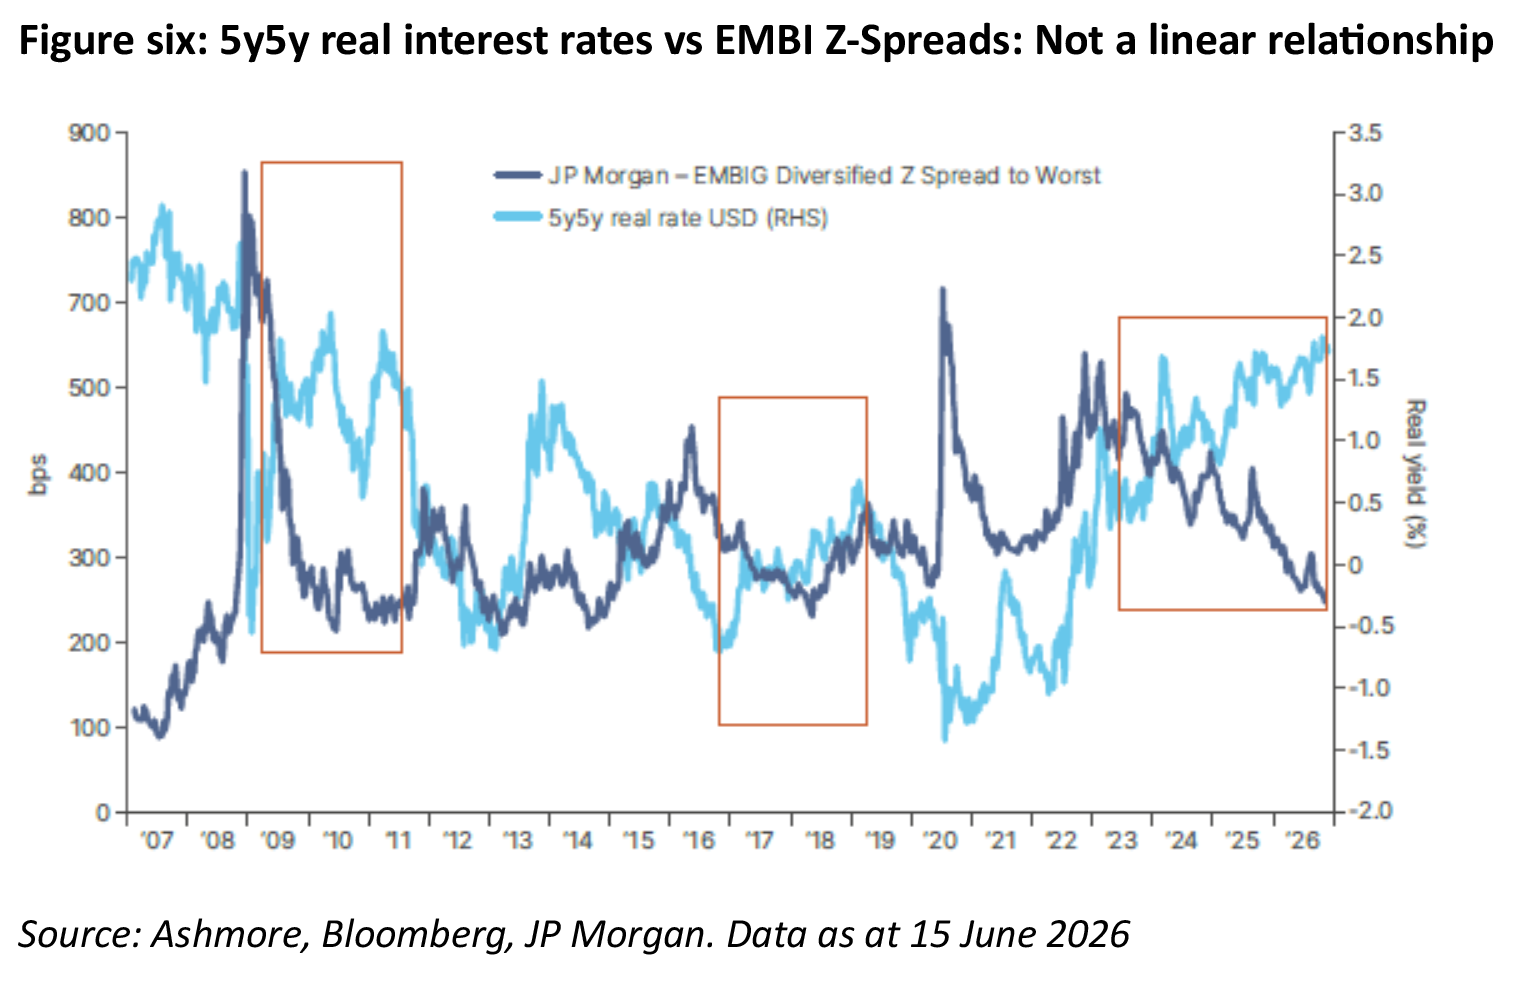
At first glance, figures four and five suggest that spreads are positively correlated with real yields, but that would be misleading. Often, higher real rates are a result of stronger economic growth, which inherently lowers the risk of defaults, driving spreads tighter as seen in the 2009-2011; 2016-2019; and 2023-2026 periods depicted in figure six. The same figure also shows that spreads widen most sharply during recessions. By contrast, the 5y5y real rates plunge in anticipation of easier policy, as was evident in 2008 and 2020.

A sharp deterioration in EM fundamentals (vs itself and vs DM)
EM fundamentals have been improving, and have further room to improve, in Ashmore’s view. Nevertheless, if those fundamentals start to deteriorate, EM credit spreads would likely widen relative to other credit asset classes.
3. Global macro dynamics
It is very hard to make the case that a recession is on the cards today. The main risk to the cycle is inflation prompting central banks to raise real rates significantly higher.
Ashmore has a high conviction view that we are in the middle of a capex supercycle, driven by investments in AI. The Strait of Hormuz crisis would likely accelerate investments in defence, energy and supply chain resilience. The following factors also contribute:
First, the same capex cycle will add cost pressure across the economy. Memory prices have risen roughly sixfold over the past 14 months, while electricity prices in many US states are rising due to higher demand from data centres.
Second, ageing populations are adding demand for healthcare, which in turn is raising demand for labour and putting upward pressure on wages.
Third, the post-pandemic fiscal expansion enabled many businesses to increase margins in the face of supply shocks. They may try to do the same again following the oil price spike.
Fourth, in a multi-polar world, fragmented supply chains are a source of inflationary pressure. However, we do not see a broad de-globalisation trend taking place. That distinction is key. Broad deglobalisation would raise costs across countries. In a multipolar world, countries that do business with China and the US can still benefit from China’s disinflationary impulse and access to American capital markets.
Factors pointing to disinflation are:
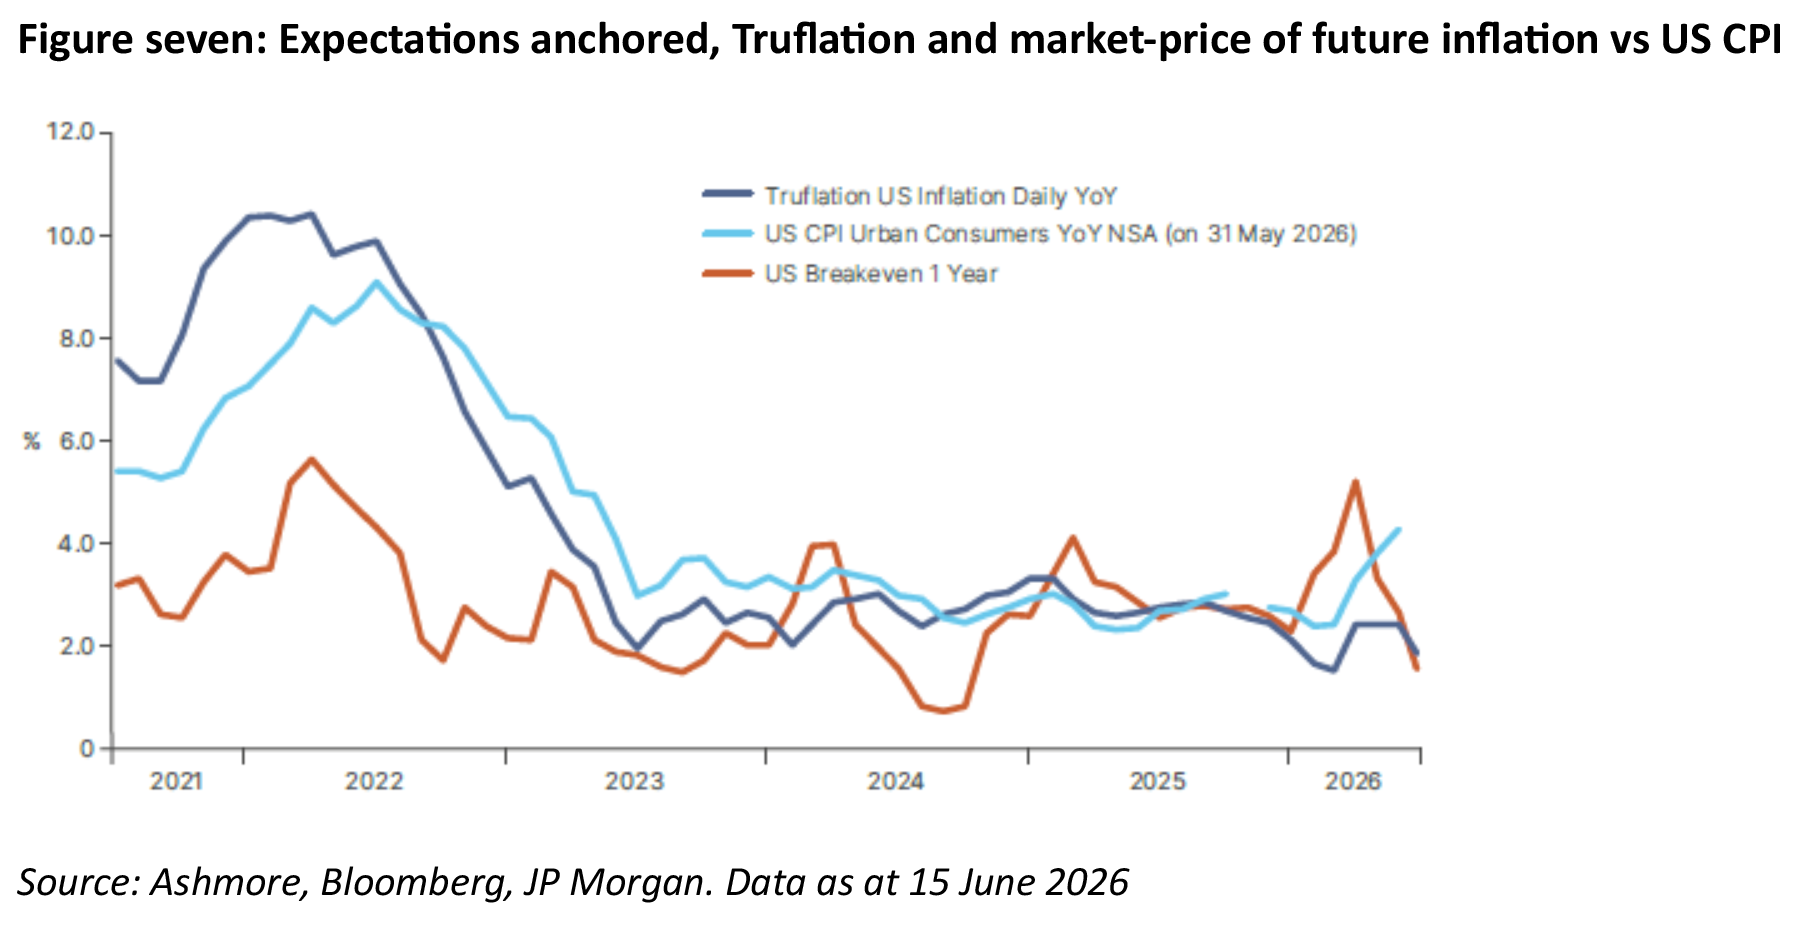
First, inflation expectations remain anchored both in the short and long term. Figure seven shows that one-year breakeven inflation plunged to 1.55% from a peak of 5.2% in March. Meanwhile, the Truflation index, which tracks prices scraped from the web, never rose above 2.5%.

Second, the reopening of the Strait should help to normalise energy supply, although that reopening remains in limbo as hostilities have once again escalated. Demand, meanwhile, has declined rapidly, some of it irreversibly, due to the energy transition. In China, for example, oil demand fell by 1.5 million barrels per day, despite large reserves.
Third, one the situation in the Middle East settles, supply is likely to normalise faster than expected. Qatar has signalled that liquefied natural gas (LNG) supply could return to 50% of normal levels within one month and 80% within two months. Kuwait is also reportedly ready to ramp up oil production quickly, having kept its wells operational.
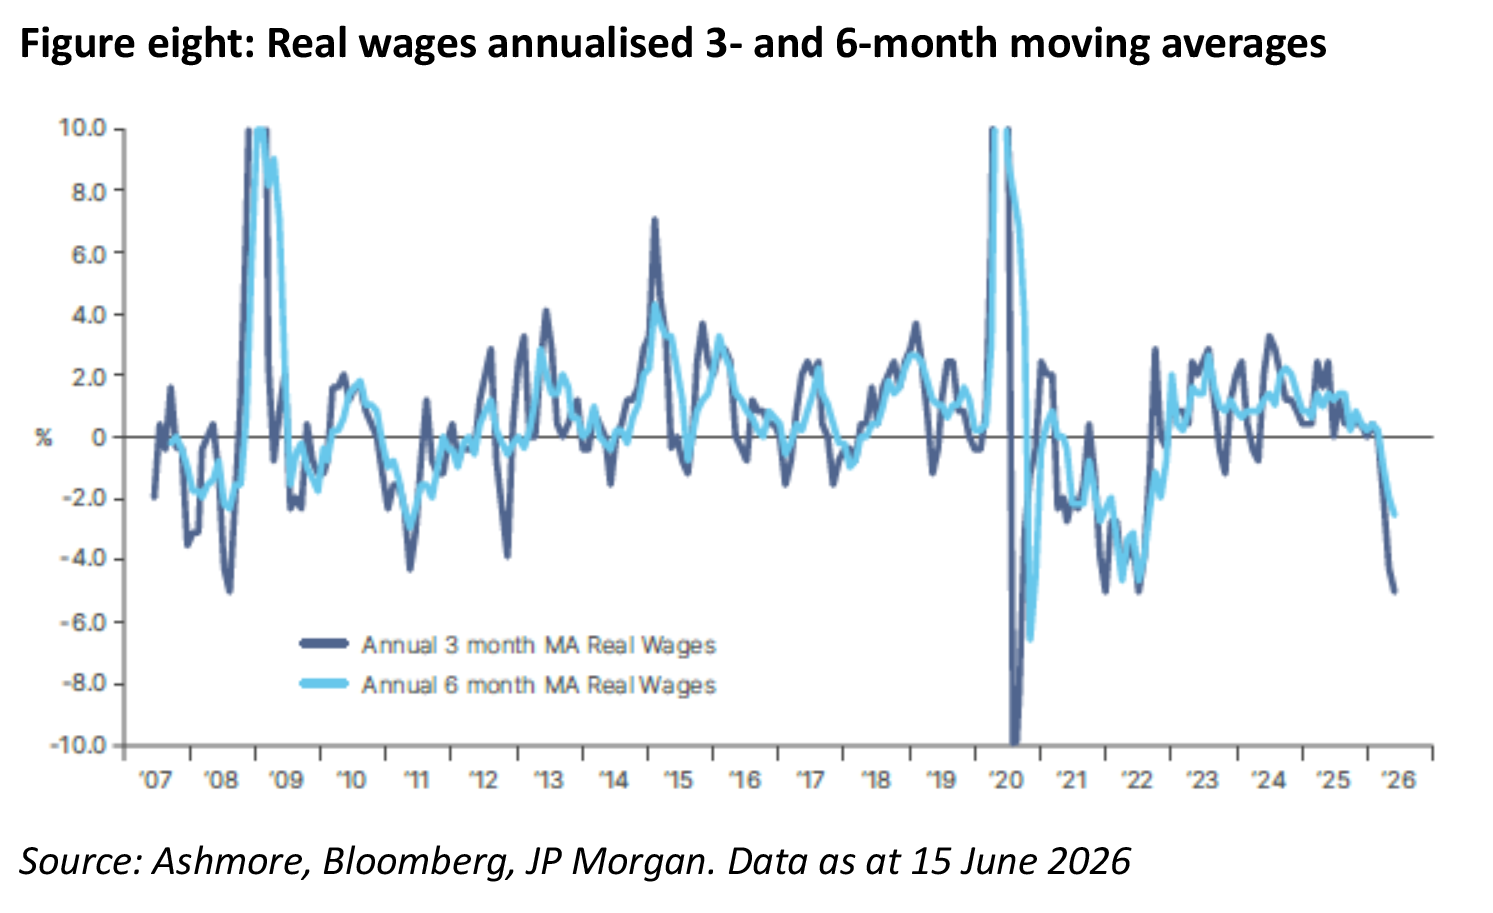
Fourth, there is little evidence, so far, of oil prices pass-through to non-tradable prices as higher energy prices brought real wages to negative levels in the US, as per figure eight.

Fifth, China is still exporting deflation to the rest of the world by increasing production. This remains a structural disinflationary source.
Sixth, US tariffs have fallen sharply following the Supreme Court’s February 2026 ruling that IEEPA does not authorise the President to impose tariffs. Trump continues to impose other tariffs using other mechanisms, but the effect of the legal losses is a materially lower tariff burden than existed in early 2025, with further downward pressure likely.
Last, we still see AI as a disinflationary force for wage inflation. Many sectors and companies, particularly in software, have already been disrupted, forcing them to boost competitiveness. We have seen Chinese large language model companies releasing models that are much cheaper to run, and Jevons paradox suggests lower costs drive higher demand for new technologies, boosting productivity.
Overall, Ashmore believes its positive outlook for EM debt has been only temporarily disrupted by the Strait of Hormuz crisis. Although the Fed and the Bank of England have adopted a hawkish tone, they are likely to keep policy rates unchanged. The European Central Bank (ECB) and the BOJ both had lower policy rates and hiked rates by 25 basis points this month. The BOJ should hike again in our view, but the ECB remains data dependent.
4. Six reasons for EM resilience
Improving fundamentals, both in absolute and relative terms to DM, could suggest EM debt will trade at structurally tighter valuations, and display lower volatility, than before the pandemic. In our view, EM is converging to DM across economic fundamentals, institutional development and political stability.
Institutional convergence
Political risk is deteriorating in DM, clearly driven by a few large countries such as the UK, France and the US. On the other hand, there are evident signs of improvement in EM, notably countries such as Hungary, Romania and much of Latin America (Argentina, Panama, Chile, Peru, Colombia and Mexico). EM institutions are improving as much of DM deteriorates – a re-rating catalyst.
“The US has seen the sharpest rise in risk, which is related to growing institutional fragility and a rise in populism. In Europe, France is facing a major and unprecedented political crisis.” – Coface Risk Review, October 2025.
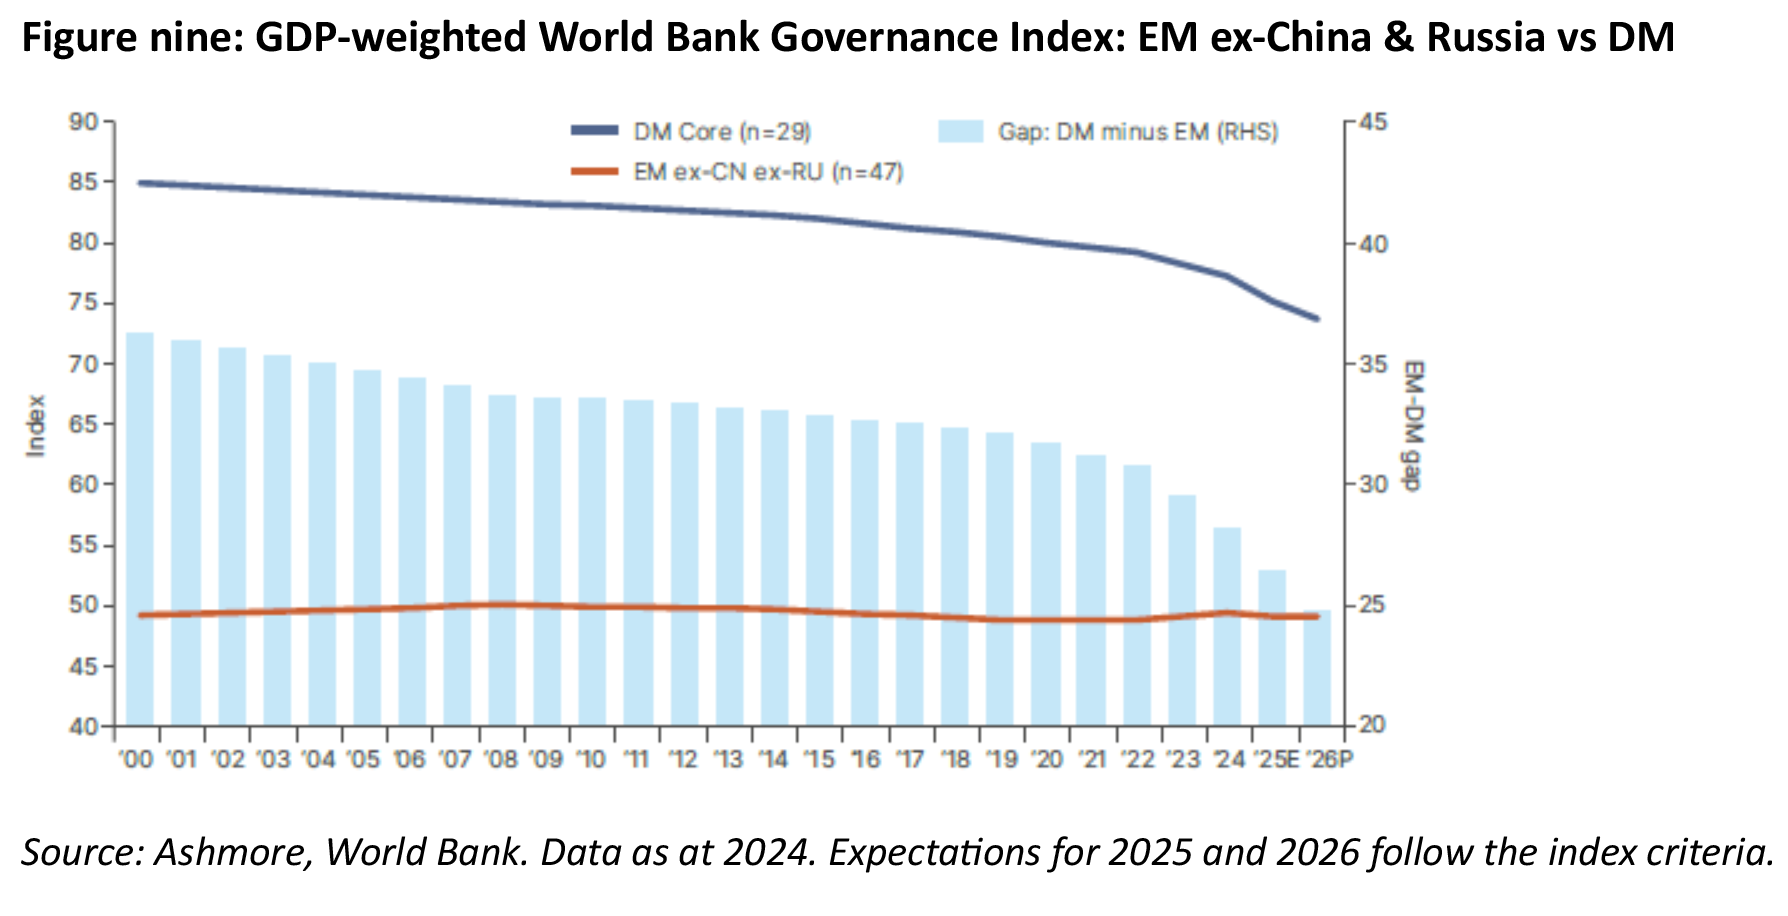
Figure nine shows a clear convergence between EM and DM in the World Bank Governance Indicator. The data only run to 2024, however, and there is a severe lag between political change on the ground and an effective improvement in the index.
The EM stability in the index is explained by a sharp deterioration in Türkiye (-21) and South Africa (-13), and offsetting improvements in the UAE (+12), Romania (+10), Indonesia (+11), Czechia (+4) and Poland (+3). The political transition in Hungary and Latin America as well as the economic reforms in South Africa and Türkiye will lead to an improvement in the index over the next years.
DM governance, by contrast, has been clearly deteriorating. The war in Iran and the tariff agenda have exacerbated the sense that the institutional backdrop is deteriorating fast.

Inflation targets convergence
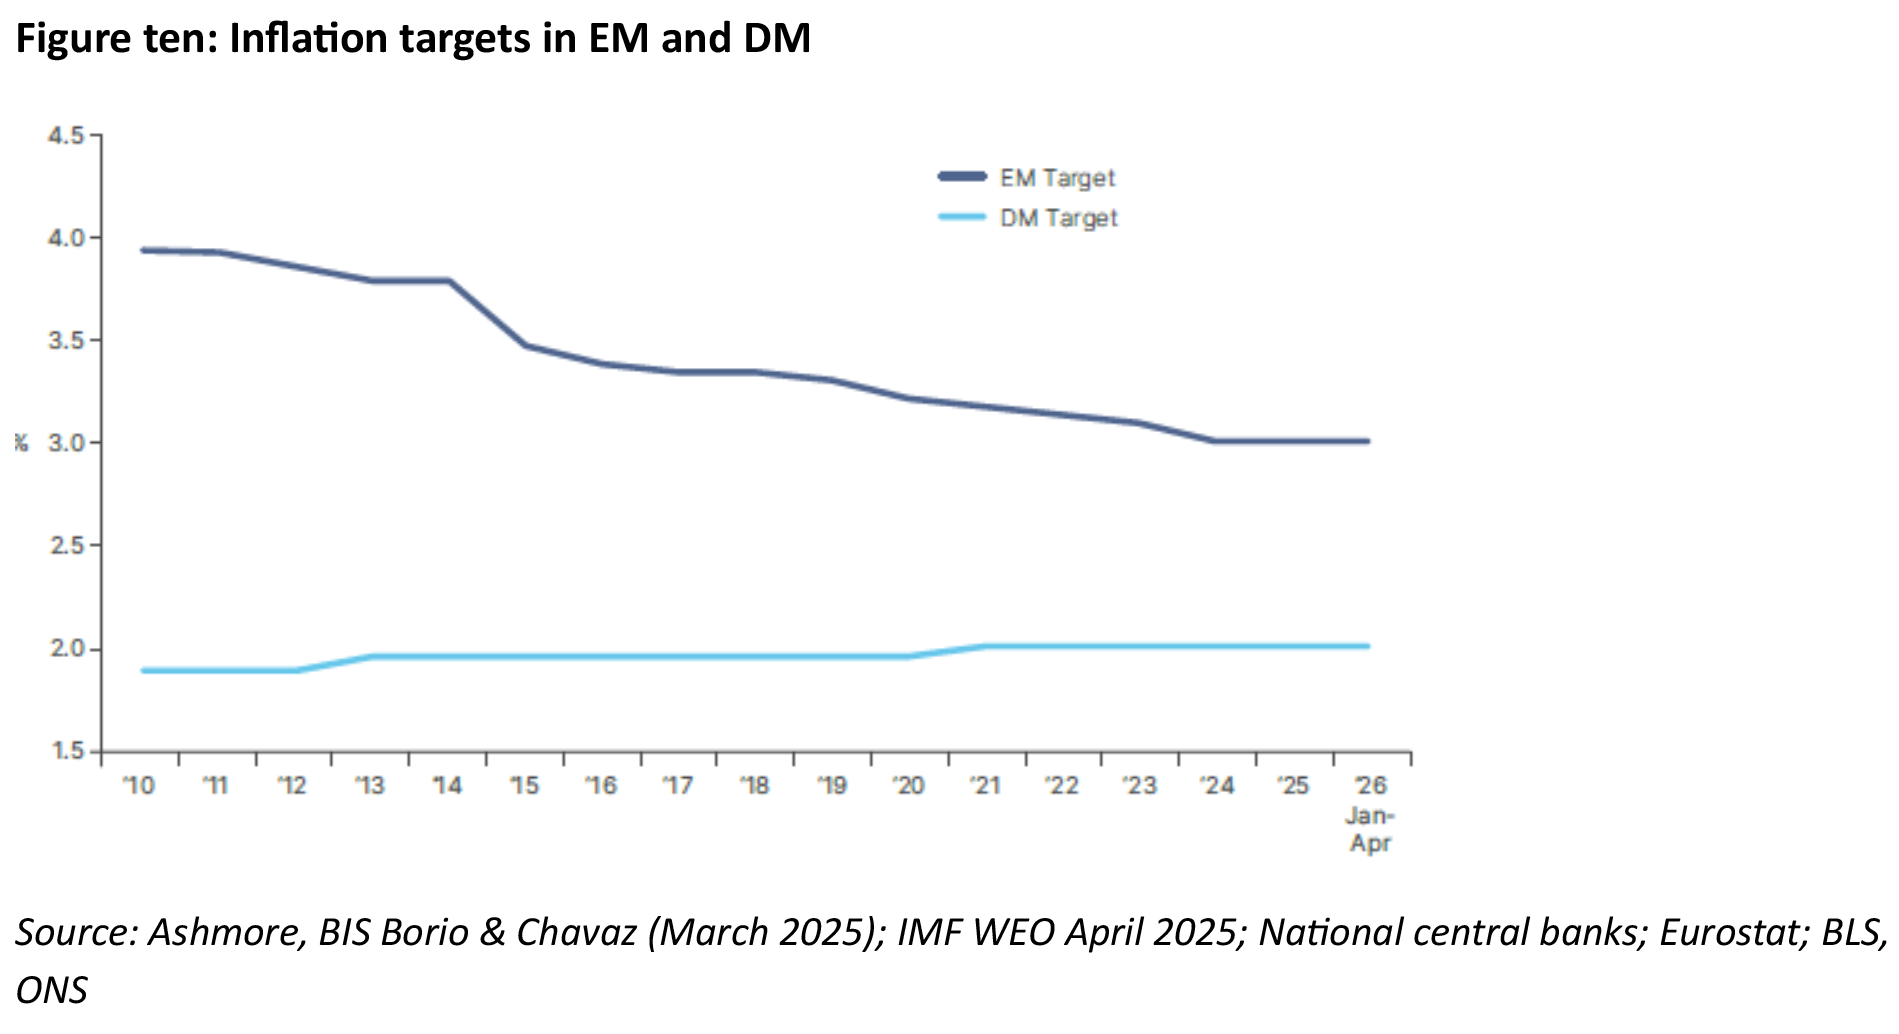
EM central banks continue to strengthen their inflation targeting regimes. Over the last ten years, inflation targets have been lowered in India, Korea, Indonesia, the Philippines, South Africa and Brazil. This can be seen by the convergence of EM inflation targets towards DM in figure ten. This convergence could have further to run. The new government in Hungary, for example, has adopted joining the euro as a strategic objective, which would require lowering its inflation target from 3.0% to the ECB’s 2.0%.

DM central banks have softened their focus on inflation
As EM central banks sharpened their focus on lowering inflation, DM central banks have diluted their focus on inflation in favour of other topics, including the energy transition. In 2022, most DM central banks remained well behind the curve, labelling inflation ‘transitory’ despite ample evidence to the contrary. More strikingly, in 2020, the Fed published its FAIT (Flexible Average Inflation Targeting) framework, under which officials committed to allowing inflation to rise above 2.0% for a period after periods in which it had fallen below 2%, so that inflation would average 2.0% over time. A 2025 Dallas Fed working paper attempted to quantify the cost of that approach, estimating that FAIT raised CPI inflation by around 1.0% and core CPI inflation by 0.5%, with inflation expectations increasing by around 0.8%[5]. The Fed eventually abandoned FAIT at Jackson Hole in August 2025.
EM central banks acted earlier to rein in inflation
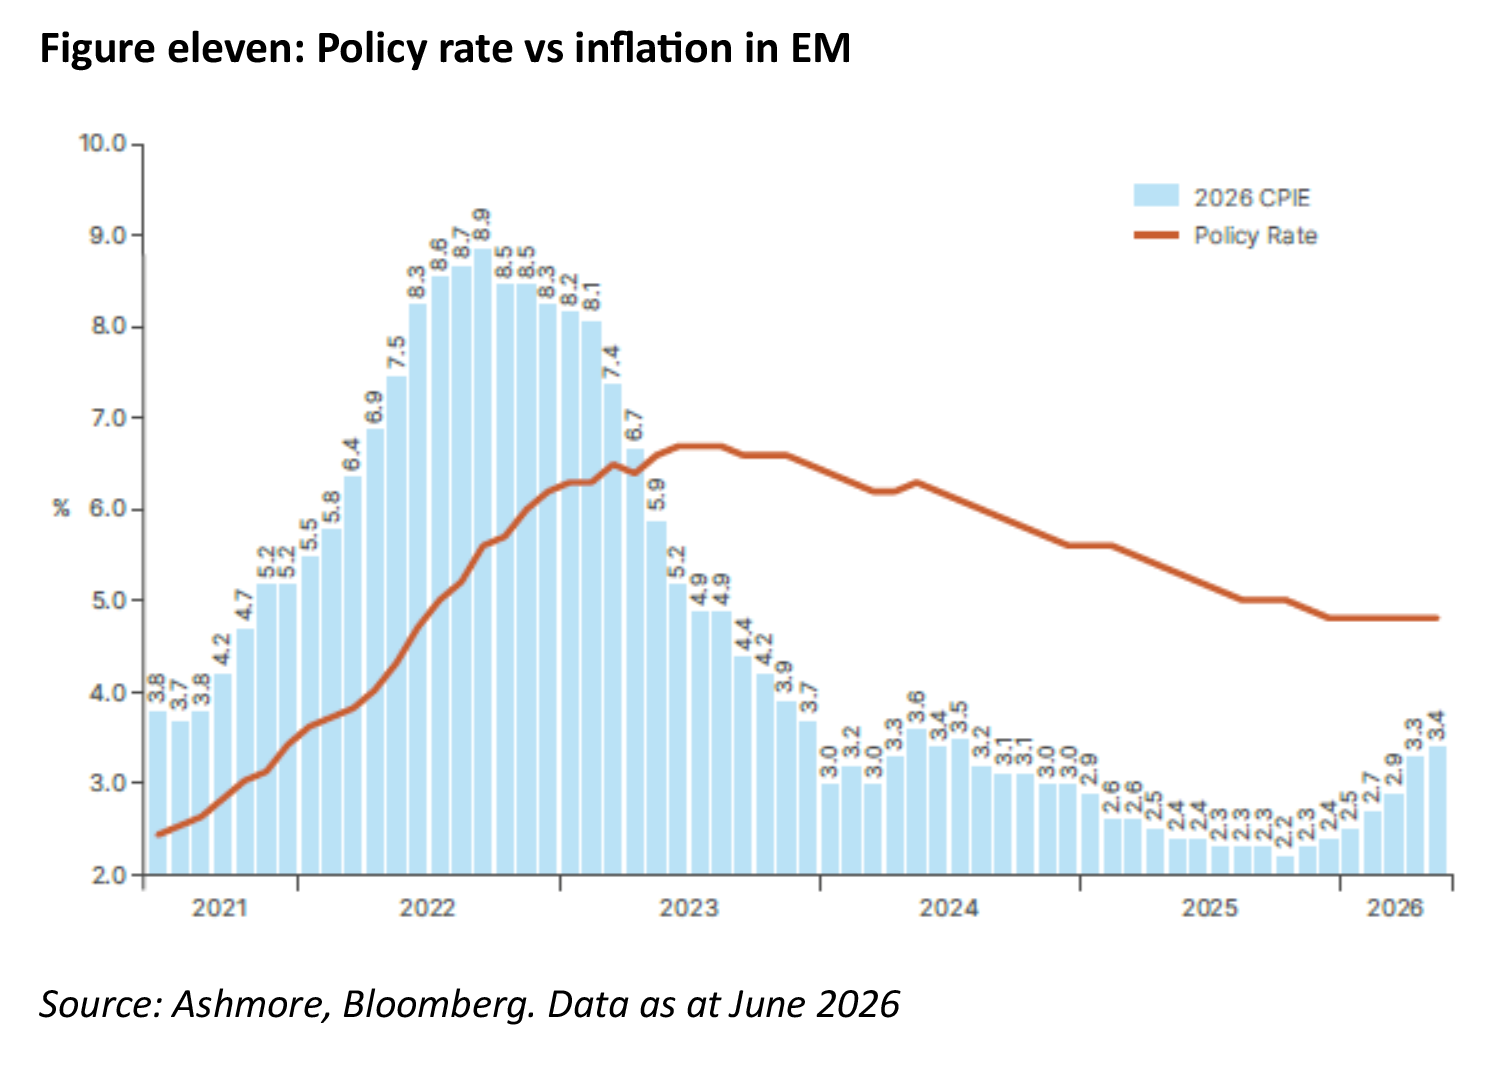
Furthermore, EM central banks placed a much stronger emphasis on bringing inflation back to target in the post-pandemic period. Most EM central banks started hiking policy rates nearly 12 months before their DM peers and kept real rates at elevated levels for longer. This helped to anchor inflation expectations more quickly, and brought inflation down faster, supporting macro stability. In other words, EM central banks have become more disciplined, eroding the DM credibility premium.
More recently, several countries have adjusted their policy stance again. Over the last three months, Indonesia, Philippines, South Africa, and Czechia hiked policy rates to anchor inflation expectations, while Brazil and Mexico paused cutting cycles, resulting in still elevated real policy rates. The GBI-weighted EM CPI stands at 3.4%, but the policy rate is closer to 4.9%. In contrast, DM policy rates stand below inflation in most countries. In the US, for example, CPI inflation hit 4.25% in May against a policy rate of 3.75%.

Macroeconomic convergence
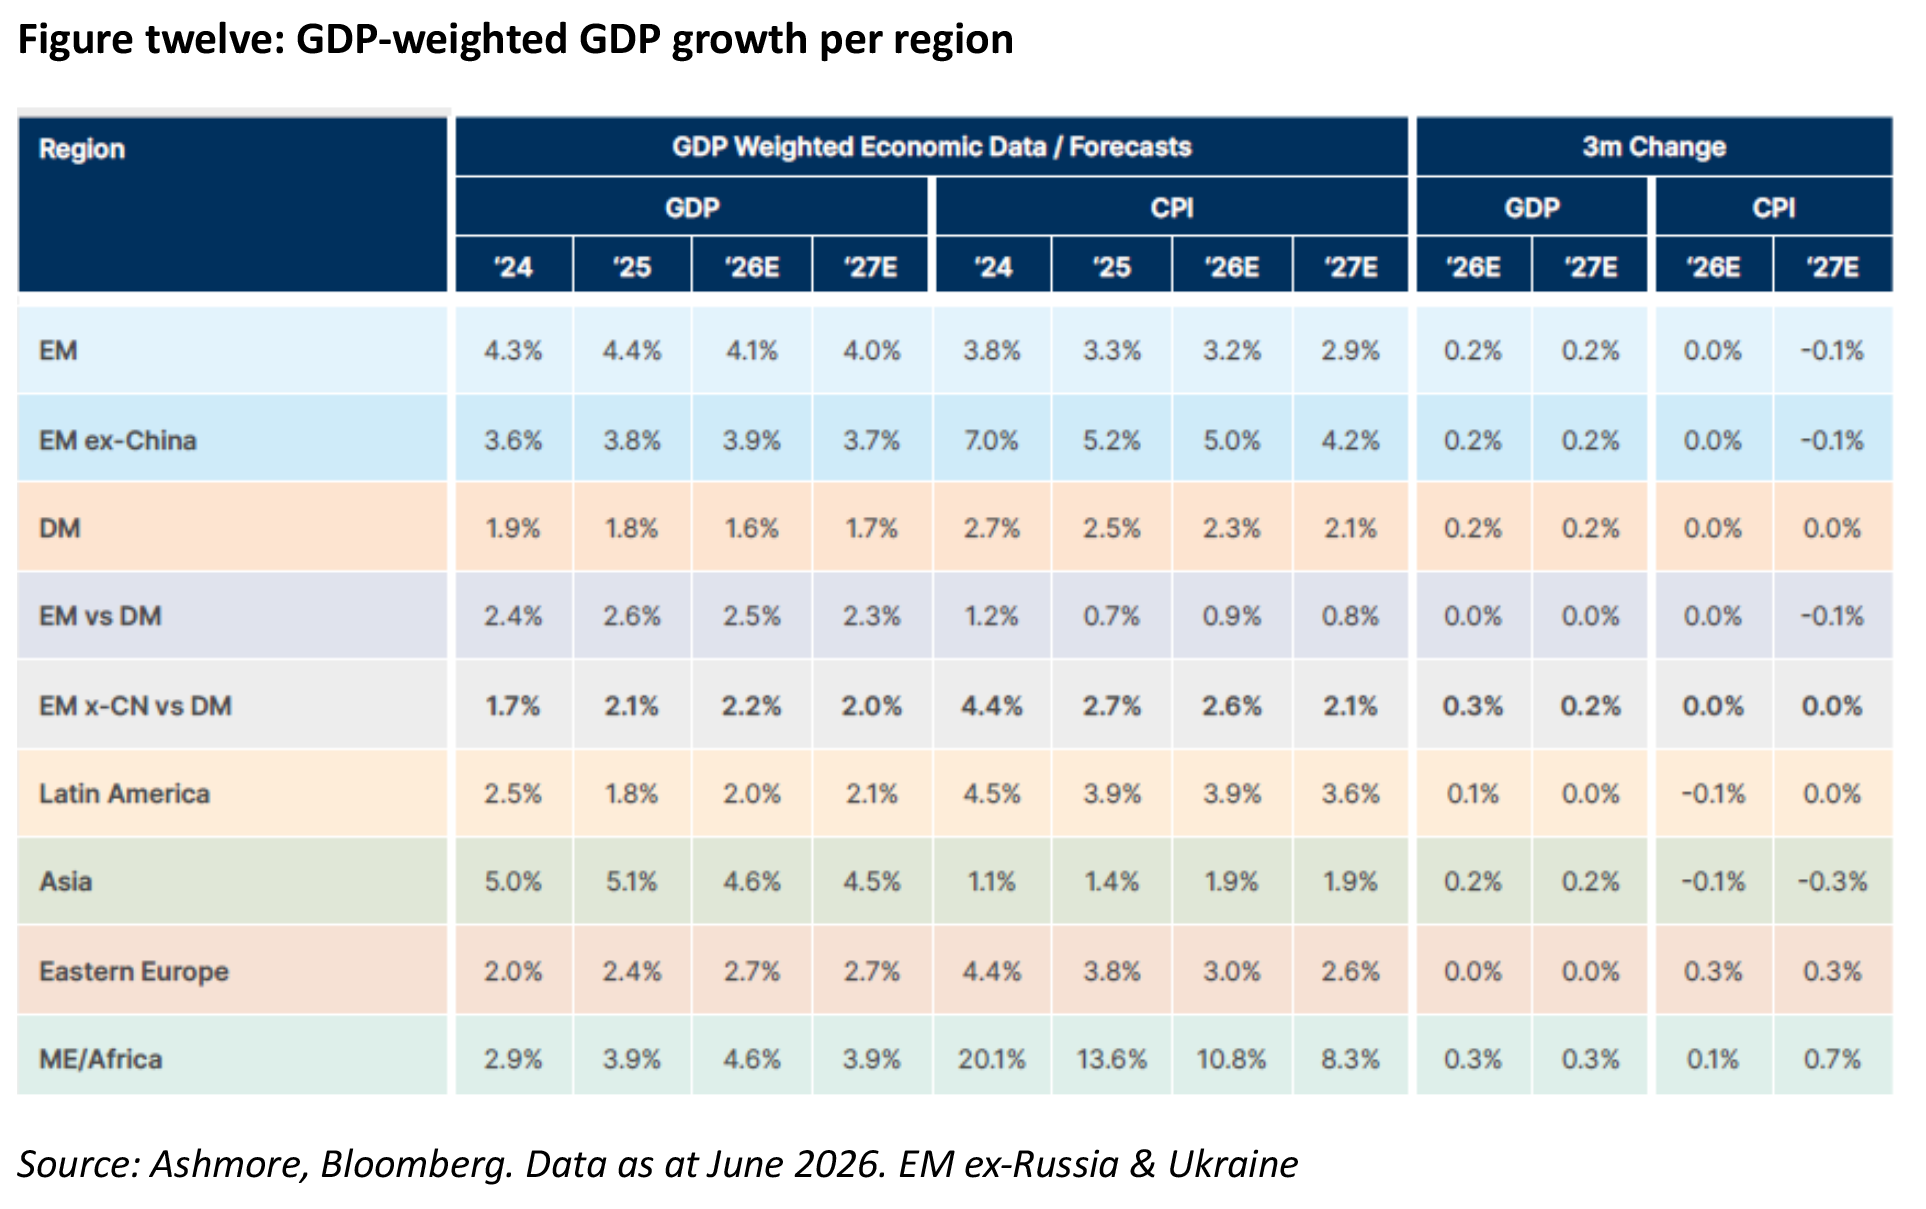
The growth gap between EM ex-China and DMs has been widening, as EM ex-China GDP has continued to rise year after year, whereas DM growth has stagnated or declined, as shown in figure twelve. Both higher growth and better inflation dynamics favour EM. It also shows how the negative impact on growth expectations from the closure of the Strait of Hormuz in EM is already reversing.

Credit risk improvement in EM Against Wider deficits and debts in DM
Frontier economies have been undertaking massive structural reforms, resulting in more upgrades than downgrades across EM, as shown in figure thirteen.
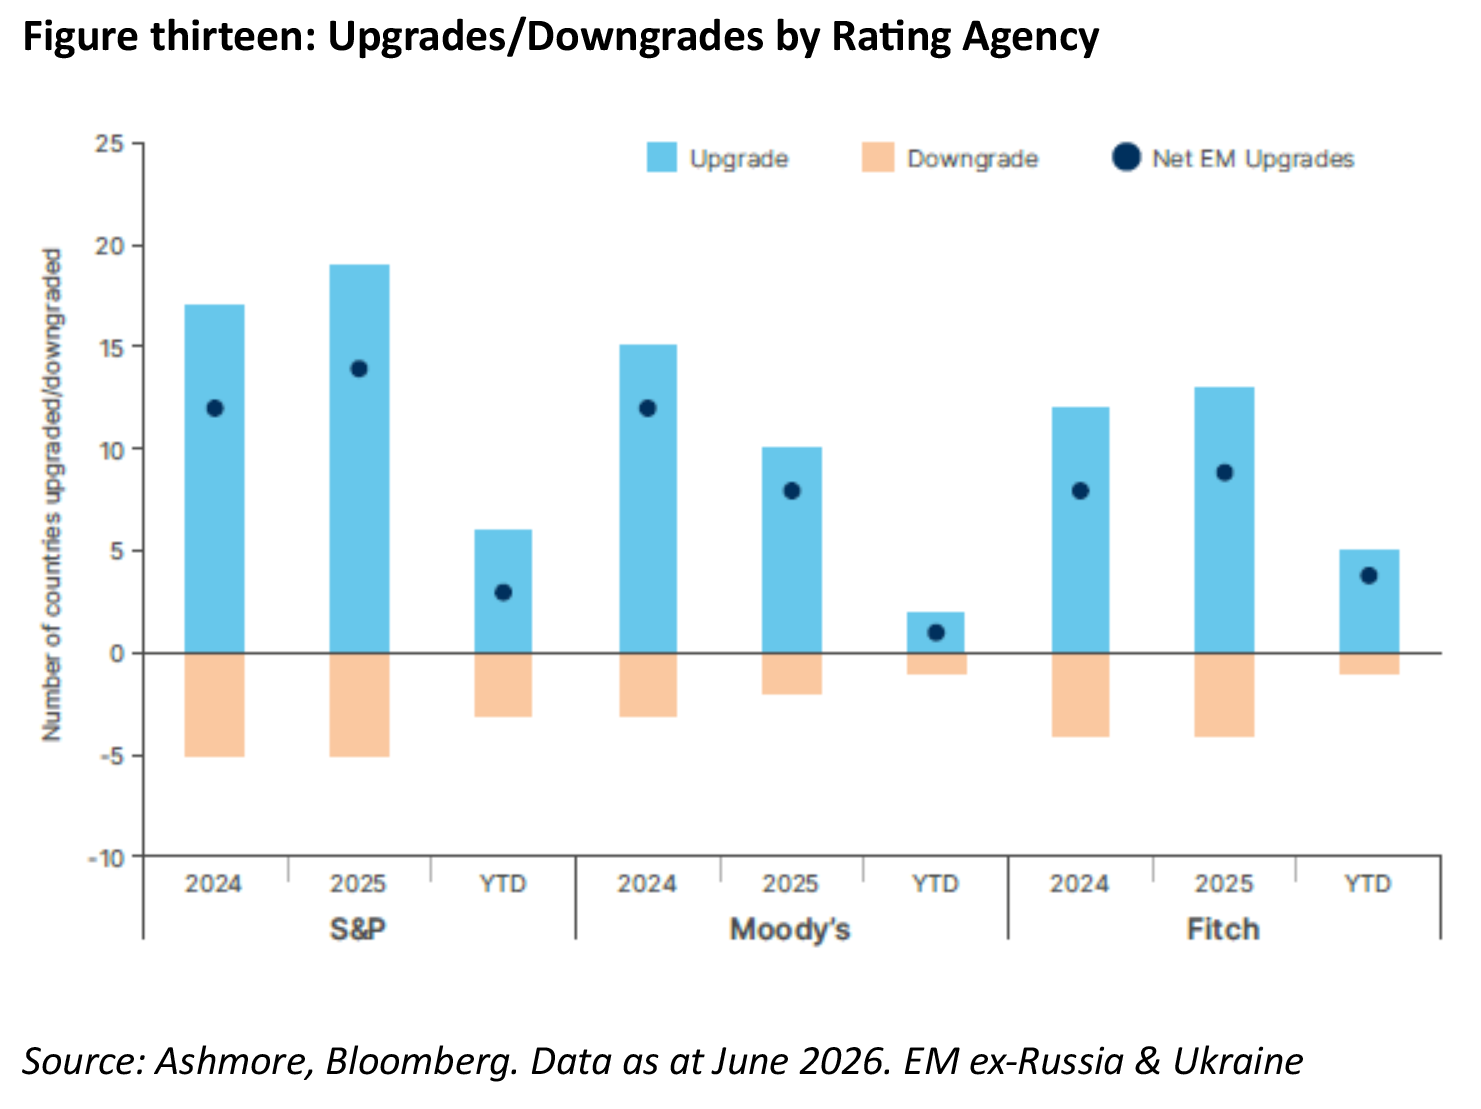

With many more upgrades than downgrades across EM since 2024, Ashmore believes the pipeline remains heavily skewed towards future upgrades. Further, Ashmore believes several countries could be upgraded further, including Gabon, Zambia, Argentina, Ecuador, Pakistan, Egypt, Sri Lanka, Ghana and Nigeria among frontier markets, as well as Hungary, Panama, Morocco and Oman in EM. Structural reforms in Chile and Colombia after political transitions there could also lead to upgrades.
5. Valuations: The yields are all-right…
The main argument against credit is that credit spreads are tight. This is true. Historical data suggests spreads over US Treasuries are close to their tightest levels on record. However, four factors can help shape investor perspectives when considering valuations.
- a) Yields remain elevated; defaults are capped by improving fundamentals
- b) US Treasuries are a poor proxy for today’s funding costs
- c) EM credit spreads are still wide compared with US credit and equities
- d) EM equities are undervalued vs US equitied
a) Yields remain elevated and defaults are capped by improving fundamentals
The EMBI GD yield-to-maturity remains elevated, at close to 7.0%, or c. 6.3% after excluding defaulted securities. The asset class has 48% of its assets comprising investment grade securities and yet offers a very similar yield to US corporate high yield, at close to 7.0% as per figure fourteen.
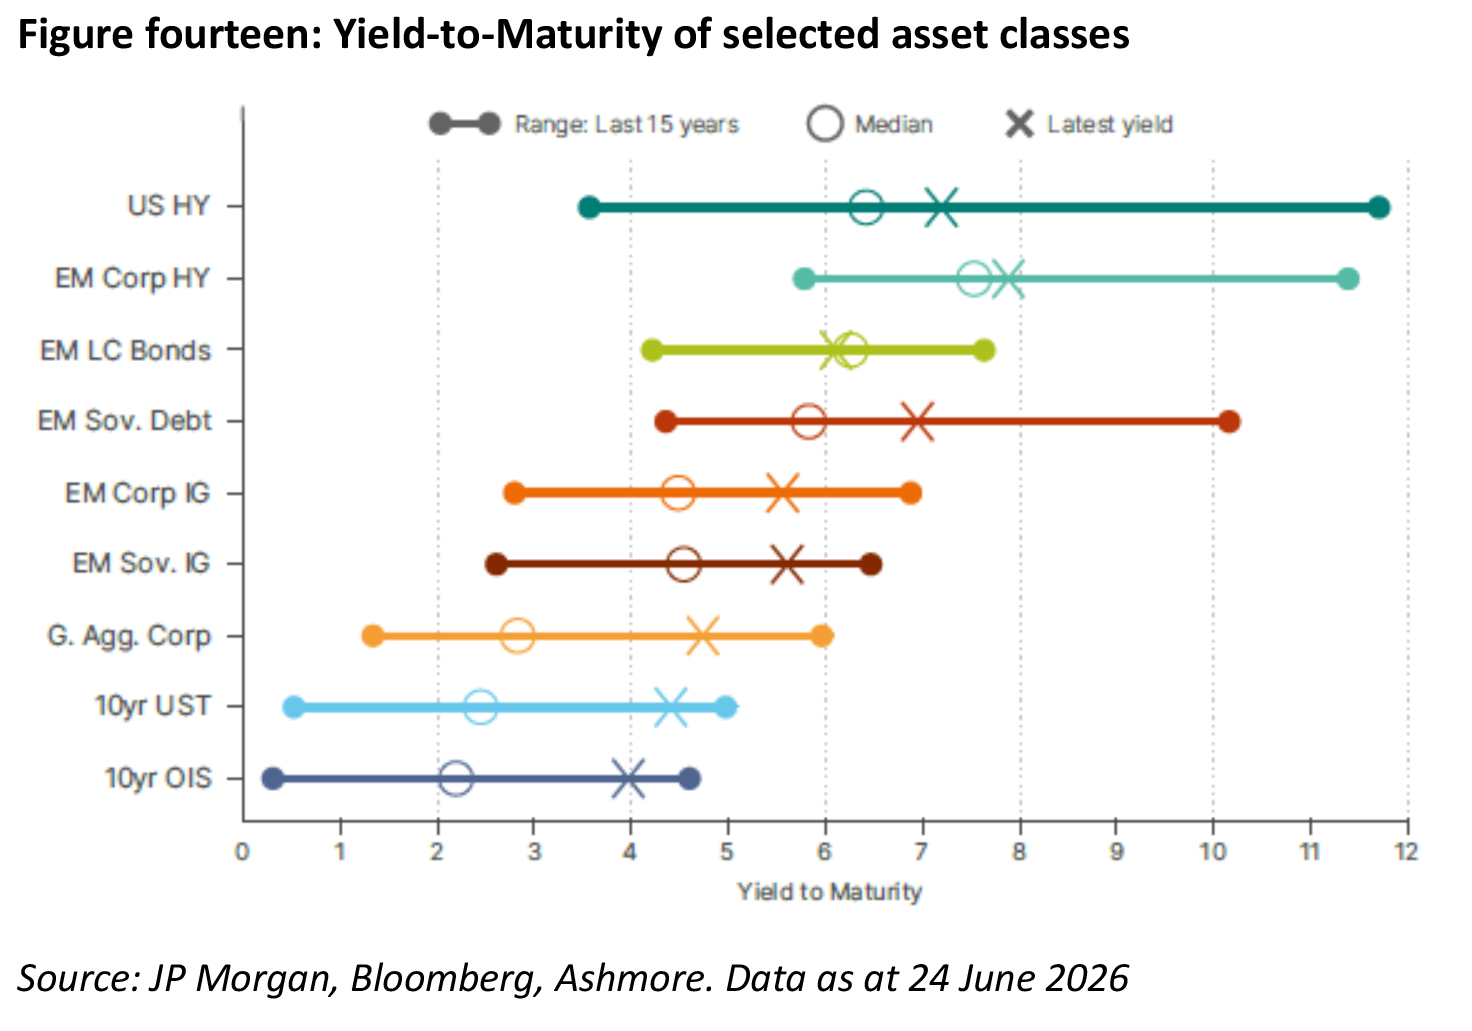

At the same time, default rates dropped to zero over the last three years after the wave of restructurings over 2020-2022. Average default rates tend to be low, at 2.5% over ten years and 1.3% over 20 years, and the post-default recovery rate tends to be much higher than with US high yield, so the loss given default rate is a lot lower.
b) US Treasuries are a poor proxy for today’s funding costs
US Treasury yields are trading wide to interbank funding rates due to poor technicals and fiscal concerns in the US. Figure fifteen shows that the spread between treasuries and swaps on a portfolio matched to the duration of the EMBI GD is close to its widest level since 2022.
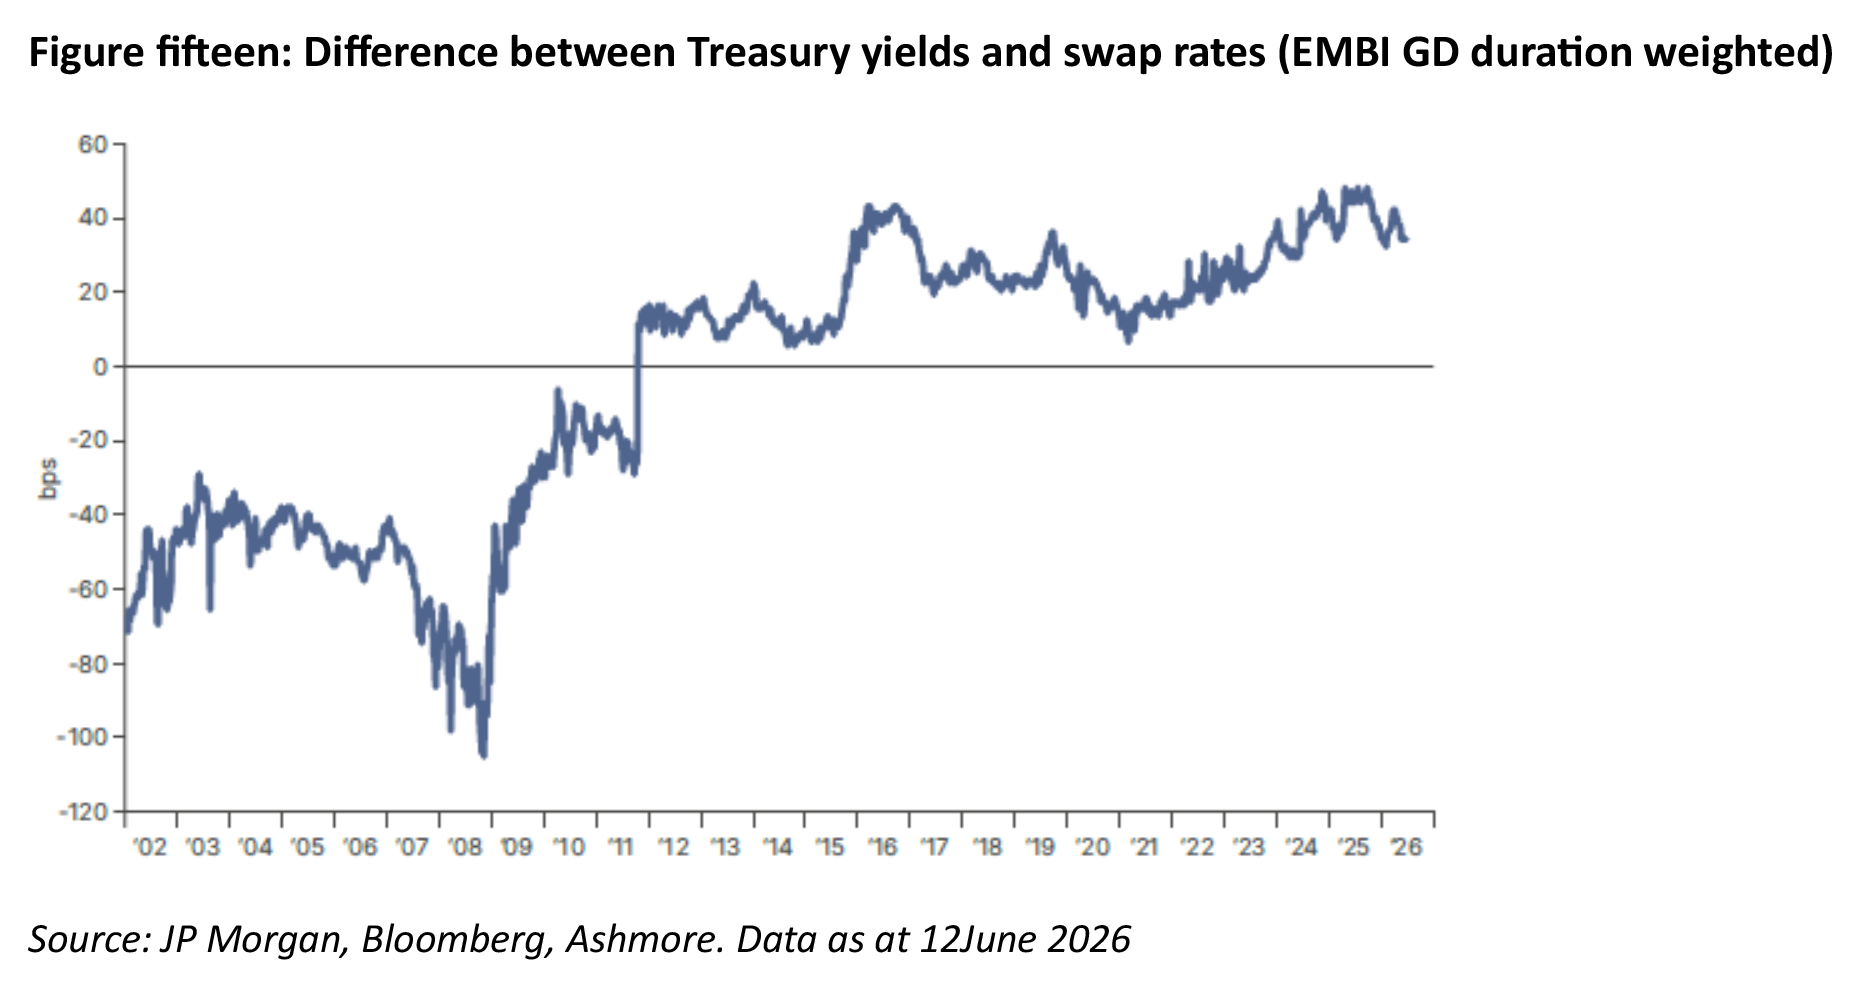

This artificially compresses credit spreads and explains why some high-quality corporates and sovereigns with good technicals can trade below US Treasuries today.
In EM, China’s October 2028 Eurobonds trade 25bps below US Treasuries of the same maturity, close to US swaps. It would not be surprising to see more high-quality issuers, such as Abu Dhabi and Chile, which currently trade around 25bps wide of US Treasuries, to at some point trade below them.
c) EM credit spreads are still wide compared with US credit and equities
The ratio of EMBI high yield to US high yield spreads stands at 1.43, above its median of 1.29 since 1998. This ratio peaked in Q4 2024 and since then has been trading lower, as shown in figure sixteen. Given the very tight level of US spreads and the improvement in EM fundamentals, a full convergence over the next years looks plausible, to us. EM also traded tight to US high yield between 2005 and 2013. If EM fundamentals continue to improve, this pattern could re-emerge.
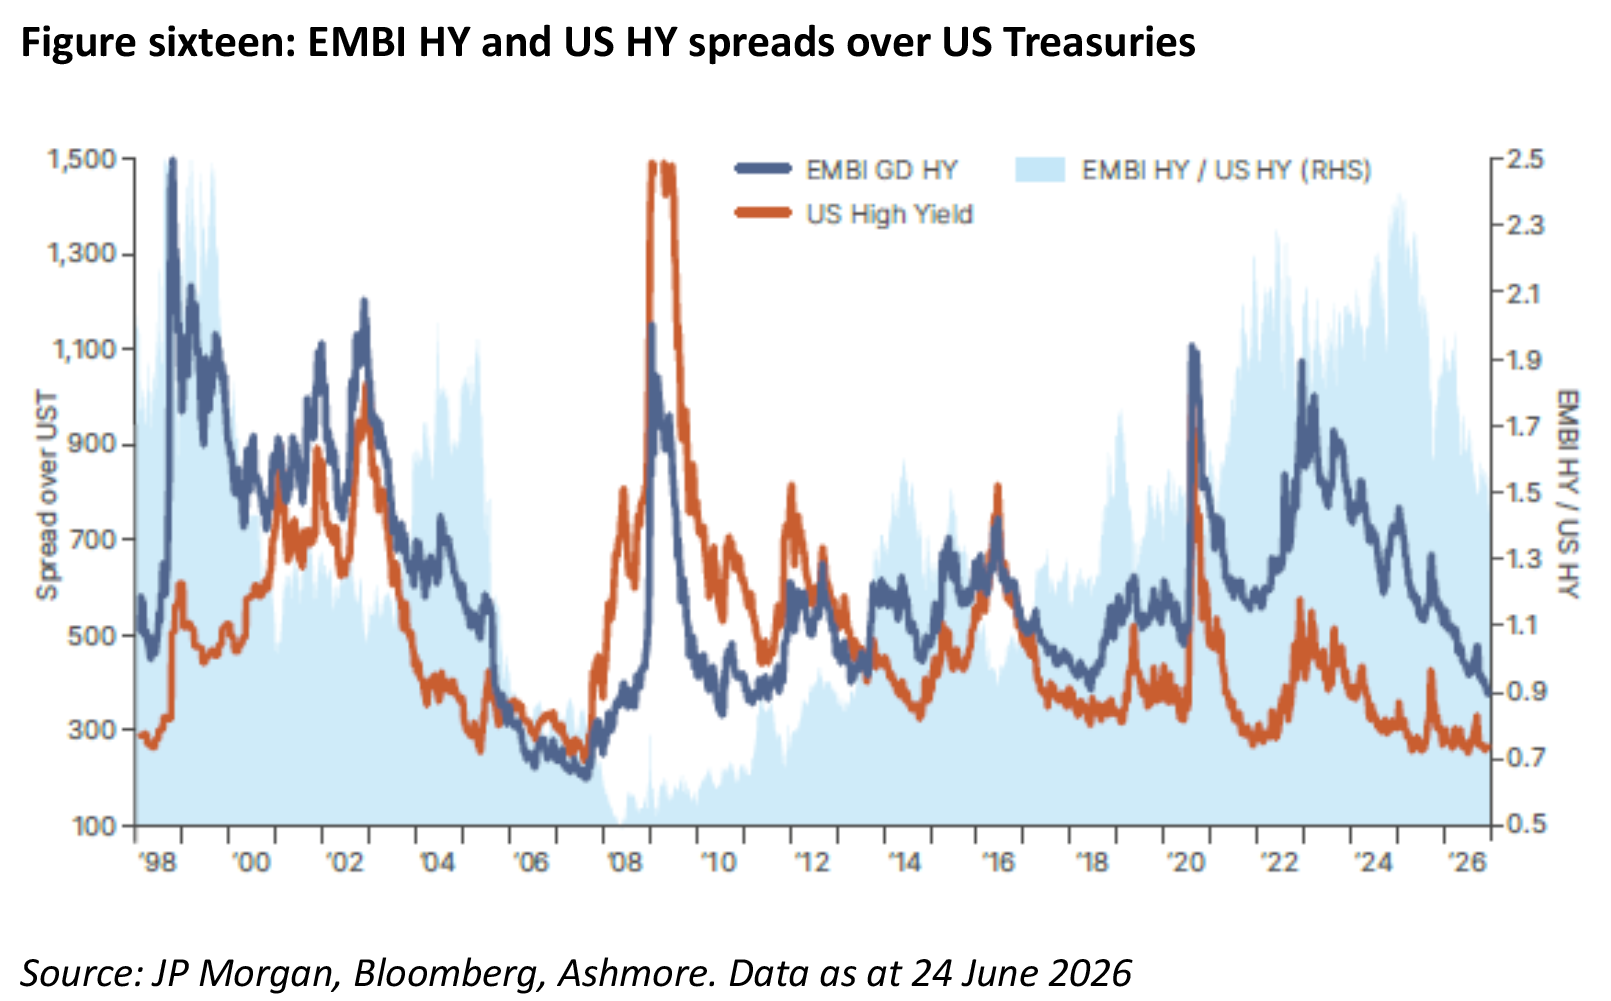

EM investment grade sovereigns also trade marginally wider than their US counterparts. While it is unlikely that much spread tightening can happen from current levels, elevated yields still make carry attractive in a segment of the asset class where defaults are minimal.
Higher total return opportunities remain in high yield, where EM fundamentals have been improving the most. Of the 50 upgrades since 2024, 16 came from ‘C’ and ‘B’ rating levels, 14 in the ‘BB’ space, and five companies upgraded from ‘BB’ to investment grade. The other 15 countries were ratings upgrades from IG companies.
On the other hand of the 13 downgrades since 2024, seven happened within IG (China, Colombia, Mexico, Slovakia, Panama, and Peru), a single downgrade from IG to ‘BB’ (Panama, who kept IG on other two rating agencies after reforms), three downgrades within ‘BB’ (Colombia) and two downgrades within the ‘B’ space (Bahrain).
d) EM equities undervalued vs US equities
The other relative value argument in favour of the asset class is its comparison to US equities, which remain the largest asset class for most global investors.
The gap between the EMBI yield-to-maturity and the S&P 500 earnings yield has only been materially wider than today during the 1998-2001 period, when US equity multiples were elevated and EM debt was undergoing a series of major balance of payment crises, including the aftermath of the 1997 Asian financial crisis, the 1998 Russian default and the 2001 Argentine default.
With the EMBI yielding 6.93% and the S&P 500 earnings yield at 3.69%, the gap stands at 3.24%, which is 1.4 standard deviations above the 20-year median of 0.88%. It is also around 0.7 standard deviations above the median since 1997, when the EMBI yield-to maturity data series began.
Of course, this comparison is imperfect. Equities have a much larger element of uncertainty because they discount a future path of earnings growth. The earnings yield is the inversion of the price-to-earnings (P/E) ratio, and there is little relationship between the P/E ratio and short or even medium-term returns. However, over ten-year horizons, returns have tended to be lower when P/Es are elevated, and vice-versa.
The case for EM debt
There are several reasons advisers might consider an allocation to emerging markets debt:
A supportive macro backdrop – the Strait of Hormuz crisis remains a disruption but is unlikely to be a structural break. Inflation has peaked and real wages are recovering, setting up conditions for a Goldilocks resumption in late 2026 and early 2027. The capex supercycle anchored in AI, defence, energy and supply chain reorientation continues to support global growth and materially reduces the probability of recession, the single greatest risk to EM credit spreads.
Improving fundamentals, both absolute and relative to DM – rating actions have skewed toward upgrades rather than downgrades. EM central banks have lowered inflation targets and built stronger credibility, while fiscal deficits have narrowed across frontier markets. At the same time, governance in several key developed economies has deteriorated, reducing the risk premium EM has historically carried relative to DM.
Valuations are more attractive than headline spreads suggest – credit spreads are tight by historical standards, but yields remain elevated at close to 7%, an attractive carry compared with most developed market assets. Spreads also still offer relative value against US high yield debt, sitting above their long-run average. And against US equities, EM sovereign debt is the most attractively valued it has been in over two decades.
Demonstrated resilience under stress – when the Middle East conflict began this year, spreads widened only modestly and retraced quickly, suggesting the asset class is less fragile than in past cycles.
A diversifier for the 60/40 portfolio – many advisers have shifted client allocations toward gold, commodities and other uncorrelated assets after a difficult stretch for bonds. EM sovereign debt offers a comparable or better long-term total return profile with lower volatility, and unlike gold, it pays income.
Strong credit quality and structural under-ownership – the default rate has been near zero over the past three years, recovery rates post-restructuring are improving and a wave of frontier market upgrades is still in progress. Despite this, the asset class remains structurally under-owned by global allocators relative to its risk-adjusted return history.
Taken together, there is a solid case for treating EM debt as a long-term core allocation rather than a tactical trade, particularly for advisers looking to diversify client portfolios geographically and by asset class while maintaining a reasonable income stream.
Take the FAAA accredited quiz to earn 0.75 CPD hour:
CPD Quiz
The following CPD quiz is accredited by the FAAA at 0.75 hour.
Legislated CPD Area: Technical Competence (0.75 hrs)
ASIC Knowledge Requirements: Fixed Interest (0.75 hrs)
please log in to start this quiz
———–
Notes:
[1] https://www.ashmoregroup.com/en-apac/insights/webinar-emdebt-7jul26
[2] See Gilchrist, S. & Zakrajšek, E. (2012). Credit Spreads and Business Cycle Fluctuations; Meeks, R. (2012). Do credit market shocks drive output fluctuations? Evidence from corporate spreads and defaults: Tang, D. & Yan, H. (2010). Market conditions, default risk and credit spreads; Bhamra, H., Dorion, C., Jeanneret, A. & Weber, M. (2018) Low Inflation: High Default Risk and High Equity Valuations; Gilchrist, S., Yankov, V. & Zakrajšek, E. (2009) Credit market shocks and economic fluctuations: Evidence from corporate bond and stock markets.
[3] EMBI GD stands for the J.P. Morgan Emerging Market Bond Index Global Diversified, a widely used benchmark tracking total returns on USD-denominated sovereign and quasi-sovereign bonds issued by developing countries.
[4] 5y5y (5-Year, 5-Year Forward Inflation Expectation Rate) represents the market’s expectation of the average inflation rate over a five-year period, starting exactly five years from today
[5] See – https://www.dallasfed.org/research/papers/2025/wp2511
Important information: Past performance is not an indicator of future performance. Investors should consider certain risk factors peculiar to investing in Emerging Markets (EM), before taking any investment decision. EM carry risks as well as rewards. The information included in this article is provided for informational purposes only. Sources for the material contained in this article are deemed reliable but cannot be guaranteed. We do not represent that this information is accurate and complete, and it should not be relied upon as such. Any opinions expressed in this material reflect our judgment at this date, are subject to change and should not be relied upon as the basis of your investment decisions. All reasonable care has been taken in producing the information set out in this article however subsequent changes in circumstances may occur at any time and may impact on the accuracy of the information. Neither Ashmore Investment Management, PAN-Tribal Asset Management Pty Ltd, their related bodies nor associates gives any warranty nor makes any representation nor accepts responsibility for the accuracy or completeness of the information contained in this article.
CPD Quiz
The following CPD quiz is accredited by the FAAA at 0.75 hour.
Legislated CPD Area: Technical Competence (0.75 hrs)
ASIC Knowledge Requirements: Fixed Interest (0.75 hrs)
please log in to start this quiz