In his last CPD article for 2012, Ray Griffin explains why portfolio asset allocation models in the 20 teens should be substantially different to those of the 1990s and pre-GFC era. While he argues for change in portfolio allocations he also cites evidence of a key, unchanging, portfolio income fundamental.
‘Change my way of thinking’ ; but hold the ‘bath water’!
It’s easy to think that building investment portfolios was a lot easier in the 90s. While markets gyrated with substantial volatility at times in that decade, well-constructed portfolios rode the rising tide of global economic growth pumped along by easier credit and the gradual emergence of large economies like China from centuries of economic hibernation.
Domestically, it was a decade of falling inflation and a (overall) rising share market. Businesses heeded the lessons of late 1980s excessively debt laden balance sheets; focused on constraining costs and thus delivered more EBIT to share holders via dividends. A pattern that, save for the listed property trust sector in the lead up to the GFC, has largely held true to the present time.
In considering portfolio construction for the present time, it’s instructive to reflect on some of the major financial events of the 90s:
Rock and roll!
• 1990/91 Recession in Australia (the last ‘official’ recession for Australia)
• 1990 Official cash rates at 18 % p.a.
• 1990 Collapse of the unlisted property trusty sector
• 1990 Corporate ‘high flyer’ collapses (Alan Bond – Christopher Skase et al)
• 1990 August, Iraq invasion of Kuwait = plummeting global share prices + skyrocketing oil prices
• 1991 Gulf War
• 1993 36% total return for the All Ordinaries Index
• 1994 Global bond market crash
• 1997 South East Asian currency crisis
• 2000 The bursting of the ‘Dot Com’ bubble
It was a very bumpy ride at times however those events notwithstanding, generally speaking, portfolios which had some exposure to Australian and international shares did quite well over the decade.
At a time when two decades of 10% per year average Consumer Price Index (1970-1990) was still echoing in the back of the cash register, it wasn’t that difficult for investors to derive capital growth and a reasonable income.
Interest rates were very high by today’s conditions and exorbitantly high at the start of the 90s. Dividends were commensurate with today’s and property rental yields were generally above (excluding residential) 6% p.a.
For retirees, a well-designed, strategically balanced, portfolio could deliver what they needed – an income stream with the potential to grow over time and, for that peace of mind factor, a portfolio which could increase in value. There were times when it seemed (to the untrained eye) that all you had to do was put money in shares and you could ‘bank’ on it making capital gains. Witness that the All Ordinaries Index had moved from 1650 on 1 January 1990 to 3152 by 1 January 2000.
Roll on through to the 20 teens and it’s a different ball game.
Same but different!
While the underlying fundamentals will always be the same i.e. only assets that can appreciate in value (such as shares and property) can deliver portfolio growth, the tactical application of such assets into portfolios is substantially different to the 90s.
The conflicted dynamics of debt-laden sovereign balance sheets (which act as both an economic and fiscal brake on a very large proportion of the global economy) versus the powerhouse, capital intensive, growth of the recent past in China and India, makes portfolio construction nowhere near as ‘bankable’.
Change all stations
As early as 2004 if advisers and fund managers were taking the time to find and then analyse the data, it was abundantly evident that what was coming down the economic pipeline in the United States was the harbinger of bad investment news.
Prudent portfolio management should have reduced allocations to international shares and within that reduced exposure to US shares. Note that at the time, it was very common that international fund managers would ‘track the Miski’ (the Morgan Stanley Capital Index).
Such MSCI replication saw fund manager allocations of up to 60% of an international fund to US shares simply because the US market then represented around 55% of the capitalisation value of world share markets. The GFC was proof positive that index tracking has its drawbacks!
The available data evidenced that it would take at least a decade for the looming crisis to be washed through the global economy. It meant that from then on there had to be an even greater focus on generating income – even for younger clients because in the absence of reliable portfolio growth at least consistent, tax efficient, income could be accumulated in their portfolios for reallocation into longer-term assets.
Yet identifying investments that can generate, with reasonable reliability, consistent and competitive income – without too much risk – is quite difficult.
In this regard, one of the most overlooked portfolio construction aspects is the long-term increase in share dividends and it might be tempting for advisers to ‘throw the baby out with the bath water’.
Divide(nd) and conquer!
Explaining the long-term benefits of share price growth is relatively easy compared to explaining what many regard as the most attractive aspect of owning a share of a business – the growing value of the profit dividend.
Many investors and perhaps some advisers have difficulty in appreciating why dividends are the big winner for long term shareholders – for too many, it’s all about share price increases
Future dividends – in dollar terms – should represent a higher percentage (proportion) of the original price paid for the share. That is, the value of a dividend from a well-run business in 2022 should be higher than it is in 2012.
Following is an example of the changing value of a dividend over time. This matrix details the full year dividends for the 2002 and 2012 financial years for Woolworths Ltd (WOW):


Some observations:
• The dividend has increased by around 4 times over the 10 years
• The 30 June 2012 share price is around 2 times what it was on 30 June 2002
• For the investor who bought WOW shares on 30 June 2002, the 2012 dividend now represents a 9.43% income return on their original investment ($1.24/$13.15 x 100)
Let’s be very clear here: not every business will produce such results and the truth is from time to time businesses fail completely or fail to achieve meaningful financial growth. Investors can lose some or all of their money in such businesses. However, the point is that as an economy grows and the dollar value of profits increases over time, the dollar value of dividends – from well-managed companies – rises.
Following is a chart that details five companies, including WOW:
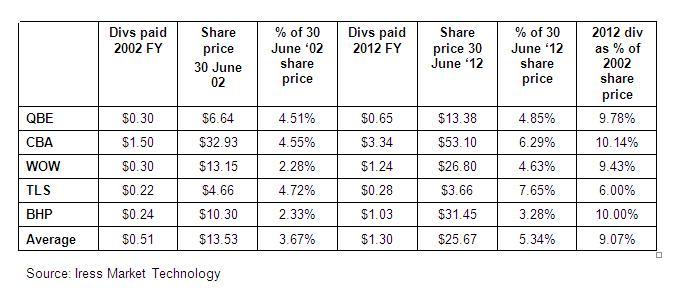

There is generally speaking a pattern of share price increases and dividend increases. For the notional average price of $13.53 on 30 June 2002 this ‘investor’ in 2012 received a dividend of $1.30 – 9.07% of the original investment. Almost as a bonus, the investor can derive some comfort that the average share price has risen substantially.
Some things do change while the (dividend) song remains the same
In an era when 1990s and early 2000s type capital growth in share investments will be primarily missing in global debt reduction action, advisers need to keep a trained eye on the substantial benefit of rising dollar dividends over time from shares. Successful portfolio construction techniques in the 20 teens are different to the 1990s and will be for some time.
While dividend growth will be impacted by slower global conditions for some time, good advice will account for such changing dynamics of global markets while simultaneously recognising unchanging fundamentals such as the value of dividends over time.
Note: The accreditation for this CPD article is no longer current. Please visit our CPD section for current CPD quizzes.