How are Australia’s states and territories performing? Each quarter CommSec attempts to find out by analysing eight key indicators: economic growth; retail spending; equipment investment; unemployment; construction work done; population growth; housing finance and dwelling commencements.
Just as the Reserve Bank uses decade averages to determine the level of “normal” interest rates; we have done the same with the economic indicators. For each state and territory, latest readings for the key indicators were compared with decade averages – that is, against the “normal” performance.
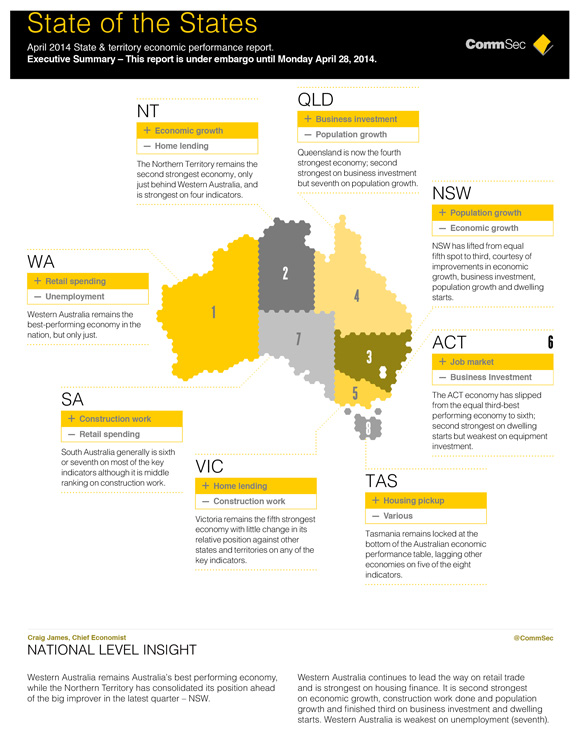
Western Australia remains the top-performing economy in the nation, but only just, ahead of the Northern Territory and NSW. NSW has been the big improver, up from fifth to third.
The ACT has been pushed back from the third-best performing economy to sixth, behind Queensland and Victoria. There is then a gap to South Australia and another gap to Tasmania with both states still under-performing other economies.
Western Australia comes out on top on only two of the eight criteria – retail spending and housing finance. Western Australia is now second on three indicators, third on two indicators and seventh on unemployment.
The Northern Territory has consolidated second place with the main improvements occurring in business investment. NSW jumped from fifth to third-best performing economy due especially to top rankings on population growth and dwelling starts.
Western Australia clings to top spot from Northern Territory & NSW.
Western Australia remains Australia’s best performing economy, while the Northern Territory has consolidated its position ahead of the big improver in the latest quarter – NSW.
Western Australia continues to lead the way on retail trade and is strongest on housing finance. It is second strongest on economic growth, construction work done and population growth and finished third on business investment and dwelling starts. Western Australia is weakest on unemployment (seventh).
The Northern Territory remains the second strongest economy, and only just behind Western Australia. The main strengths are economic growth, business investment, unemployment and construction work. The Northern Territory is now second strongest on retail trade. But it also is in last place on housing finance.
New South Wales has lifted from equal fifth spot to third, courtesy of improvements in economic growth, business investment, population growth and dwelling starts – on the latter two indicators it leads other states and territories.
Queensland is now the fourth strongest economy, but largely because the ACT has slipped down the leader-board rather Queensland improving its position on some of the key indicators. Queensland is second strongest on business investment but seventh on population growth.
Victoria remains the fifth strongest economy with little change in its relative position against other states and territories on any of the key indicators. Victoria is second strongest on housing finance and third strongest on population growth.
The ACT economy has slipped from the equal third-best performing economy to sixth. While the Territory is second strongest on dwelling starts and unemployment, it is the weakest on business investment and construction work and its relative position on population growth and construction work have weakened markedly.
There remains a sizeable gap in the rankings to South Australia and then another gap to Tasmania. South Australia generally is sixth or seventh on most of the key indicators although it is middle-ranked on construction work, assisted by a number of public sector projects.
Tasmania remains locked at the bottom of the Australian economic performance table. Tasmania lags other economies on five of the eight the indicators although it has improved its relative position on unemployment and business investment.
How was performance judged?
Each of the states and territory economies were assessed on eight key indicators: economic growth; retail spending; equipment investment; unemployment, construction work done; population growth; housing finance and dwelling commencements.
The aim was to find how each economy was performing compared with “normal”. And just like the Reserve Bank does with interest rates, we used decade-averages to judge the “normal” state of affairs. For each economy, the latest level of the indicator – such as retail spending or economic growth – was compared with the decade average.
While we also looked at the current pace of growth to look at economic momentum, it may yield perverse results to judge performance. For instance retail spending may be up sharply on a year ago but from depressed levels. Overall spending may still be well below “normal”. And clearly some states such as Queensland and Western Australia consistently have faster economic growth rates due to historically faster population growth. So the best way to assess economic performance is to look at each indicator in relation to what would be considered ‘normal’ for that state or territory.
For instance, the trend jobless rate in the ACT of 3.4 per cent is lower than all economies. But this jobless rate is broadly in line with its ‘normal’ or decade-average rate of 3.4 per cent, whereas the jobless rate in Northern Territory is just over 12 per cent below its decade-average level.
Trend measures of the economic indicators were used to assess performance rather than more volatile seasonally adjusted or original estimates.
Economic growth
Ideally gross state product (GSP) would be used to assess broad economic growth. But the data isn’t available quarterly. Rather state final demand (household and business spending) is added to exports less imports to act as a proxy for GSP. Exclusion of the trade sector would provide an incorrect assessment of growth for economies such as Western Australia and Queensland.
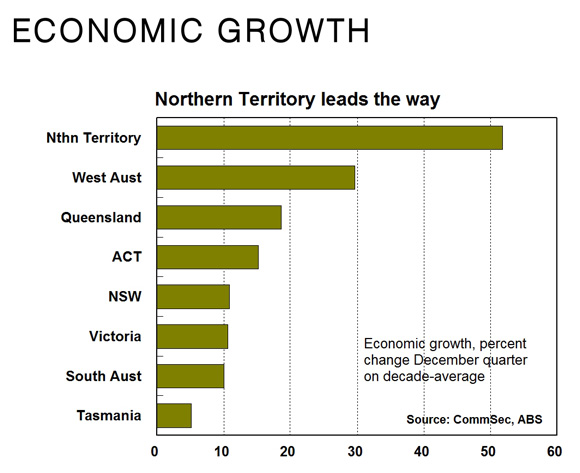
The Northern Territory continues to lead the rankings on economic activity. Activity in the ‘top end’ is almost 52 per cent above its ‘normal’ or decade-average level of output.
Next strongest is Western Australia, with output around 30 per cent higher than the decade average level of output. Then follows Queensland (up 18.6 per cent) from the ACT (up 15.2 per cent).
At the other end of the scale, economic activity in Tasmania in the December quarter was just 5.1 per cent above its decade average while South Australian activity was up 10.0 per cent on its “normal” or average output over the past decade.
There would be no change in the rankings if “final demand” was used instead, providing added confidence about the results achieved.
The Northern Territory also maintains the fastest annual economic growth rate in the nation, up by 11.5 per cent on a year ago, ahead of Queensland with 4.1 per cent and NSW (3.0 per cent).
The weakest trend annual economic growth rate was recorded in Victoria (1.7 per cent) followed by Western Australia (1.8 per cent) and Tasmania and ACT (both up 2.0 per cent on a year ago).
Retail trade
The measure used was real (inflation-adjusted) retail trade in trend terms with December quarter data the latest available.
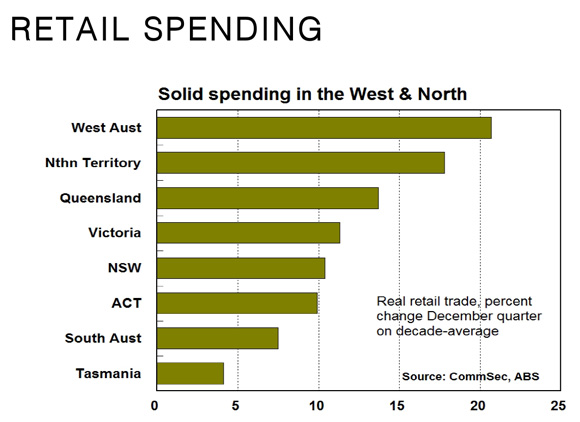
Western Australia retains top spot on the retail rankings with spending in the December quarter just over 20 per cent above decade average levels. Solid population growth, solid turnover of existing homes and higher wages underpins the relative strength in consumer spending.
Northern Territory was next strongest, supported by lower-than-normal unemployment, with spending 18.0 per cent above decade-average levels.
Queensland was next strongest, with spending 13.7 per cent above decade averages, followed by Victoria (up 11.3 per cent).
Tasmania still maintains the weakest result on retail spending, up just 4.1 per cent on the decade average (but up from 2.6 per cent in the September quarter), and below South Australia with growth of 7.5 per cent.
If monthly retail trade was assessed instead (February data available), there would be no change in the relative performance rankings, which is quite remarkable.
In terms of the monthly retail trade series, encouragingly Tasmania is 9.2 per cent higher than a year ago, ahead of NSW with 7.7 per cent growth, Victoria with 6.8 per cent growth, Northern Territory with 5.8 per cent growth, South Australia, up 4.9 per cent. At the other end of the scale, ACT spending was up just 2.4 per cent on a year ago with Western Australian spending up 2.6 per cent, suggesting the two economies may slip further in next quarter’s economic performance rankings.
Equipment investment
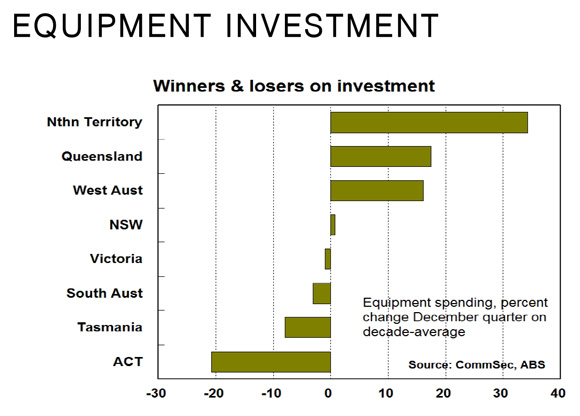
Northern Territory now leads other states and territories when it comes to equipment investment, moving up from third-strongest to the top spot. Spending in the December quarter was over 34 per cent above “normal” – or decade-average levels. Mining investment still remained relatively strong across the resource states. Equipment investment in Queensland is now 17.5 per cent above decade-average levels followed by Western Australia (up 16.1 per cent) and NSW (up 0.7 per cent).
By contrast, new equipment spending in the ACT was 20.8 per cent below its longer-term average in the December quarter with Tasmania down 8 per cent.
On a shorter-run analysis, equipment investment in the December quarter was lower than a year ago in all of the state and territory economies except Northern Territory (up 38.1 per cent). Equipment investment is down most on a year ago in the ACT (down 40.7 per cent), followed by Western Australia (down 29.3 per cent). By contrast new equipment investment in South Australia was down by just 1.5 per cent and down by 2.9 per cent in both Victoria and Tasmania.
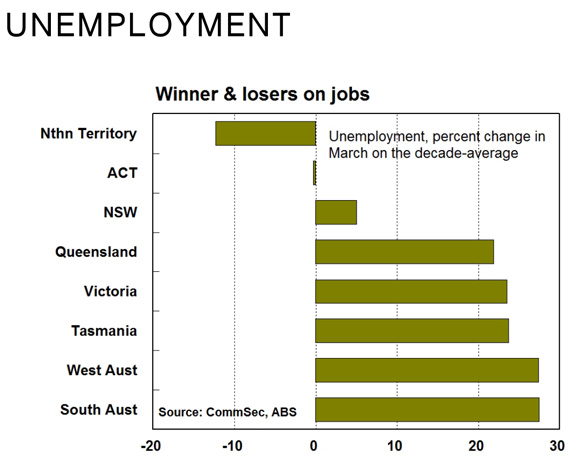
Unemployment
The Northern Territory and the ACT have arguably the strongest job markets in the nation. Northern Territory has the second lowest trend unemployment rate in the nation at 3.8 per cent, but this jobless rate is actually over 12 per cent below its “normal” or decade average level of 4.3 per cent.
Similarly in the ACT, trend unemployment is the lowest in the nation at 3.4 per cent and this rate is just 0.3 per cent below its “normal” or decade average rate level.
In other states, the latest unemployment rates are all above their decade-average levels. In NSW, unemployment stands at 5.5 per cent, up 5 per cent on its normal” or decade-average level of 5.2 per cent.
At the other end of the scale, South Australia’s 6.9 per cent jobless rate is up almost 28 per cent on the decade average level of 5.4 per cent. Interestingly next weakest is Western Australia where its 5.3 per cent jobless rate is just over 27 per cent above the decade-average level. While Tasmania’s jobless rate stands at 7.4 per cent, this is just under 24 per cent above its decade-average level.
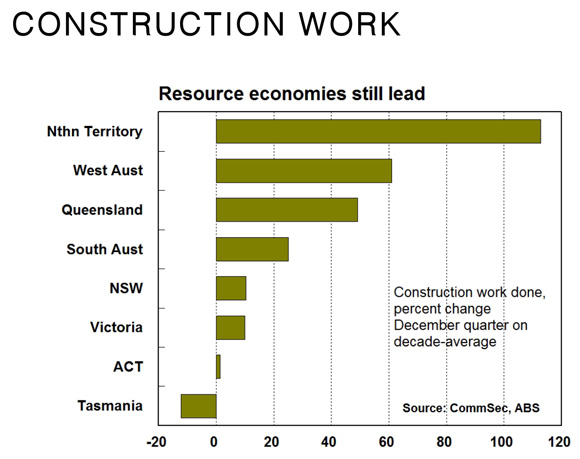
Construction work
The measure used for analysis was the total amount of residential, commercial and engineering work actually completed in trend terms in the December quarter.
In all states/territories except Tasmania construction work is higher than decade averages. And there remains a large gap between the strongest states (the resource states) and weakest states (Tasmania).
In Tasmania, overall new construction work completed is 12.2 per cent below its decade average. By contrast construction work done in Northern Territory was over 112 per cent above its decade average followed by Western Australia (up 60.9 per cent) and Queensland (up 49.2 per cent).
Next weakest to Tasmania is the ACT where construction work is 1.4 per cent above decade averages, followed by Victoria (up 9.9 per cent on the decade average).
In terms of annual growth rates, Northern Territory construction work done in the December quarter was up 34.1 per cent on a year ago, followed by Queensland (up 8.3 per cent) and South Australia (up 5.9 per cent). But at the other end of the scale, ACT construction work was 18.2 per cent down on a year ago.
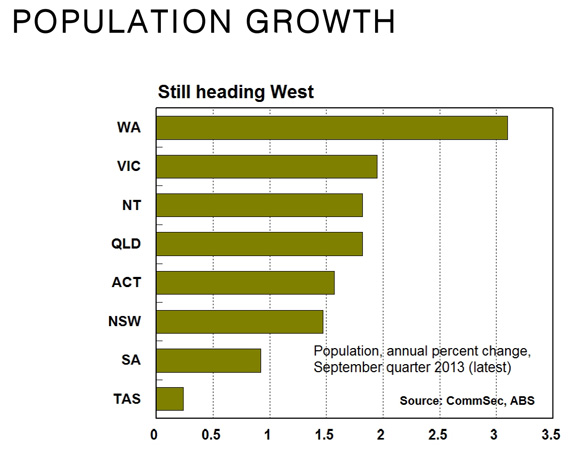
Population growth
To assess population performance we looked at the current annual growth rate and compared it with each economy’s decade-average growth pace. And the good news is that population growth is above ‘normal’ in five states or territories although growth has lifted in only four jurisdictions over the past quarter.
Western Australia is the clear leader in population growth with an annual growth rate of 3.10 per cent. But while NSW has a lower growth rate at 1.47 per cent, this is 31.2 per cent above the decade average. Western Australia’s population growth is 21.4 per cent above the decade average, and below that of NSW.
Victoria is third strongest in annual population growth as well as the differential with the decade average rate. Victoria’s population is up 1.95 per cent higher than a year ago and this growth rate is 19.2 per cent higher than the “normal” or decade-average level.
At the other end of the leader-board is Tasmania where the annual population growth of 0.24 per cent was 67 per cent below the decade average rate of 0.71 per cent but growth did lift in the September quarter from 0.21 per cent.
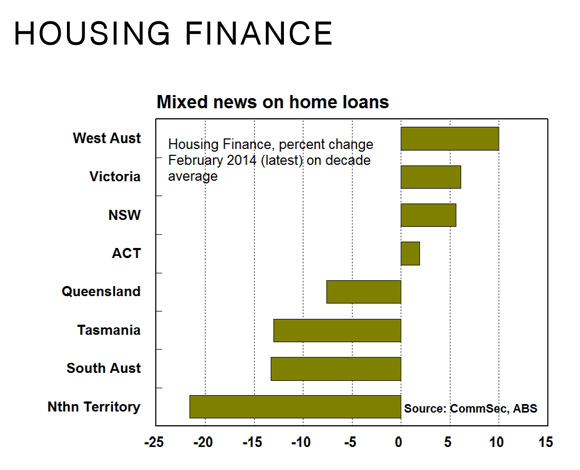
Housing finance
The measure used was the trend number of housing finance commitments and this was compared with the decade-average for each respective state and territory.
Housing finance is not just a lead indicator for real estate activity and housing construction but also is a useful indicator of activity in the financial sector. It would be useful to compare figures on commercial, personal and lease finance, but unfortunately trend data is not available for states and territories.
In four of the states and territories – the Victoria, Western Australia, NSW and the ACT – trend housing finance commitments are above decade averages. Even more encouragingly commitments in February were above year-ago levels in all states and territories, except for the Northern Territory.
Western Australia climbed into top spot for housing finance, with the number of commitments 10 per cent above the long-term average. Next strongest was Victoria, up 6.1 per cent on the decade-average.
NSW remains in third spot on housing finance, up 5.6 per cent on the decade average followed by the ACT (up 1.9 per cent).
Northern Territory remains the weakest economy for housing finance with trend commitments 21.6 per cent lower than its decade average. Next weakest was South Australia with trend commitments down 13.3 per cent on the decade average, but encouragingly commitments were up 8.1 per cent on a year ago.
Dwelling starts
The measure used was the trend number of dwelling commencements (starts) with the comparison made to the decade-average level of starts. Starts are driven in part by population growth and housing finance and can affect retail trade, unemployment and overall economic growth. However any over-building or under-building in previous years can affect the current level of starts.
The outlook for housing construction continues to strengthen, underpinned by low interest rates and strong demand by investors. Dwelling starts are above decade averages in six of the states and territories and starts in five states and territories are above levels of a year ago.
NSW is now the strongest in the nation for new housing construction, with starts just over 39 per cent above decade averages. In addition in the December quarter the number of dwellings started was 18.1 per cent higher than a year earlier.
In second spot was the ACT, with starts almost 29 per cent above decade averages followed by Western Australia with starts up 23.4 per cent on decade averages and Northern Territory, up almost 20 per cent.
At the other end of the scale, Tasmanian dwelling starts were 35 per cent below decade averages, while starts in the December quarter were 3.5 per cent down on a year earlier. Next weakest was South Australia (down 2.2 per cent), Queensland (up 0.8 per cent) and Victoria (up 1.6 per cent).
However encouragingly Queensland starts were 23.7 per cent higher than a year ago with South Australian starts up 21.5 per cent and Western Australian starts up 19.2 per cent.
Other indicators
Real wages were positive in just three of the eight state and territory economies in the December quarter compared with seven economies in the September quarter. Strongest growth was in South Australia at 1.2 percentage points, followed by the ACT and Western Australia (0.1 percentage points).
Even using “underlying” inflation than “headline” inflation, real wages either flat or slightly negative in most economies, putting pressure on retail spending.
But for home owners and buyers, home prices are higher than a year ago in all capital cities, boosting wealth levels. Strongest growth in home prices was in Sydney (up 15.6 per cent) followed by Melbourne (up 11.6 per cent).
At the other end of the scale, home prices in Hobart are up just 0.9 per cent on a year ago while Canberra prices are up just 1.9 per cent.
Implications and outlook
The mining construction boom is over, replaced by the home construction boom. As a result, winners and losers will change across Australia, not just industries but also state and territory economies.
Western Australia continues to lead the rankings of best-performing economies but in the latest quarter there was little to separate it from the Northern Territory economy. Interestingly, while mining is waning as a driver of the Western Australian economy, population growth is not only the highest in the nation but above decade-average levels, providing the economy with momentum in the housing sector.
Momentum in the Northern Territory economy continues to be largely propelled by commercial and engineering construction but is being checked by weaker growth in the housing sector.
In contrast, momentum in the NSW is building, and underpinned by stronger activity in home construction although the upturn for the economy is still in its relative infancy.
Low unemployment is a clear strength for the ACT economy but weak confidence is constraining retail and business spending and future economic performance.
Home construction is still the fundamental plank of support for the Victorian economy although rising unemployment clouds the outlook for the economy.
The outlook remains challenging for the Tasmanian and South Australian economies. The hope is that property investors will soon switch attention away from NSW and Victoria to more affordable housing sectors.