The scale of the slowdown in the nominal growth rate for the service sector is as baffling as it is surprising. It raises the prospect of either a major mismeasurement or a fundamental shift in the workings of the services industries.
Services Sector: Broad Underperformance in Growth Rates
Almost all services sectors—both public and private—have recorded slower nominal spending growth over the past four years relative to trends that were in place prior to the financial crisis period (2007–2010). We can readily point to government budget pressures at the federal, state and local levels over the past several years for the depressed showing by the government services part of the equation. But a similarly obvious cause isn’t apparent for the sluggish growth among private services sectors.
Display 1 provides a detailed picture of the nominal spending trends of the major private services sectors and compares the current cycle growth rate with that of the 1996–2006 period—in other words, the nominal trends that were in place prior to the recession.
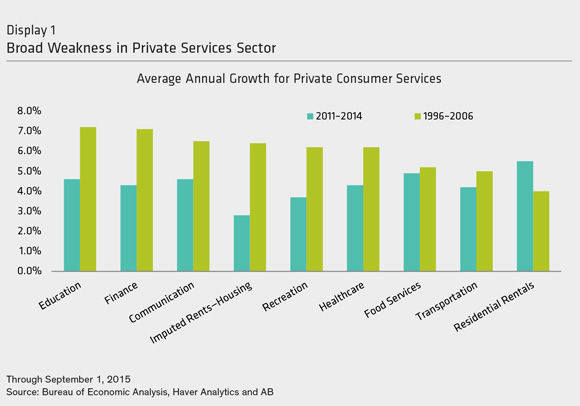

Rents Up, Home Purchases Down
The residential rental (apartment) market is the only private services sector that has seen a faster spending trend in the current cycle. That makes sense because of the structural shift in the housing market. For example, home ownership rates have declined five percentage points—from 68.4% in 2007 to 63.4% in mid-2015, the lowest rate in nearly 50 years. And that, in turn, has reduced the growth in the owneroccupied housing stock (which shows up as slower growth for imputed rents for owner-occupied housing), while at the same time accelerating growth in rents (because of a sharp decline in rental vacancies and a concomitant rise in rental occupancies).
The slower pace of nominal growth in healthcare (off 190 basis points) reflects three factors: slower employment gains (at least in the early part of the current cycle), the cost-shifting burden from businesses to workers for healthcare expenses and slower healthcare inflation.
But the underperformance in education, finance, communication, transportation and recreation (which includes live sports events and motion pictures) is somewhat baffling. The sluggish nominal growth rates in these areas beg the question of whether a fundamental structural shift is occurring in many of these sectors or if there will be a revision at some point.
Accurate Accounting for Tech Advances?
In one of our recent commentaries (“The US Growth Paradox—The Curious Lag in The scale of the slowdown in the nominal growth rate for the service sector is as baffling as it is surprising. It raises the prospect of either a major mismeasurement or a fundamental shift in the workings of the services industries. Services”, August 7, 2015), we raised the idea that the advancement in technology— particularly gadgets with a broad range of functions and applications—has enabled the average consumer to do more things for themselves, such as increase their productivity. And, in the process, this result may have caused a significant bypass of the traditional pay-as-you-go business services model to consumers.
While it’s hard to quantify this possible shift, here are a few things to keep in mind. First, the household sector has seen rapid capital accumulation of technology products. Indeed, household spending on technology equipment has doubled since 2008 and is up tenfold since 2001. In the business world, capital deepening—broadly defined as arming labor with more capital to perform their functions—is highly correlated with improved labor productivity. Could there be a similar outcome in the household sector? In other words, are households armed with new gadgets and functions now doing significantly more tasks for themselves?
Second, new technologies typically require the acquisition of new knowledge. Sometimes, there are long lag times between the initial purchase of the + Joseph G. Carson, US Economist and Director—Global Economic Research, joe.carson@abglobal.com 2 technology and the reaping of the actual benefits. In the business world, using the existing capital stock more efficiently is called multifactor productivity. Is it possible that the introduction of the smartphone is now starting to significantly improve household productivity? After all, these devices combine the function of a traditional cell phone with an operating system of a computer, and they allow consumers to do a number of functions, such as bank, shop, book travel, watch movies, read books and newspapers, listen to music, and communicate to others domestically and globally… and often for free.
Household Production Isn’t Part of GDP
Following our initial commentary last month, we received some insights concerning gross domestic product (GDP) calculations from Robert Parker, former chief statistician and associate director of the Bureau of Economic Analysis. He pointed out that as households do more things for themselves, “household production increases, which isn’t in GDP, and that reduces business output and GDP.”
Parker also noted that “for-free innovation products’ GDP is understated.” And it’s understated because we don’t know how to price (or quality adjust) smartphones. This issue is something we’ve raised in past commentaries (see “The Productivity Paradox: Is Innovation Mispriced?” March 20, 2015, and “The Productivity Paradox Part 2: Is Innovation Mispriced (and Missing),” April 2, 2015).
Operating Margins Offer a Clue So where do we stand?
We agree with Parker that innovation is either miscalculated or not fully captured in the GDP statistics. The best evidence to support that claim is that real operating margins for nonfinancial companies have now remained above 14% for four consecutive years, a trend that was last duplicated in the early 1960s. Clearly, companies have gained economic efficiency in recent years, and the improved efficiency has been apparent whether payroll job growth has been weak or strong.
One example of innovations that are not yet part of GDP has to do with computer storage device manufacturing and the US Federal Reserve Board’s new output figures. By using quarterly data from IDC on revenue and factory shipments for more than 700 models from 2002–2014, the Fed’s research staff found that the quality adjustment for these new devices was substantially understated. Annualized output growth now runs close to 30% per year—a substantial revision from its previous estimate of 5%. To be fair, computer storage device manufacturing is a relatively small component of total manufacturing production, as it accounts for less than 1%. Nevertheless, it still illustrates the estimation problems associated with new devices and gadgets. Another example involves prices and quality adjustments for cell/smartphones. Price measurements for cell phones track the service contract and not the quality and improved functionality of cell/smartphones. As a result, this understates the added value of these gadgets.
The Fed’s research staff estimates that the prices (which are not adjusted to capture quality improvements, as Parker noted) are falling at a rate of 15% to 20% per year because of the rapid advance in new applications (in other words, the added value of smart phones is understated in GDP).
But even if government statisticians eventually succeed in identifying and quantifying the new innovations, those statistical recalibrations won’t have any impact on a company’s operating results since they will already have been documented and reported to investors.
The argument for mismeasurement also seems plausible, but virtually impossible to gauge. Indeed, federal tax receipts offer some of the hardest data, as they are free of manipulation and seasonal adjustment. Moreover, individual and corporate tax receipts are inextricably linked to the vagaries of the business cycle. Collectively, receipts from these two sources grow faster than nominal GDP during recoveries and slow down (or actually contract) during recessions.
Tax Receipts Far Outpace GDP
Growth Over the past five years, the growth in federal individual and corporate tax receipts has increased three times the rate of nominal GDP growth. That’s unusually fast and twice the ratio of the relative growth rates of the 1990s (Display 2). Even if we exclude the surge in revenue in 2011, which represented a strong rebound from the depressed revenue levels tied to the recession, the pace of recent revenue growth still stands at 2.7 times.
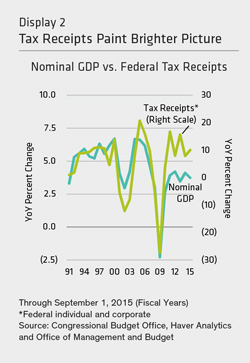

To be fair, over the past several years there have been a series of federal tax law changes (tax base broadening and top marginal rate changes) that have been aimed at raising tax revenue. And some of the tax changes are tied to investment income and not regular income, so the relationship between tax receipts and nominal GDP may have changed somewhat. Yet the 1990s also had a number of tax law changes, and the hike in the top marginal rate from 28.0% in 1990 to 39.6% in 1993 was far greater than what occurred in the current cycle.
Although the strength in federal tax receipts raises questions about the accuracy of the GDP figures, we still have no hard evidence that there are measurement issues in GDP. It might just be that today’s economic structure is changing faster than we can measure it. The data in use today rely on the 2007 economic census information, and the results from the economic census of 2012 are being incorporated on a rolling basis over the next few years. Also, new gadgets, services or industries that are not currently part of GDP may be included in the future.
In the final analysis, the US economy is clearly undergoing some substantive changes, and some of the changes may be so transformative that it’s nearly impossible to capture them accurately and timely. That’s why aggregate business reports (earnings and margins) and tax data may be offering better information on the economy’s performance long before it’s captured in GDP.
By Joseph G. Carson, US Economist and Director, Global Economic Research, AB
———-