The US economy continues to expand, but the pace of growth varies greatly between the manufacturing and nonmanufacturing (service) sectors. While the manufacturing sector has hit stall-speed, the service sector continues to flourish—and that’s where the growth and jobs are located. Yet the overwhelming flow of market and economic information focuses on the manufacturing (goods) sector, so the good/bad news ratio at present is tilted to the negative side.
Manufacturing vs. Nonmanufacturing
Sectors Each month, the Institute for Supply Management (ISM) surveys purchasing agents and supply managers in the manufacturing sector and the nonmanufacturing sector. These survey results offer early and real-time insight into the underlying trends in business activity, order commitments (domestic and foreign), employment trends and pricing power for 18 manufacturing and 18 nonmanufacturing industries.

Starkly Different December Results
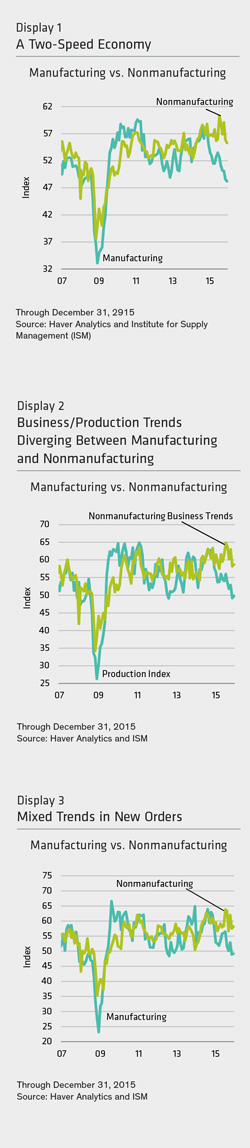
In December, the manufacturing survey composite index stood at 48.2—the weakest reading in six years. In contrast, the non-manufacturing index stood at 55.3, which is just a tad lower than the readings of the past year (Display 1). The difference is even more striking in some of the underlying components.
For example, the index of business activity (or sales/production) in the nonmanufacturing sector stood at 58.7 in December, compared to a 49.8 reading in the manufacturing sector (Display 2, next page). Meanwhile, the new orders index of 58.2 in nonmanufacturing was 9 percentage points over the manufacturing reading of 49.2 (Display 3, next page). Large and positive gaps for the nonmanufacturing sector were also reported for the backlog of orders and for employment.
The absolute and relative strength in the nonmanufacturing sector is also evident in news on the manufacturing, or goods, sector. One systemic reason for this is that the manufacturing/goods sector dominates the economic reports of the government. Every month, the government reports on retail sales (consumer demand for goods), wholesale sales (business demand for products), manufacturing production, and new orders for durable and nondurable goods. It also reports monthly on business inventories for the retail, wholesale and manufacturing sectors, as well as merchandise trade, which captures goods exported and imported.
In contrast, there’s not one single monthly government report on demand or sales trends in the private service sector. The only monthly source is the ISM surveys. Plainly, the lack of timely and credible information on the service sector makes it very difficult for growth in the service sector to be accurately captured in the initial gross domestic product (GDP) reports.
There is the relatively new quarterly report on revenues from the US Census Bureau that covers a broad list of service industries. It does provide some data, but it’s released three months after a quarter is over—and after two GDP estimates have been released. Moreover, the newness and volatility in the data force government statisticians to use four-quarter rolling averages for many of the service sectors.
To get around the shortfall in the data, we have relied on soft data (business surveys) and hard data (employment and tax receipts) to help gauge underlying trends in the economy. The payroll employment data confirm that a solid growth trend is still under way, but it is difficult to identify sources or sectors that are experiencing the growth in demand since there are no hard sales data from the service sector. Yet the fact that a broad array of service sectors (which account, overall, for 60% of GDP) are hiring indicates that they need additional labor to meet ongoing increases in demand. There’s no quibbling that a faster overall growth rate in 2016 requires a recovery in the manufacturing sector. But for now, the growth in the nonmanufacturing sectors (which include construction) is sufficient to keep the economy on an even keel.
By Joseph G. Carson, US Economist and Director, Global Economic Research, AB
———-