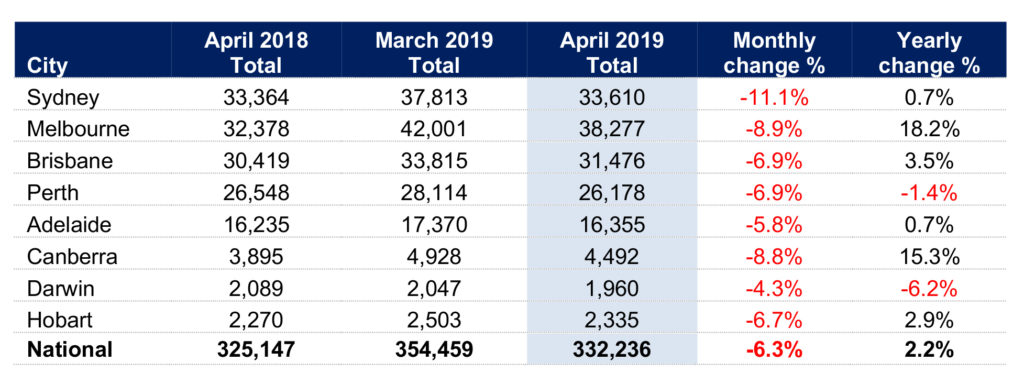
Figures released yesterday by SQM Research reveal national residential listings decreased by 6.3% in April 2019 to 332,236 from 354,459 in March 2019.
All states experienced a decrease in property sales listings over the month, with Sydney experiencing the highest decrease at 11.1%, followed by Melbourne at 8.9% and Canberra 8.8%. Darwin recorded the lowest decrease at 4.3% and also recorded a year-on-year decline of 6.2%.
Compared to a year ago, national listings rose 2.2% with Melbourne recording a huge increase of 18.2% year-on-year followed by Canberra at 15.3% increase. Sydney recorded a 0.7% increase year-on-year.

Louis Christopher, Managing Director of SQM Research, said: “the decrease is mainly due to the Easter long weekend and ANZAC day public holidays in the month of April which had only 3 weekends of trade compared to March which had 5 weekends.
That said, I note Sydney listings are now only up by just 0.7% year on year. If Sydney listings are starting to peak that could be a sign we are getting closer to the bottom in this downturn. However the election could also be having an impact here, with both buyers and sellers waiting until the election is over before making decisions on buying and selling.”
Asking Prices
Capital City house asking prices increased marginally by 0.1% but units decreased by 0.6% for the month to 30 April 2019. Unit asking prices are now $559,900 and houses $908,800.
Darwin’s unit price had the highest decrease at 9.9% over the month followed by Hobart with a 5.3% decrease in unit prices. However, Hobart’s house prices saw the highest increase at 1.4% over the month.
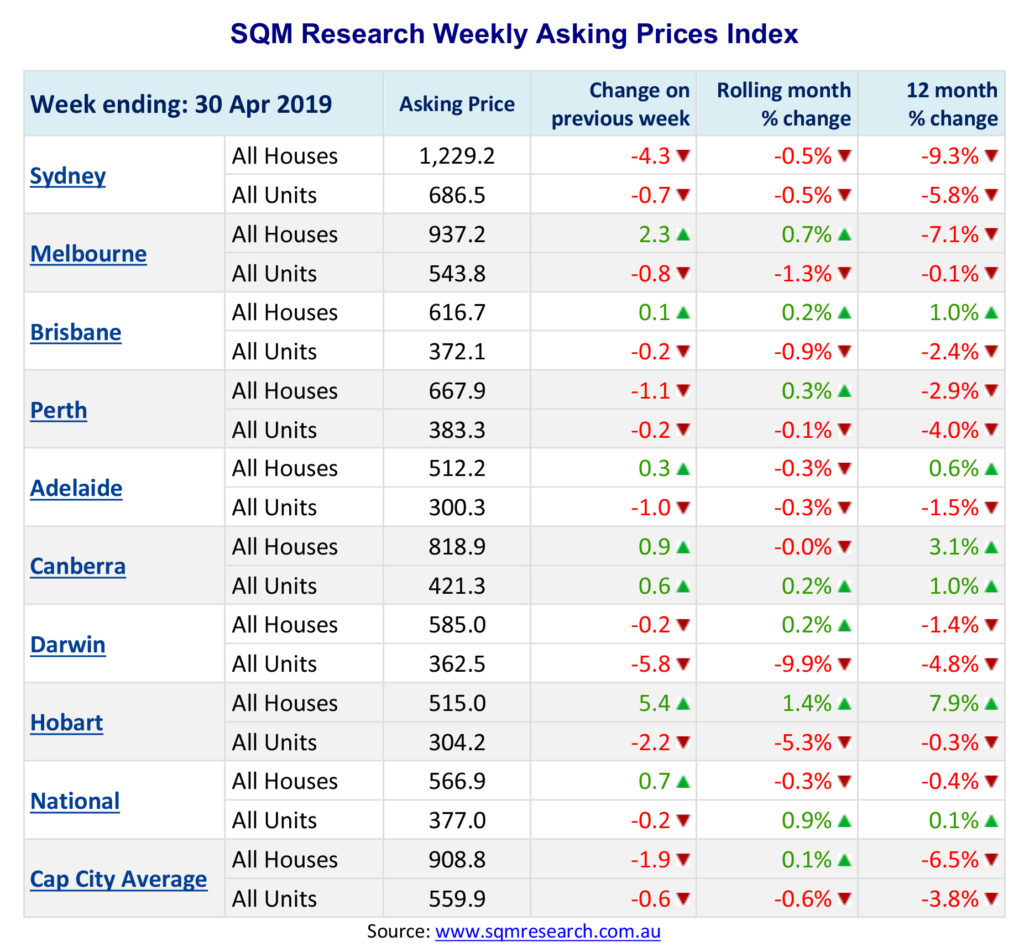

Sydney’s house and unit prices both dropped marginally by 0.5% over the month. A house in Sydney is now $1,229,100 and a unit is $686,500 – both at 2016 prices.
Sydney’s 12 month decline is now 9.3% for houses and 5.8% for units. Melbourne’s house and unit prices also continue to decline over the 12 months to 30 April at 7.1% and 0.1% respectively.
Perth experienced a marginal growth in house prices of 0.3% but unit prices continue to decline at 0.1%.
Year-on-year capital city asking prices also posted declines of 6.5% for houses and 3.8% for units. Hobart continues to show the strongest growth year-on-year for houses with a 7.9% increase but units declined 0.3% over the 12 months. Canberra also experienced yearly growth of 3.1% in houses and 1.0% growth in units.
Key Points
- National residential listings decreased by 6.3% in April 2019 to 332,236 from 354,459 in March 2019.
- All states experienced a decrease in property sales listings over the month, with Sydney experiencing the highest decrease of 11.1%.
- Capital City house asking prices increased marginally by 0.1% and units decreased by 0.6% for the month to 30 April 2019.
- Darwin’s unit price had the highest decrease of all capital cities at 9.9% over the month.
- Hobart’s house prices saw the highest increase of all capital cities at 1.4% over the month.