There is a risk Australian company earnings face material headwinds.
Key points
- Equity investors rejoiced in June as the Fed signaled it may cut interest rates – but interest rates do not drive long run equity performance. Profits do.
- While the Fed gets a lot of credit for the US bull equity run, the reality is that market performance has been supported by a near 100% increase in corporate earnings since 2008.
- By breaking down the components of the profit growth using the Kalecki-Levy profit equation, we can clearly identify the macro elements responsible for earnings growth and hence the source of share market performance.
- Investors should spend less time thinking about or predicting what the Fed will do, and more time thinking about the purse strings controlled by Congress.
- The lessons learned from this analysis points to meaningful medium term headwinds for Australian corporate profits.
What just happened?
Well, that was quick! It seems only yesterday pundits were expecting the US Federal Reserve to hike interest rates four times in 2019[i]. It seems now the reflation trade is dead (which we warned against in 2017) and the US Fed is now on a ‘easing bias’, along with Europe, Australia, the UK and others.
And don’t the markets love it!
And why not? Since the great recession of 2008-9, the common narrative for equity investors is “the Fed has our back”. Whether it’s via quantitative easing or low interest rates, the idea seems to be that so-called ‘cheap money’ fuels equity market performance.
But does it really?
As fundamental investors, we push back against this narrative somewhat. We firmly believe that at the stock level, if a company earns more profit over time, then the share value will increase over time. Indeed, our own research clearly shows the correlation between listed real estate performance and interest rates is zero (over the long term). Sure, low debt costs can boost earnings, but low interest rates (and low inflation) are not always good news for long term equity investors (just ask any Japanese fund manager).
If individual stocks benefit from higher earnings, then it stands to reason that in the long run equity performance relies more on profits than interest rates. The good news is the facts back up this argument.


So as investors contemplate the medium term outlook for equities, maybe we should spend less time thinking about the Fed and more on the profit outlook for listed companies.
Profit growth in the US has increased almost 100% since 2008, from US$1.03T to US$2.03T. What drove such a performance during a period of relatively weak GDP growth? What were the components of US corporate earnings, and are the same components able to deliver as they have since 2008-09?
Where do profits come from?
Fortunately there is a very accurate methodology that breaks down the components of company earnings through the accounting relationships between the four sectors of a modern economy: companies, government, households and the external sector. This methodology is known as the Kalecki-Levy Profit equation[ii], and the logic is as follows.
Company profits are nothing more than company savings (retained earnings) plus dividends paid. In addition, company savings are equal to national savings less whatever has been saved by the other entities in the economy – households, government and the external sector. Written formally:
Company savings = national savings – household savings – government savings – external savings
Adding dividends to both side of the equation we find company profits equals:
National savings – household savings – government savings – external savings + dividends
What are national savings?
There are two types of savings in the modern economy: financial savings and real savings.
As we outlined in our recent article on Modern Monetary Theory, financial savings are a zero sum game. One entity’s financial deficit is another’s surplus (to the dollar). We see this clearly in the sectoral balance, which always adds to zero. Real savings occur when a real asset is created via investment (extract from our article below).
“Assume a company is formed with the sole purpose to build a bridge. It has $30 of cash in the bank via equity raised from shareholders, but no other assets or liabilities. Note the $30 in equity was sourced from existing savings from the public. Let’s see how this existing saving can create new savings.
Now the company applies (and receives) a $100 loan for the bridge. The loan creates the deposit, and the new $100 deposit along with the existing $30 is then spent paying workers to build the bridge. Upon completion of the project:
- The company has $100 in loans and $130 in assets (a bridge). The net equity of the company ($30) remains unchanged.
- Workers now have an extra $130 in their bank accounts for their labour.
The economy started with $30 in savings (which was the initial equity of the company). However, after borrowing and spending an additional $100 for the bridge, the economy now has an additional $130 in savings sitting in the accounts for the workers. The $130 bridge investment created the savings.”
So national savings is nothing more than national net investment.
The components of US company profits (the result may surprise you)
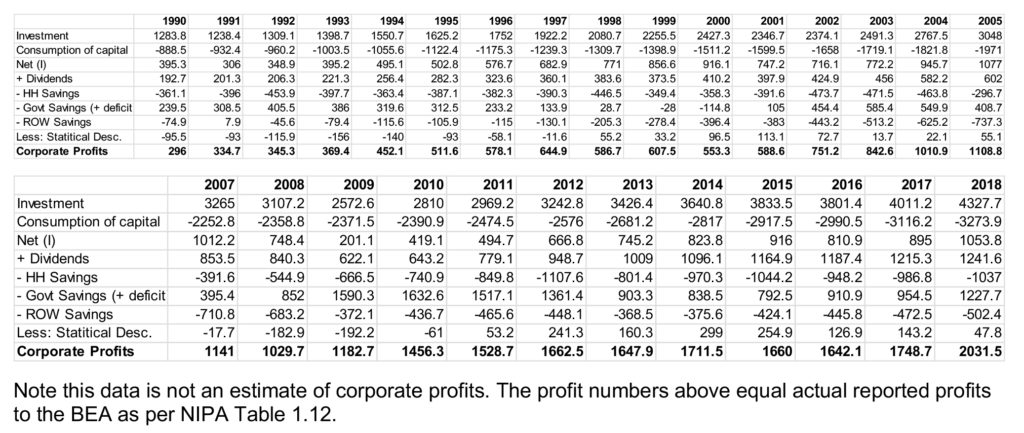
The good news is the Bureau of Economic Analysis (BEA) provides the very data required to reconstruct the components of US profits from the other sectors of the economy via the ‘National Income and Product Accounts’ (for those interested, refer to the Appendix for the relevant websites and data tables).
The following charts detail the components of US earnings in absolute terms and also relative to Gross National Product.[iii]
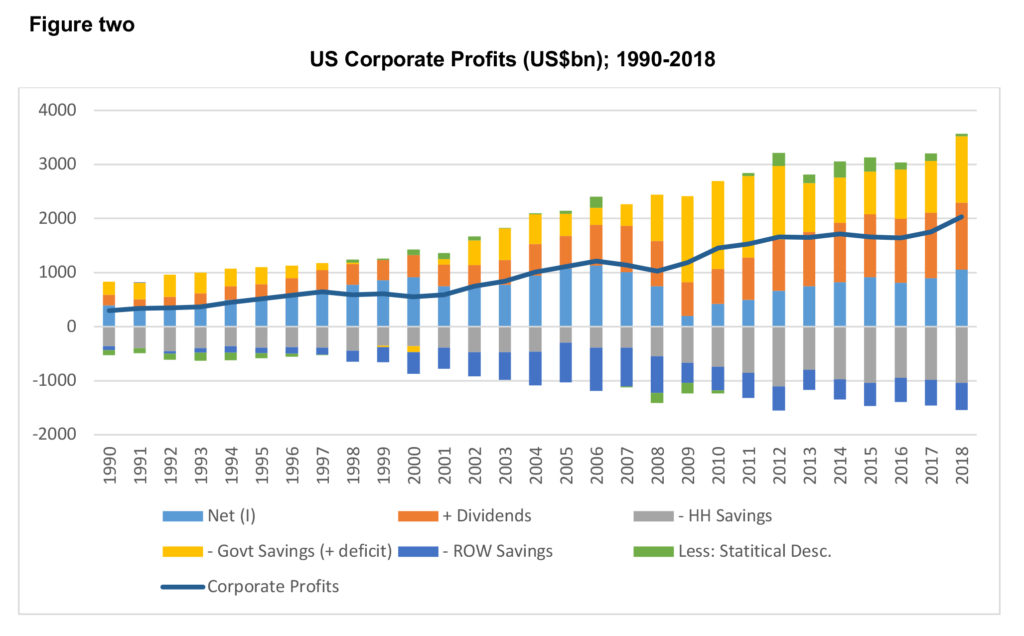

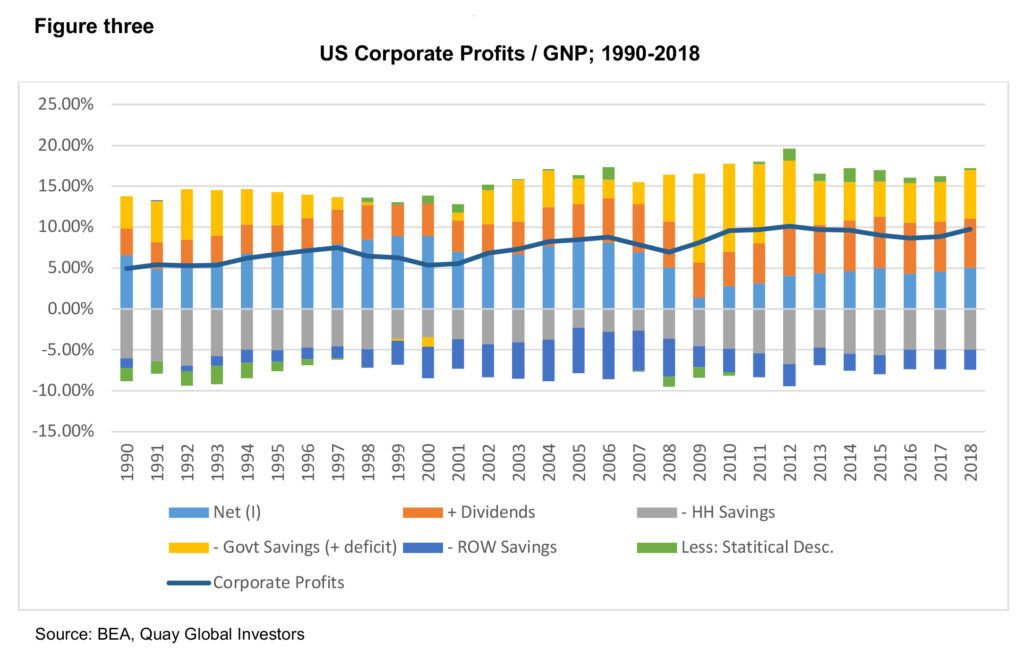

Some observations
- Net investment plays a key role in national savings and is therefore an important component for company profits at a macro level. For example, the above charts show the rise in net investment and profits to 2006 driven by the housing cycle.
- In 2008-09, investment collapsed due to the housing cycle bust, yet the fall in profits was buffeted largely due to the substantial increase in the government deficit.
- Conversely, in the late 1990s investment boomed (tech), but profits didn’t. This was largely due to the ‘Clinton surpluses’ which increased government savings at the expense of other sectors – the lack of profit growth caused a meaningful market correction in 2001.
- Households almost always save – when savings fall it can add to corporate profits, and when they rise it creates profit headwinds (the paradox of thrift).
- It may seem counterintuitive that ‘dividends paid’ add to earnings, but they do add to household / foreign income – which can either be saved (as accounted for with household / foreign savings) or spent, which adds to corporate revenue and profits.
- The most recent lift in company earnings (2018) coincided with an increase in government deficit (driven by tax cuts). Real Investment has remained largely static since 2014.
Despite much hand wringing by company CEOs about the sustainability of government finances, companies and their shareholders tend to be major beneficiaries of ongoing budget deficits – especially during periods of weak economic growth. Investors concerned about the medium term performance of the sharemarket, could do well to focus more on the purse strings of Congress than the vagaries of the US Federal Reserve. In that context, the near-certain gridlock in Washington between Democrats (who control the purse strings via the House) and Republicans (who control the Senate and the Executive) is a meaningful risk to medium term profits as the economy slows.
Lessons for Australia
Unfortunately, Australia does not provide the same level of data as the BEA – or at least I couldn’t find it (if any reader knows where I can get it within the ABS, please let me know).
However, the laws of accounting apply equally in the US as Australia. So what can we take from the Kaleki-Levy Profit equation for the outlook for Australian earnings?
First it is important to recognise this formula is not predictive in nature. If we knew household savings were likely to rise, it does not follow corporate profits must fall, since all factors in the economy are dynamic (government deficits and the external deficits are always fluid). But by understanding the components of profits, we can at least be aware of the risk. In Australia, the key risks are:
- A bi-partisan agreement for low government deficits (or even surpluses), draining (or limiting) savings from the non-government sector;
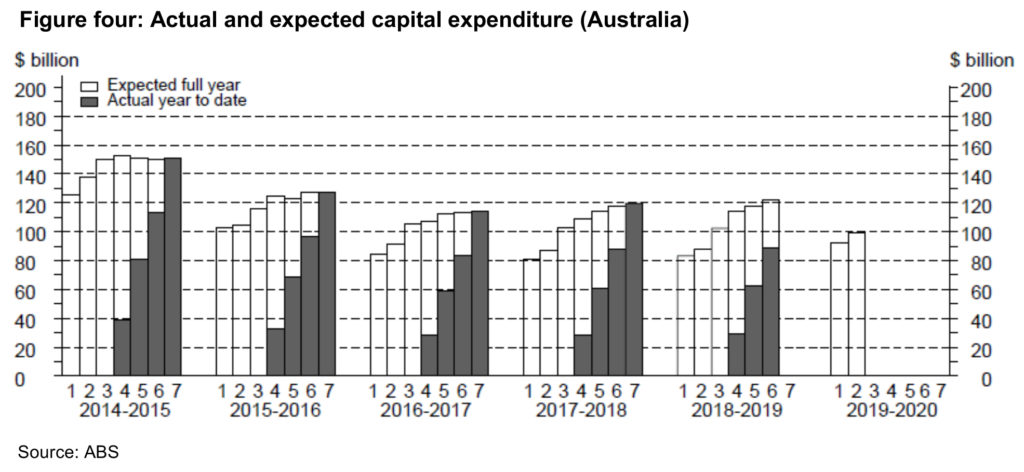
- An anemic investment outlook, which is at risk of deteriorating further in the absence of a meaningful pick-up in consumer demand (see Figure four); and
- A declining in the household savings rate, which is almost certain to reverse as domestic balance sheets begin to de-lever and potentially tighter lending restrictions bite (see Figure five).


Recently Australian profits have largely benefited from a sharply improving current account (reducing external savings), a gradual decline in household savings and a strong investment cycle (residential) that offset the mining boom. It would be fair to argue most of these factors are now behind us.
Unless the government proactively increases the deficit (which is likely to require bi-partisan support), or we continue to improve the external current account deficit (via a substantially lower dollar), there is a risk Australian company earnings face material headwinds.
By Chris Bedingfield, Principal and Portfolio Manager
———
Appendix
For readers who wish to replicate the analysis in this paper (and go back even further over time – the data begin in 1929!), you can find the relevant BEA web site here.
To reconstruct the data, use the following template:
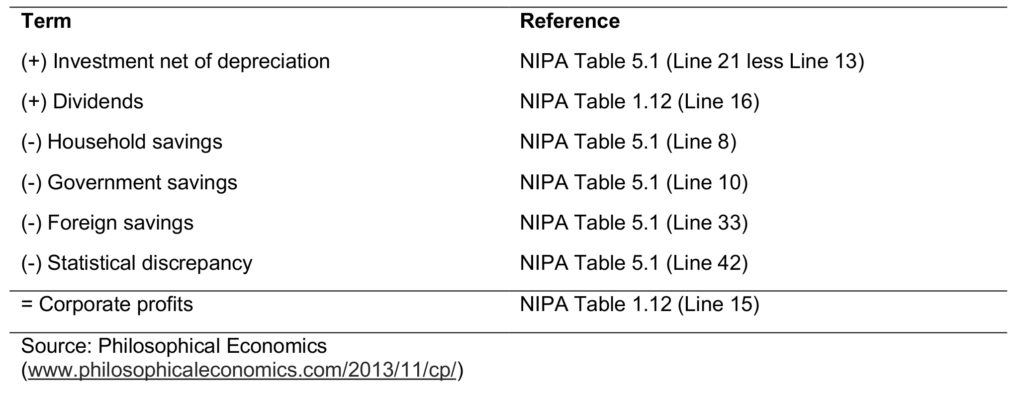

The actual data from the series is replicated below for readers to cross check (data in US$bn).