
Monik Kotecha
Simply comparing the success of a portfolio against benchmarks is useful but not sufficient if looking to build sustainably higher returns in a fund compared to the market.
Investors ‘running their own money’, or working in tandem with their financial advisers, need to possess a deeper understanding of the performance of the portfolio in rising and falling markets, especially when it comes to equities.
If using specialist managers, trustees increasingly expect those managers to outperform the market when it is rising but protect them in falling markets. Otherwise, they can just buy a benchmark cheaply and accept a constrained return without any real Alpha contribution.
Why is this important?
At the most basic level, a portfolio that falls less than the market is protecting member assets, and for people in pension phase, or getting close to retirement, that means a longer period before money runs out, or a higher living standard.
Think about a simple example, a market correction of 30%, requires an investor to make a positive return of almost 43% to get back to where they were. But a fall of only 20% needs only 25% to break even with pre downturn level.
A portfolio that is protecting members on the downside is ensuring they will recoup losses quicker, and/or extending the longevity of assets. So, it’s not all about the upside, the downside protection is critical.[1]
What does that mean for stock or manager selection?
Quality businesses that invest heavily in their future activities are future proofing their growth and building a ‘moat’ around their earnings. Many fintech businesses, for instance, have low barriers to entry unless the firm is investing to keep raising that barrier. Amazon is an example of a tech stock investing heavily to future proof their market position through all parts of the economic cycle. This is important for SMSFs to consider when chasing sustainable growth in benign or rising markets, and also to mitigate market downturns.
Quality firms that are profitable and positioned well through disruption generally are not punished by market corrections to the same level as more speculative stocks with lower levels of profitability and free cashflow.
Hence taking a higher exposure to quality firms over time in a portfolio becomes more attractive as members move towards retirement to reduce the potential impact of a market mishap. No immediate pre or post retirees want nasty surprises, and extensive research proves the highest quality firms, i.e. large, profitable and innovative firms retain their high ROIC over time and produce sustainable growth through all market cycles and increasing stock price levels in the long term.
Insync is a global equity manager that has demonstrated the ability to add value through consistent upside and downside participation as shown by the following table. The firm has outperformed consistently outperformed the market by growing in excess of 110% of the MSCI for over all time periods up to 10 years, but also only dropped by 73% of the MSCI falls on average over that same 10 year period – i.e. the best of both worlds.

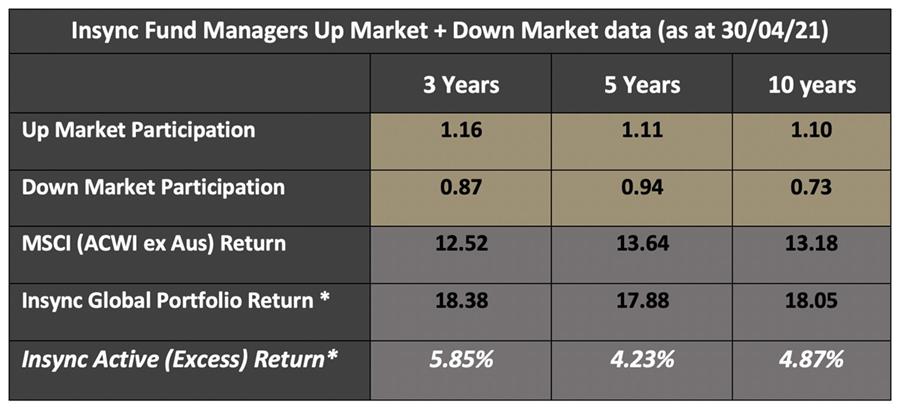


* All returns are to 30 April 2021 and are gross, i.e. pre–Fund MERs.
Bottom line, this manager is significantly outperforming the market in the long term (4.87% pa better off than the MSCI), and in doing so protecting SMSF member benefits or the longevity of pension payments.
This is the benefit of using an active manager with an eye on both rising and falling markets. SMSF trustees have neither the time or skills to create a portfolio that consistently generates these outcomes, and this becomes so much more important as retirement draws near.
The skill lies not just in picking the right stocks but blending them in a way that reduces the overall volatility of the equity portfolio against the benchmark to provide better downside performance.
By Mr Monik Kotecha, CIO
———