The importance of growth regimes to asset allocation decisions
The article explores Understanding the 4 PMI growth regimes will allow those with asset allocation responsibilities to construct more robust and responsive investment frameworks.
This is the first of three articles aimed at providing advisers with a framework around asset allocation that will assist with client discussions and their portfolio strategy in these uncertain and changing times.
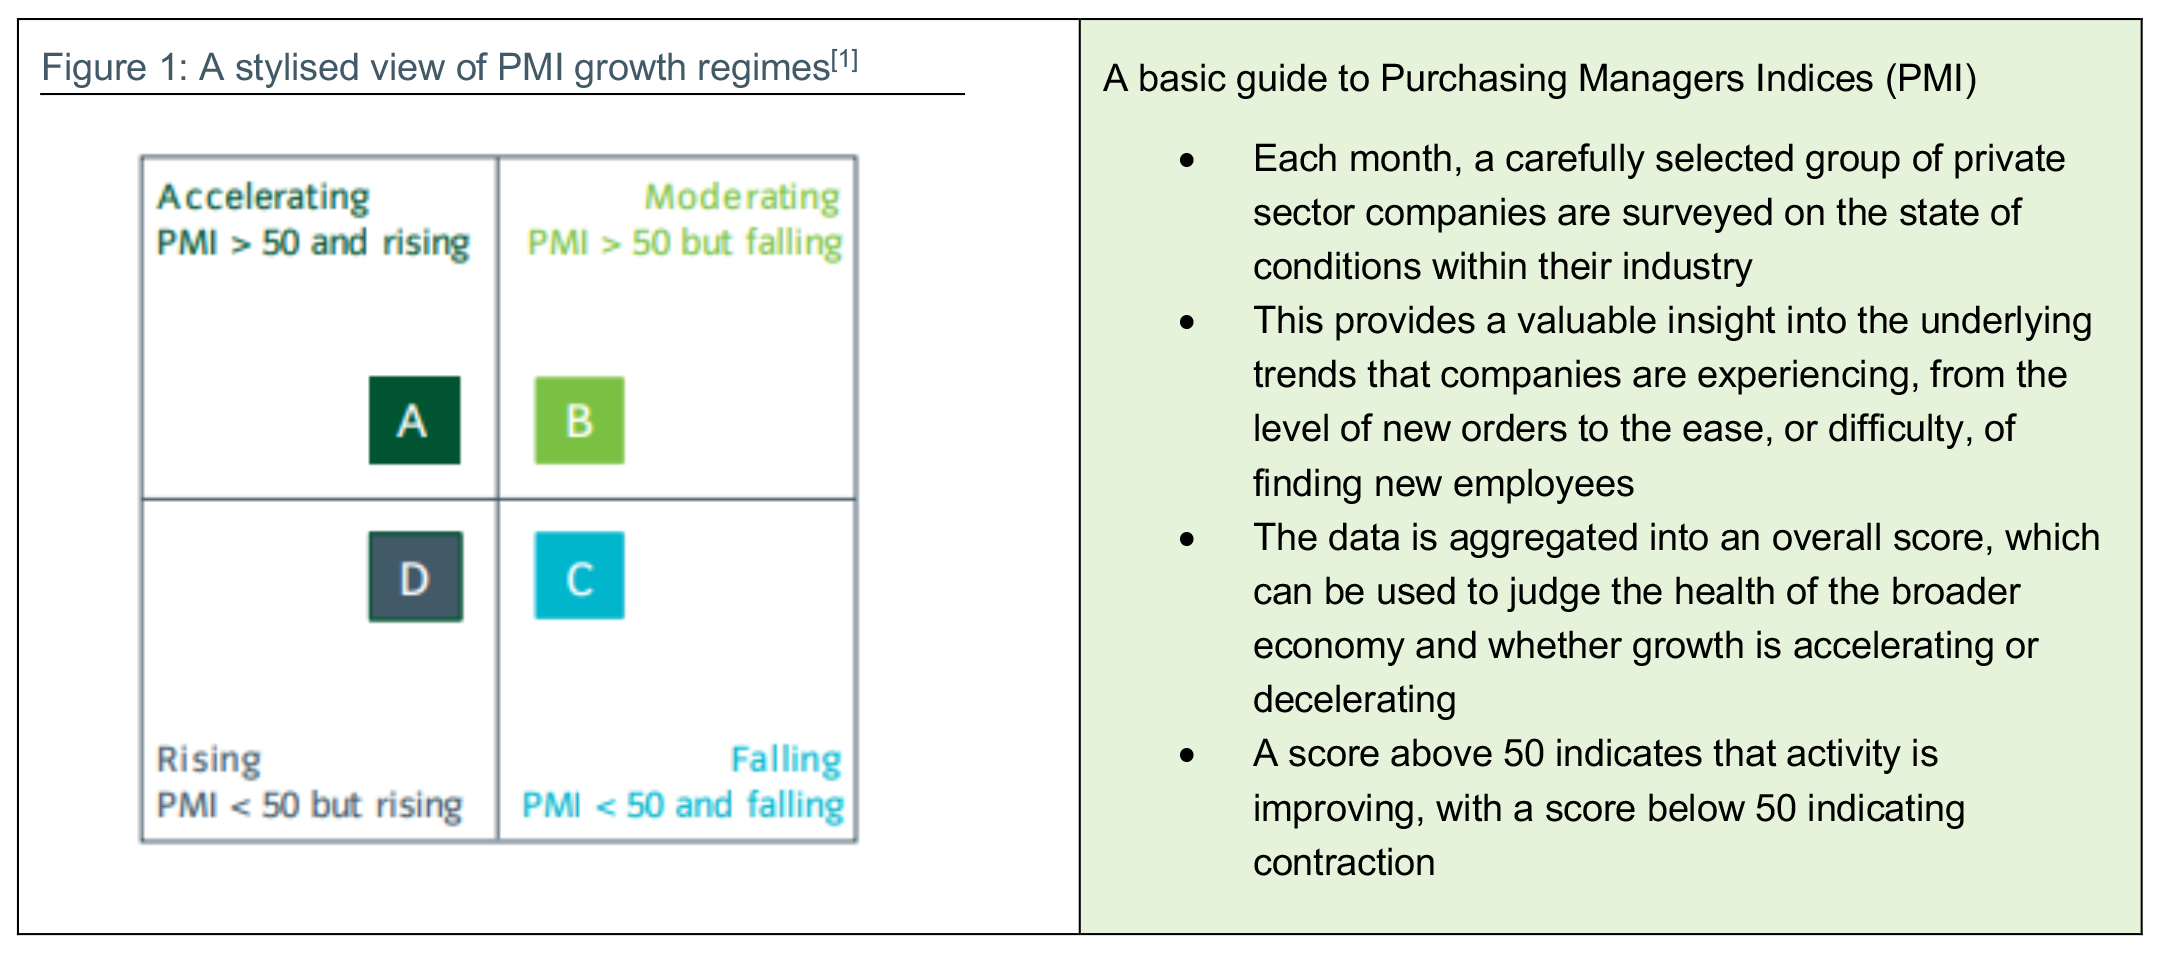
At the risk of stating the obvious, as a growth asset, equities tend to do well in periods where economic growth is good, and less well in periods of economic contraction. Government bonds, by contrast, tend to behave in the opposite manner, at least from a growth perspective. When assessing growth dynamics, we look at a wide range of indicators, some forward-looking, some co-incident. One of the best sets of timely indicators is the purchasing managers’ indices (PMIs) which reflect the health of the manufacturing and service sectors, and we track 38 monthly country and regional releases. Interpreting PMIs is relatively simple, and any data point can be allocated to one of four regimes (see Figure 1). From a multi-asset perspective, we can use this framework to examine historical asset-price returns and other performance characteristics (for example volatility and drawdowns) across these different regimes since the early 1970’s. This analysis then serves as a guide to our asset allocation decisions.
In recent decades, the economic environment has generally been positive
Looking back over the longer-term, we have spent more times in ‘good’ investment environments and less in bad: i.e., we have spent the majority of time in either regime A or B (Accelerating and Moderating), with only short and shallow dips into the sub-50 PMI regimes (C and D) which were often insufficient to tip the US (or other economies) into recession (see Figure 2).
That in part explains the strong returns experienced by risk assets over the last few decades. On a cross-country basis, few other countries have seen such an impressive cycle as the US. The US economy has spent around 85% of this period in regimes A and B and only 15% in regimes C and D. This performance stands out amongst the 32 countries we follow, which have on average spent only 70% in regimes A and B.
Unusually, the traditional causes of recession (industrial downturns or oil shocks) and policy errors (where interest rates are excessively tightened to cap rising inflation) have largely been absent in recent decades. Instead, recession risk has come via financial transmission mechanisms, for example inflated stock prices in the late 1990s or the real-estate bubbles which triggered the sub-prime mortgage crisis and ultimately led to the global financial crisis. The most recent recession came in the form of an exogenous shock – the pandemic. Arguably we have not had a textbook, economic policy-led, recession since the 1980s.
We believe, however, that our growth framework works because these shocks, whatever their initial cause, need to be big enough to have real economic consequences if they are to have significant medium-term asset allocation implications.
Understanding the characteristics of historical growth regimes
When we analyse historical data, the sweet spot for risk assets tends, unsurprisingly, to be an Accelerating growth regime (A), when growth is strong and getting stronger. During these times, the correct asset-allocation strategy has been to skew towards pro-cyclical exposures such as equities (see Figure 3). The Falling growth regime (C) is the only one in which average equity market returns have historically been negative.
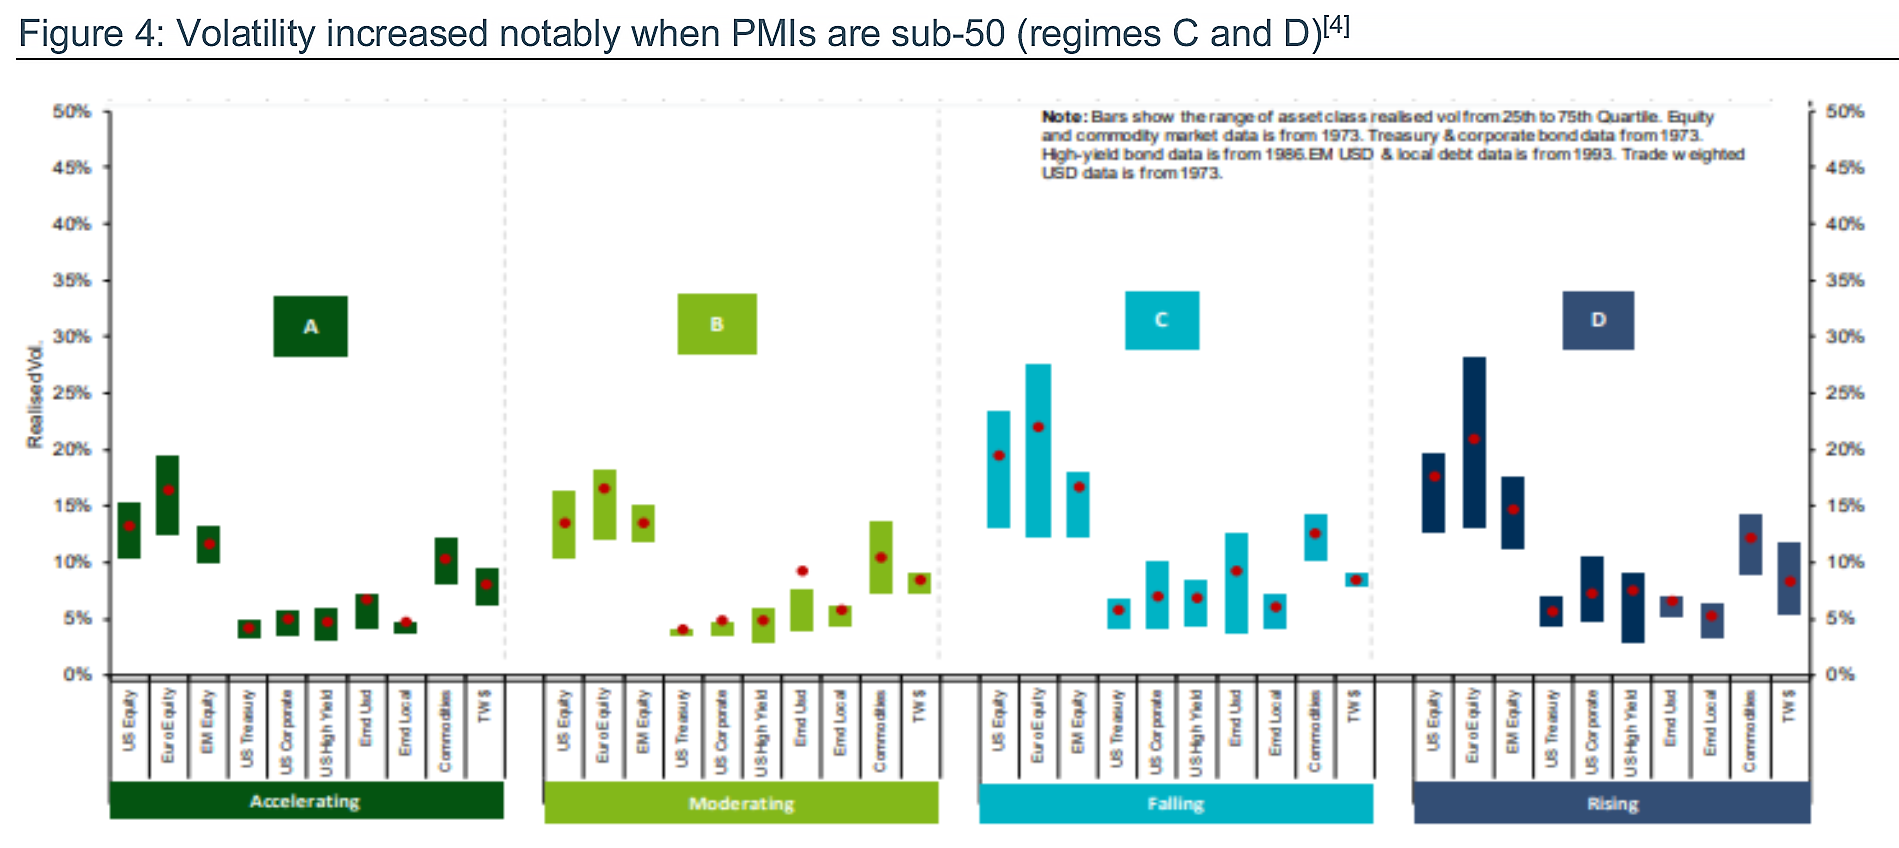
In Moderating growth regimes (B) risk-asset returns have generally been lower than in Accelerating growth regimes, with slightly higher volatility and a greater chance of meaningful drawdowns. Volatility tends to be much higher when PMIs are sub-50 (see Figure 4, regimes C and D).
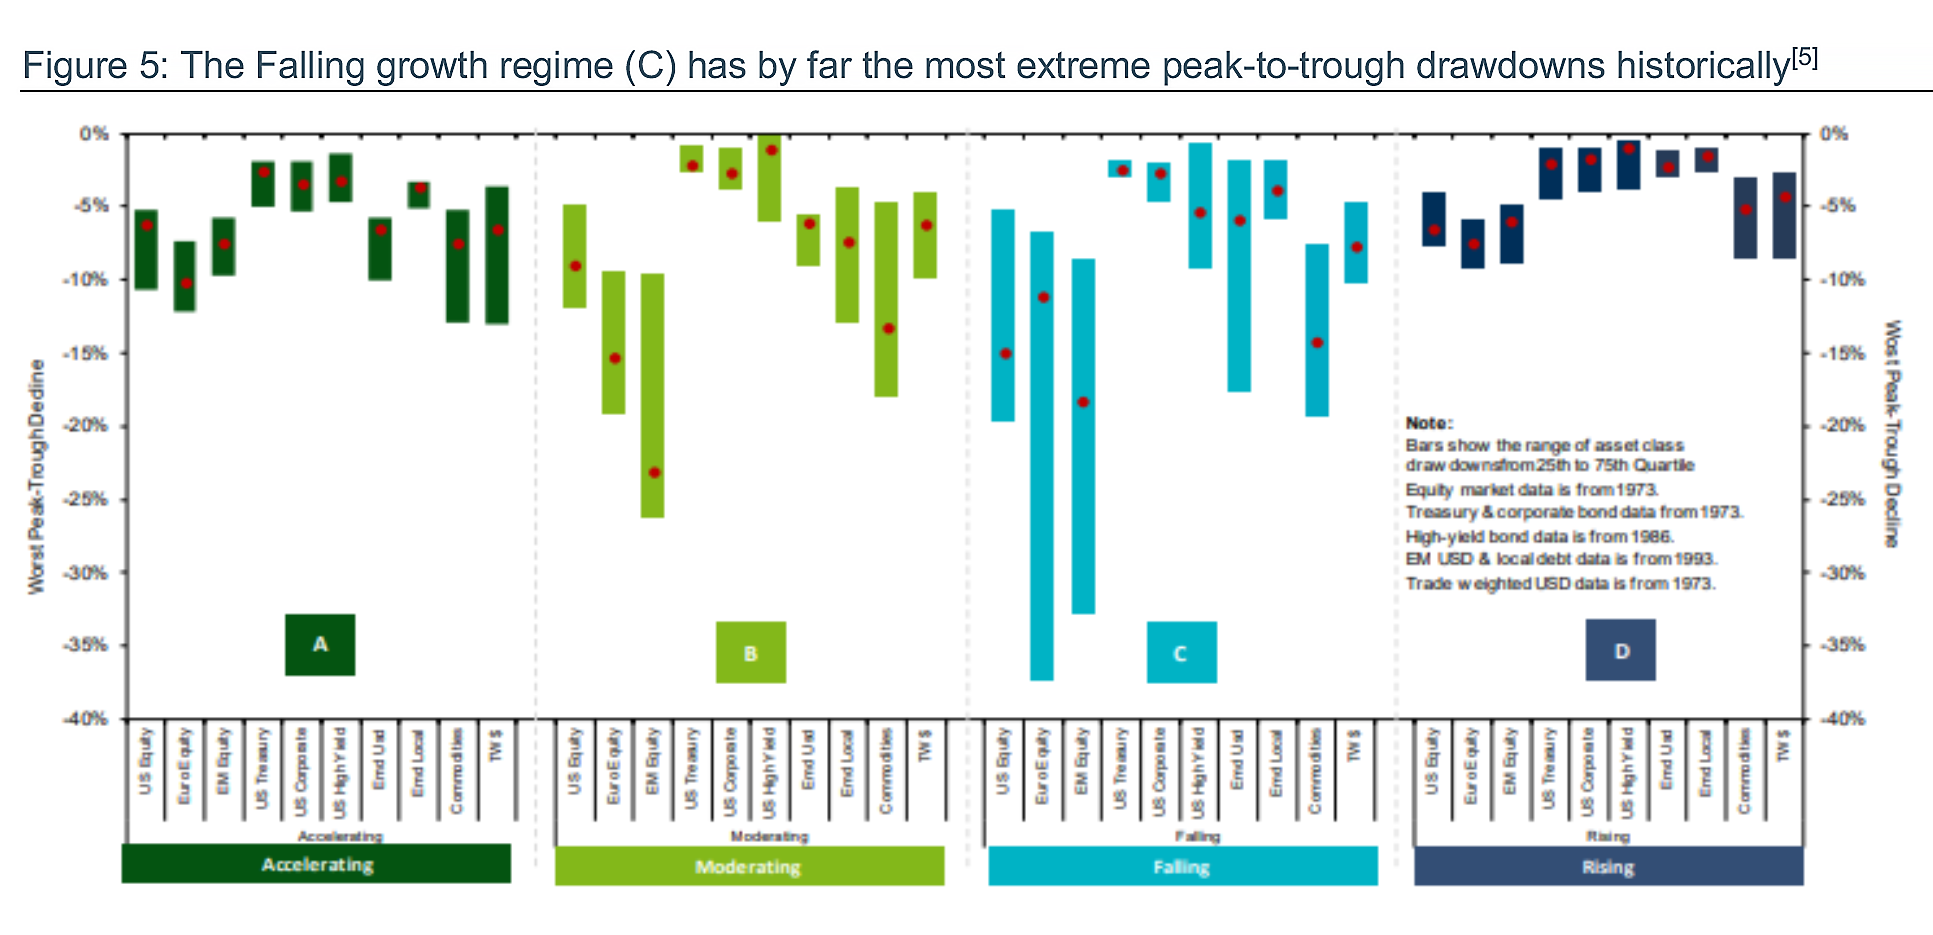
Historically, drawdown risks are greatest in a Falling growth regime (C), unsurprising in an environment where the economy and likely earnings are contracting (see Figure 5). For areas that are more leveraged into global growth such as emerging markets, they are also notable in a Moderating growth regime (B).
The importance of recessions to equity bear markets
Our analysis on the interaction of economic data with asset class behaviour across history shows us that in particular, periods of strong or weak growth are significantly influential for equity markets. This is unsurprising; the intrinsic relationship between economic growth, corporate profitability and share prices is clear. However, it is worth noting just how pronounced these linkages are, particularly in more extreme periods of economic contraction where equity downside risks are dominant.
To demonstrate this, we can analyse the various bear markets[6] that have occurred for the S&P 500 Index over the past 100 years. We have split these into three categories: normal bear markets (declines of -20% to -30%), large bear markets (declines of -30% to -50%) and mega bear markets (declines of more than -50%). Once defined, we can then look at the growth indicators across those periods (see Figure 6).
A key observation is that each and every bear market has been historically associated with a recession, with the size of the bear market tending to reflect the severity of the growth decline. Therefore, as an asset allocator, a timely understanding of when the growth backdrop is deteriorating should always be a key component of an investment framework.
It is notable how unique the pandemic driven bear market was in terms of the rapidity of the market drawdown and scale of recession. Each period in history has its own unique facets, but the link between big drawdowns in stock markets and growth holds, even if the causality can work both ways.
Conclusion
It is clear that the growth regime is an important factor for the returns and volatility of different asset classes, but it is not the only factor. In our next article we will discuss the role of inflation, and real interest rates, which can also be an important indicator for asset allocation decisions.
We trust that this look at growth regimes provides a helpful lens for your discussions with clients and look forward to sharing our regime framework around the impact of inflation on asset prices in the next of our series of 3 articles.
——–
References:
[1] Source: For illustrative purposes only.
[2] Source: Insight, Bloomberg. Data between December 1976 and March 2022.
[3] Ibid.
[4] Ibid.
[5] Ibid.
[6] A bear market is defined as a peak-to-trough decline of more than 20%
[7] Source: Insight, Bloomberg. Data between December 1976 and March 2022.
———
Important information:
Risk Disclosures: Past performance is not indicative of future results. Investment in any strategy involves a risk of loss which may partly be due to exchange rate fluctuations. The performance results shown, whether net or gross of investment management fees, reflect the reinvestment of dividends and/or income and other earnings. Any gross of fees performance does not include fees, taxes and charges and these can have a material detrimental effect on the performance of an investment. Taxes and certain charges, such as currency conversion charges may depend on the individual situation of each investor and are subject to change in future. Any target performance aims are not a guarantee, may not be achieved and a capital loss may occur. The scenarios presented are an estimate of future performance based on evidence from the past on how the value of this investment varies over time, and/or prevailing market conditions and are not an exact indicator. They are speculative in nature and are only an estimate. What you will get will vary depending on how the market performs and how long you keep the investment/product. Strategies which have a higher performance aim generally take more risk to achieve this and so have a greater potential for the returns to be significantly different than expected. Any projections or forecasts contained herein are based upon certain assumptions considered reasonable. Projections are speculative in nature and some or all of the assumptions underlying the projections may not materialize or vary significantly from the actual results. Accordingly, the projections are only an estimate. Portfolio holdings are subject to change, for information only and are not investment recommendations.
Associated investment risks
Multi-asset:
– Derivatives may be used to generate returns as well as to reduce costs and/or the overall risk of the portfolio. Using derivatives can involve a higher level of risk. A small movement in the price of an underlying investment may result in a disproportionately large movement in the price of the derivative investment.
– Investments in bonds are affected by interest rates and inflation trends which may affect the value of the portfolio.
– The investment manager may invest in instruments which can be difficult to sell when markets are stressed.
– Property assets are inherently less liquid and more difficult to sell than other assets. The valuation of physical property is a matter of the valuer’s judgement rather than fact.
– While efforts will be made to eliminate potential inequalities between shareholders in a pooled fund through the performance fee calculation methodology, there may be occasions where a shareholder may pay a performance fee for which they have not received a commensurate benefit.
ESG:
– Investment type: The application and overall influence of ESG approaches may differ, potentially materially, across asset classes, geographies, sectors, specific investments or portfolios due to the nature of the specific securities and instruments available, the wide range of ESG factors which may be applied and ESG industry practices applicable in a particular investable universe.
– Integration: The integration of ESG factors refers to the inclusion of ESG risk factors alongside financial risk factors in investment analysis and research to judge the fair value of a particular investment and may also include the monitoring and reporting of such risks within a portfolio. Integrating ESG factors in this way will not typically restrict the potential investable universe, but rather aims to ensure that relevant and material ESG risks are taken into account by analysts and/or portfolio managers in their decision-making, alongside other relevant and material financial risks.
– Ratings: The use and influence of our ESG ratings in specific investment strategies will vary, potentially significantly, depending on a number of factors including the nature of the asset class and the structure of the investment mandate involved. For an investment portfolio with a financial objective, and without specific ESG or sustainability objectives, a high or low ESG rating may not automatically lead to a buy or sell decision: the rating will be one factor among others that may help a portfolio manager in evaluating potential investments consistently
– Engagement activity: The applicability of Insight firm level ESG engagement activity and the outcomes of this activity relating to buy, hold and sell decisions made within specific investment strategies will vary, potentially significantly, depending on the nature of the asset class and the structure of the investment mandate involved.
– Reporting: The ESG approach shown is indicative and there is no guarantee that the specific approach will be applied across the whole portfolio.
– Performance/quality: The influence of ESG criteria on the overall risk and return characteristics of a portfolio is likely to vary over time depending on the investment universe, investment strategy and objective and the influence of ESG factors directly applicable on valuations which will vary over time.
– Costs: The costs described will have an impact on the amount of the investment and expected returns.