Key points
- New property listings rise 6.2% to 82,458 dwellings.
- Total listings rise by 3.9% amid a 1.2% decline in old listings.
- Distressed sales activity rise 3.3% with a 5.6% surge in Victorian distressed listings.
- Asking prices show a steady increase by 0.7%.
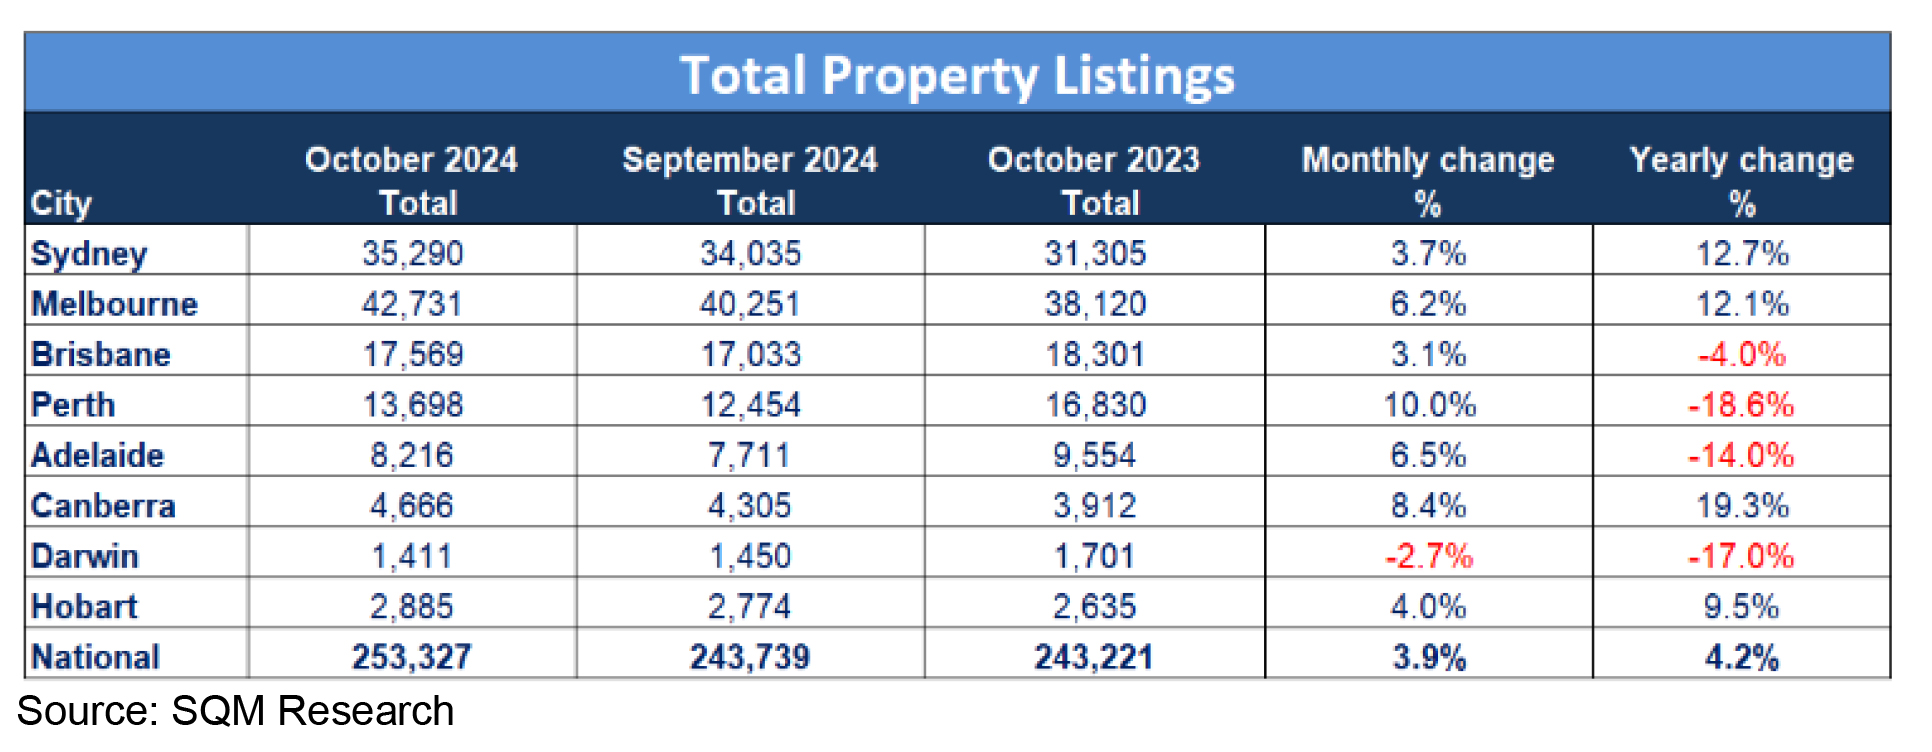
Total listings
According to data released by SQM Research, total nationwide residential property listings rose by 3.9% over the month of October, 2024, to 253,327 listed residential properties.
Perth led the rise with a significant monthly rise of 10.0%, followed by Canberra at 8.4%, and Adelaide with a 6.5% increase. Melbourne and Hobart also recorded increases of 6.2% and 4.0%, respectively. Sydney recorded a moderate rise of 3.7%, while Brisbane had a smaller increase of 3.1%. Conversely, Darwin was the only city to see a decrease, with listings down by 2.7%.
Over the past year to October, there was a national increase of 4.2% in total listings. Sydney and Melbourne experienced the most notable yearly growth at 12.7% and 12.1%, respectively. Canberra showed an even higher increase at 19.3%. Hobart recorded a yearly rise of 9.5%. However, some cities recorded declines over the past year, with Brisbane down by 4.0%, Perth by 18.6%, Adelaide down by 14% and Darwin down 17.0%.

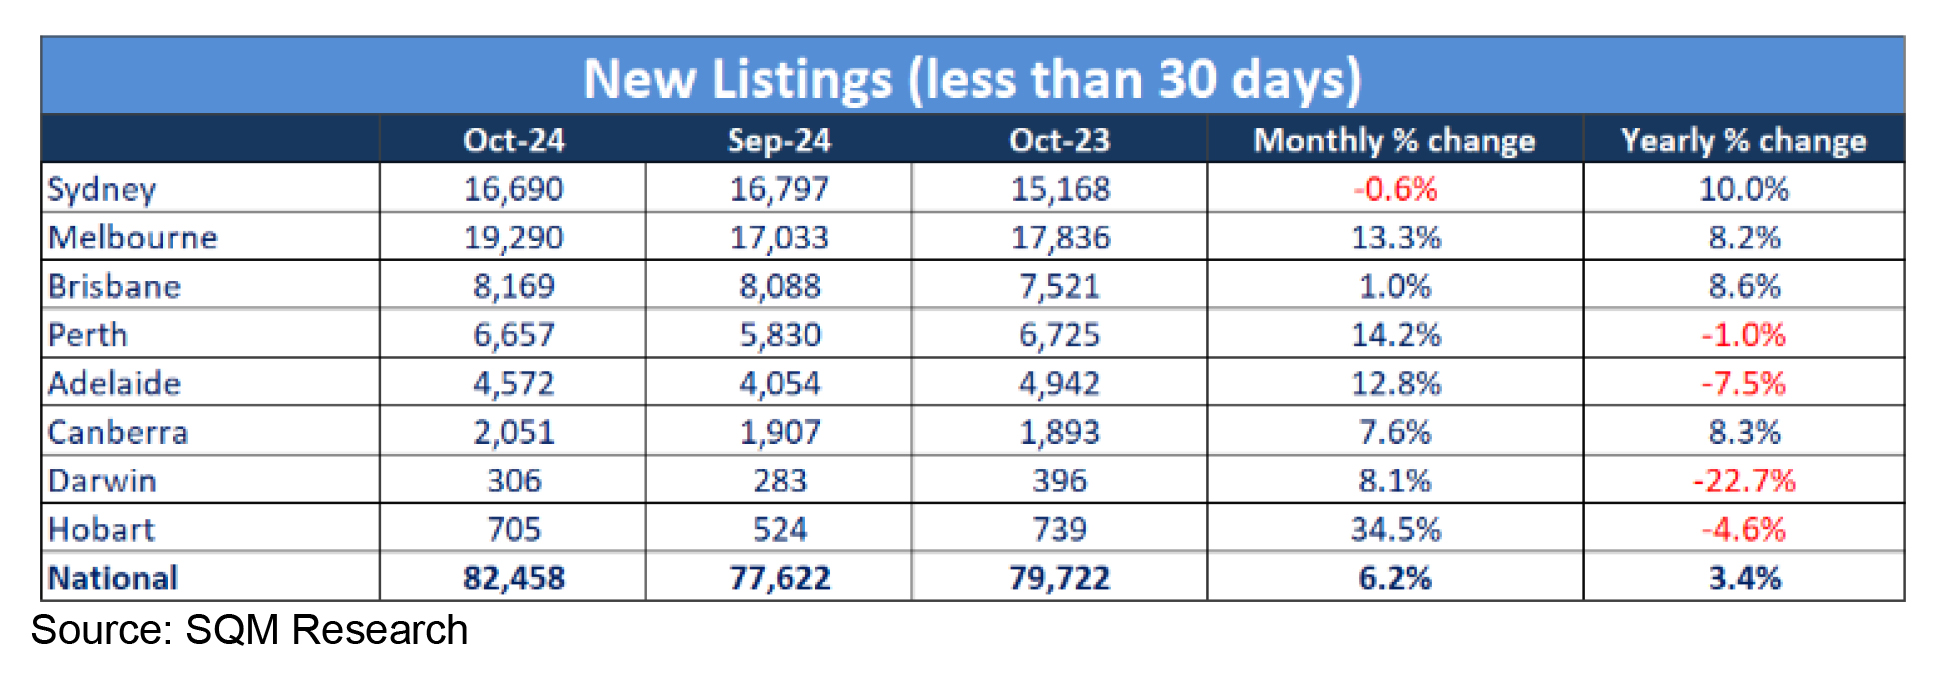
New listings
Nationally, new listings (less than 30 days) recorded a 6.2% increase in October 2024, reaching 82,458 properties, up from 77,622 in September 2024. This upward trend was evident in multiple key markets.
Hobart recorded the largest monthly increase in new listings, rising by 34.5%. Perth and Melbourne followed with increases of 14.2% and 13.3%, respectively. Adelaide saw a notable rise of 12.8%, while Canberra recorded an increase of 7.6%. Darwin and Brisbane had smaller monthly gains of 8.1% and 1.0%, respectively. Conversely, Sydney experienced a slight monthly decline, with new listings decreasing by 0.6%.
Year-over-year, national new listings showed a 3.4% increase. Sydney led the annual growth with a 10.0% rise in new listings, followed by Brisbane with an 8.6% increase. Melbourne and Canberra recorded yearly increases of 8.2% and 8.3%, respectively. Conversely, Darwin saw the most significant annual decrease at 22.7%, while Adelaide and Hobart also experienced declines of 7.5% and 4.6%, respectively.

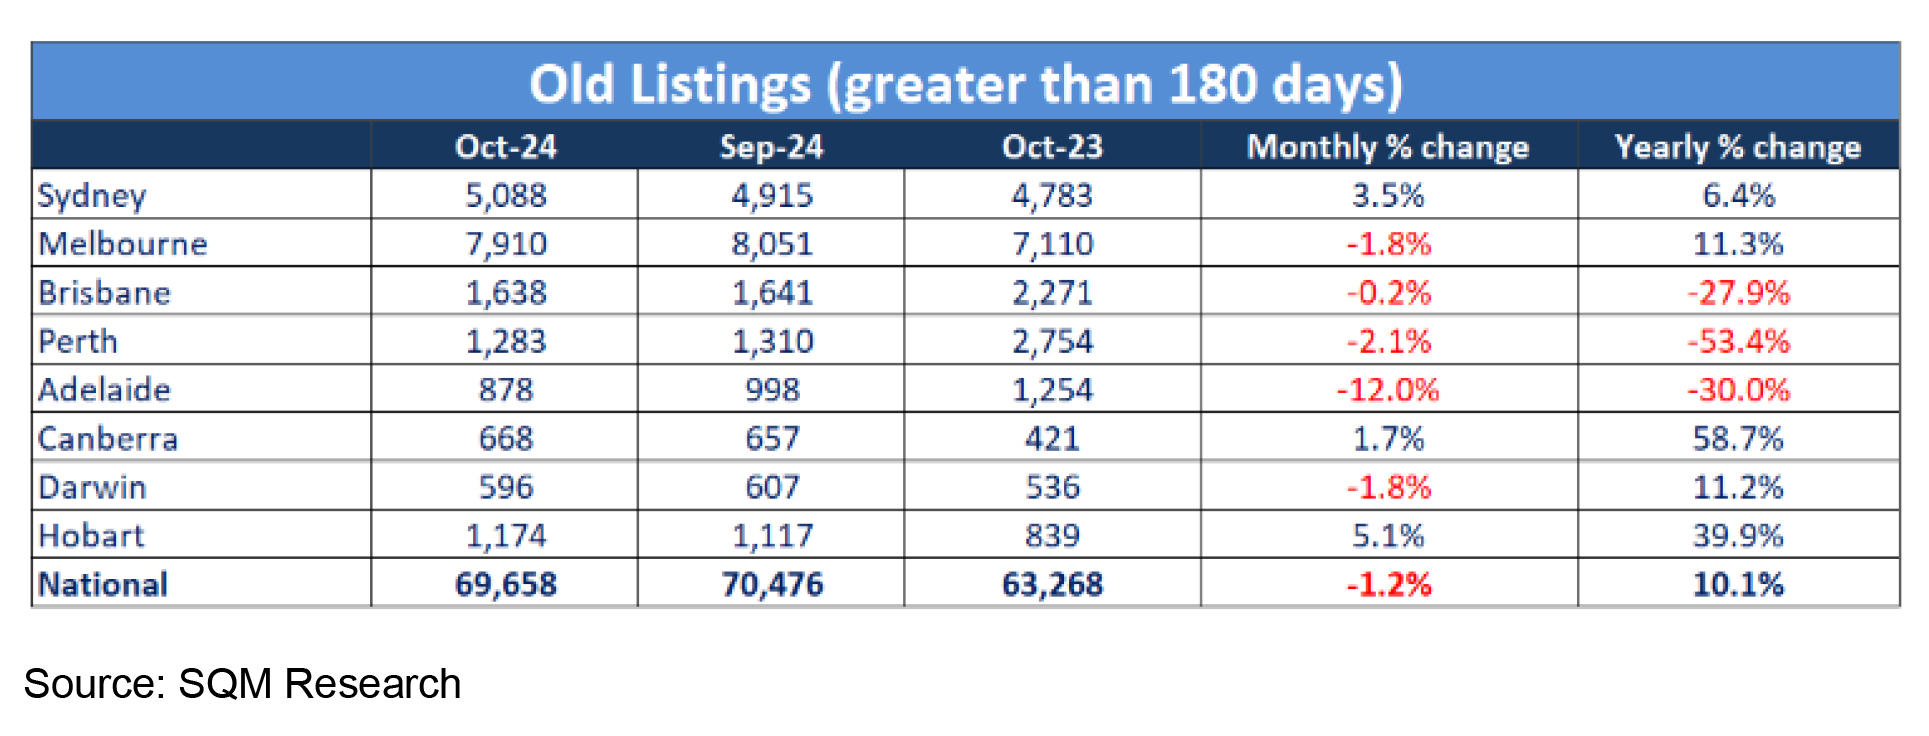
Old listings
In October 2024, the number of older listings (properties listed for over 180 days) continued to decline, decreasing by 1.2% from the previous month. This brought the total to 69,658 properties, down from 70,476 in September 2024. Most cities experienced a reduction in older stock during this period, with Adelaide recording the most significant drop at 12.0%. This was followed by Perth at 2.1%, Melbourne at 1.8%, and Brisbane with a modest decrease of 0.2%.
Conversely, Hobart, Canberra, and Sydney recorded increases in older listings, with rises of 5.1%, 1.7%, and 3.5%, respectively.
Year-over-year trends also emerged, revealing a national increase of 10.1%. Canberra led this upward trend, experiencing a significant 58.7% rise in older listings compared to the previous year. In contrast, Perth faced the most dramatic decline, with a 53.4% decrease, indicating a significant reduction in long-term unsold properties.
Overall, the national trend reflects a 10.1% increase in older property listings over the past year, highlighting varying market dynamics across different cities. The increase in older listings in certain areas may suggest a cooling in specific market segments, where properties are taking longer to sell.

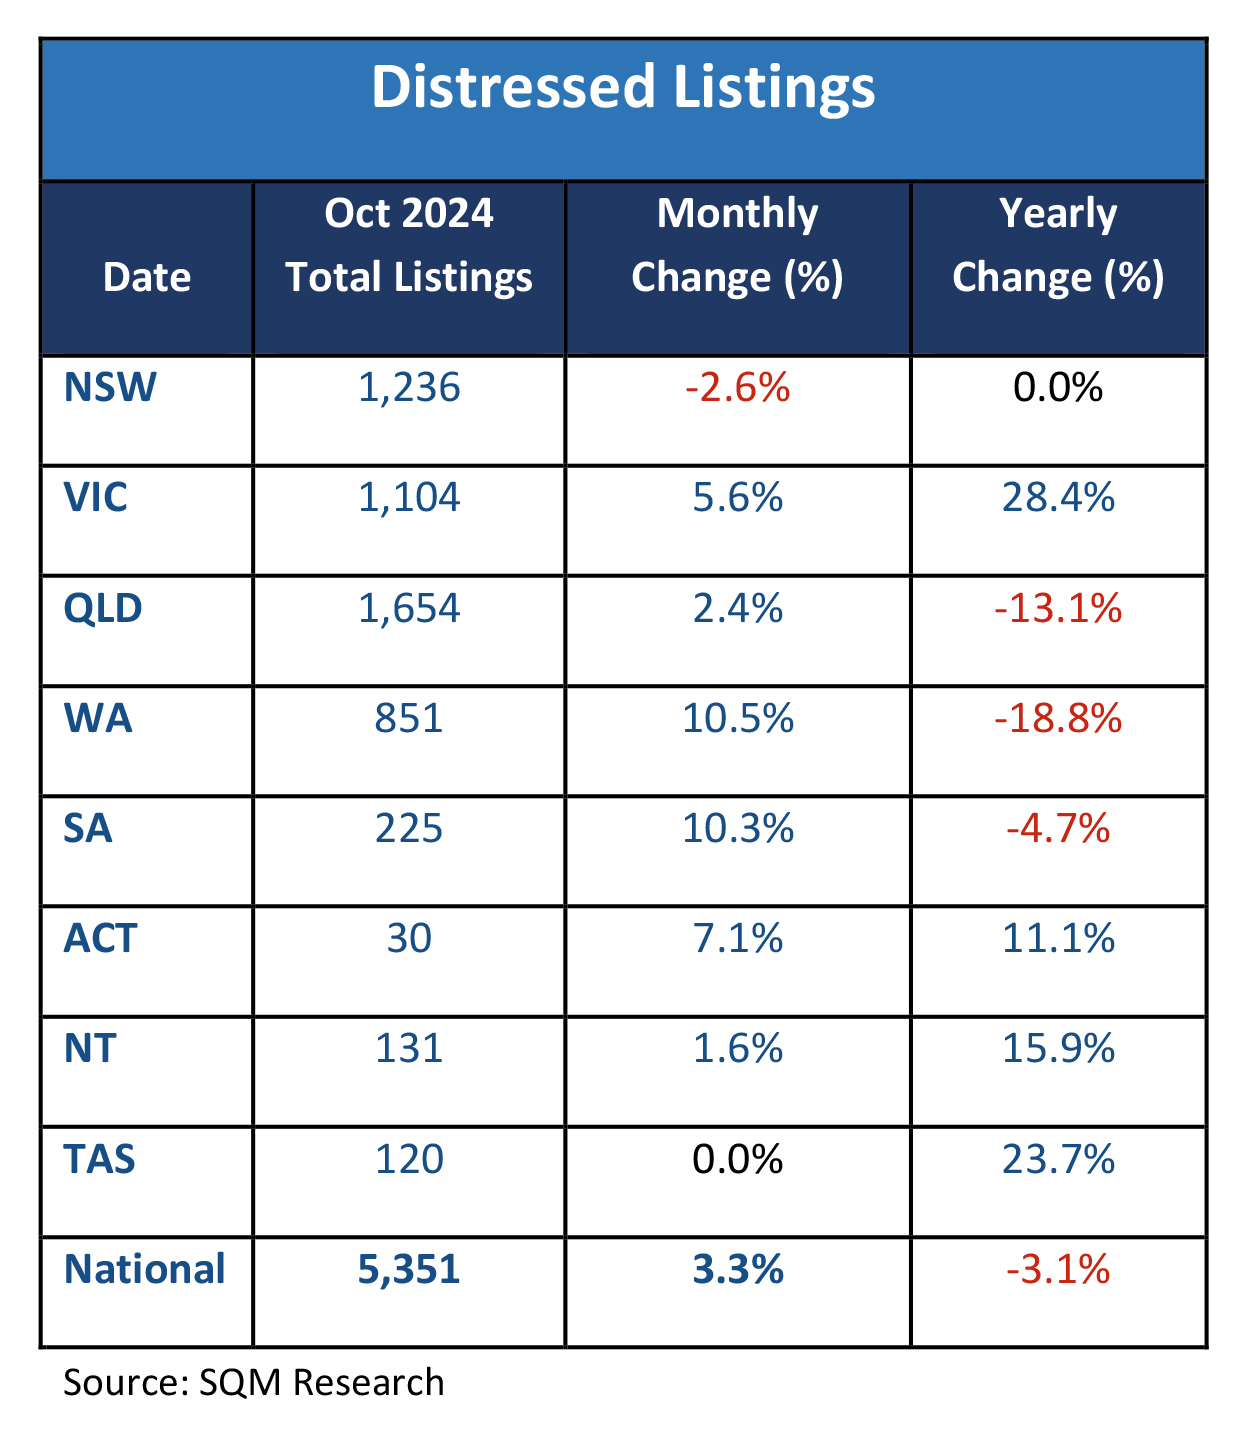
Distressed listings
According to SQM Research’s October 2024 report, the number of residential properties selling under distressed conditions in Australia rose to 5,351, marking a 3.3% increase from the previous month. The state-by-state data reveals significant variations across the country.
NSW reported a 2.6% decrease in distressed listings, aligning with the previous year’s figures. In contrast, VIC experienced a notable increase of 5.6%. QLD saw a modest rise of 2.4%, while WA recorded a dramatic 10.5% increase. SA mirrored WA’s trend with a 10.3% rise. The ACT also experienced a 7.1% increase in distressed listings. The NT reported a minor increase of 1.6%, while TAS remained unchanged.
Over the past 12 months, NSW has held steady, while VIC saw a substantial increase of 28.4%. The ACT, NT, and TAS recorded increases of 11.1%, 15.9%, and 23.7%, respectively. In contrast, QLD, WA, and SA experienced declines of 13.1%, 18.8%, and 4.7%.

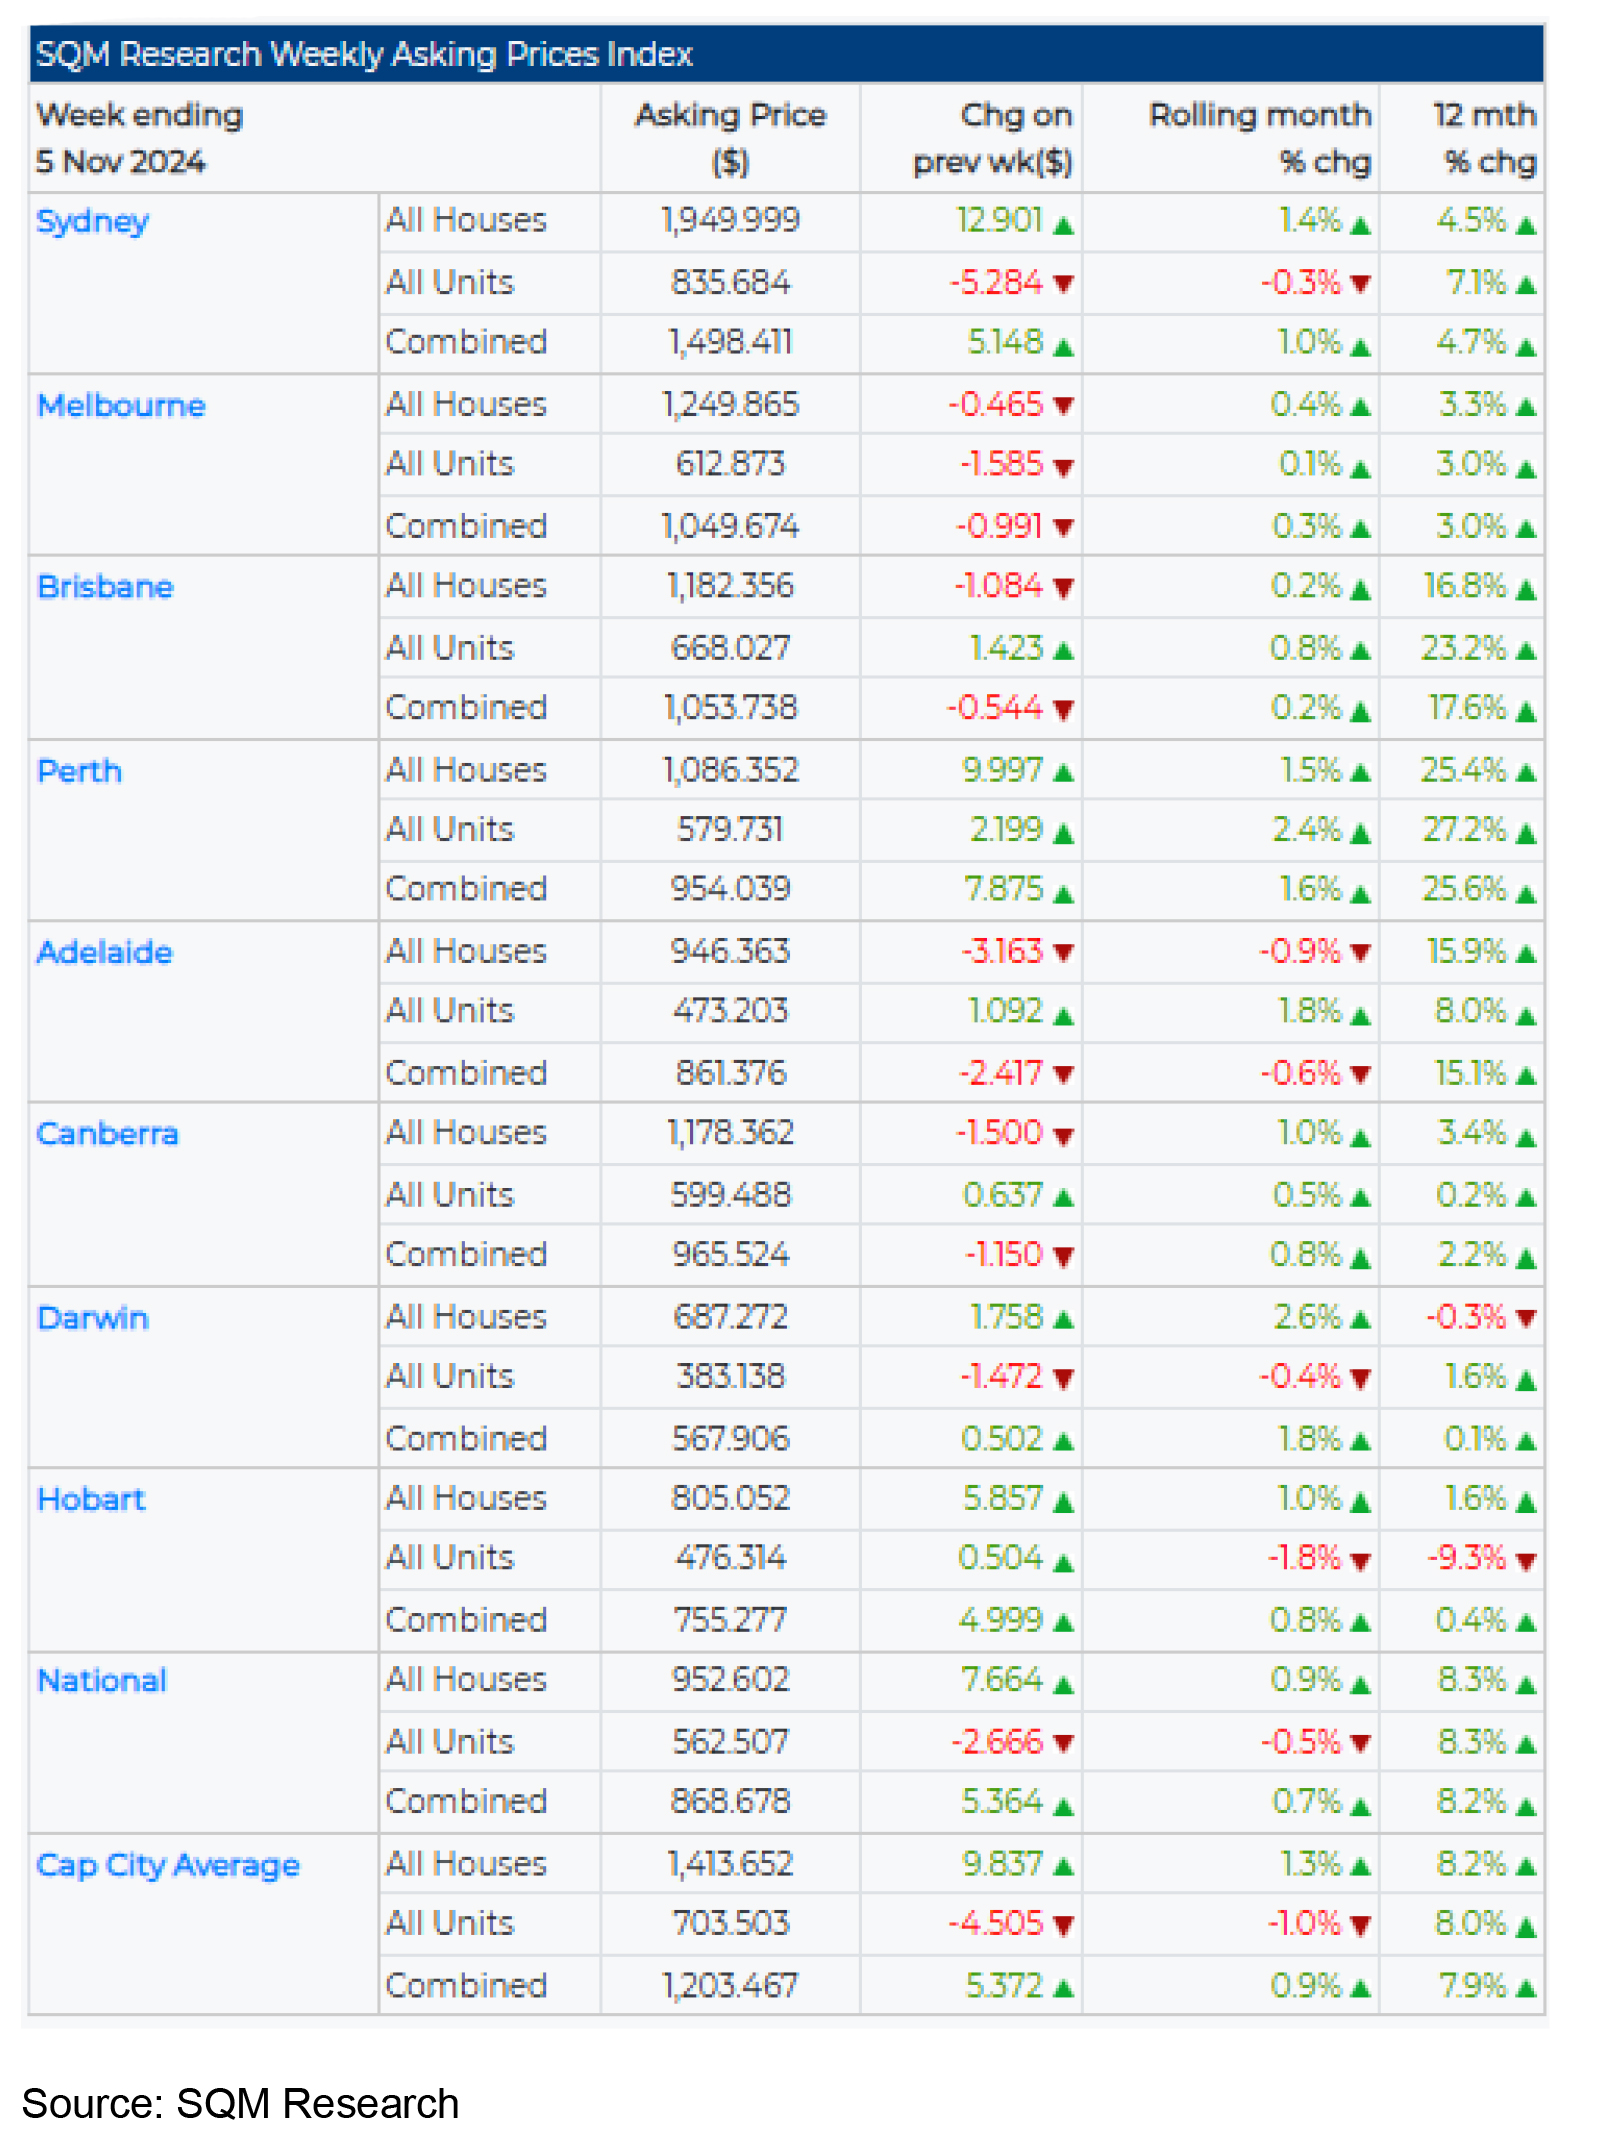
Asking prices
Nationally, the asking prices for houses and units reflect contrasting trends. House prices have risen by 0.9%, while unit prices have slightly declined by 0.5%, resulting in a modest overall increase of 0.7%. Across all capital cities, the average asking price recorded a 0.9% increase, with house prices up by 1.3% and unit prices dramatically falling by 1.0%.
In Sydney, asking prices witnessed a rapid rise by 1.0%, with house prices rising by 1.4%,, leading to a combined rise for the city. However, Sydney units’ prices experiencing a slight 0.3% decrease. Melbourne’s market remained stable, with a 0.4% increase in house prices and a 0.1% rise for units, resulting in a combined monthly increase of 0.3%.
Adelaide presented a unique trend with a combined decrease of 0.6% in asking prices. Unit prices greatly rose by 1.8%, but house prices declined by solid 0.9%. In Hobart, the market showed a contrasting pattern, where unit prices dropped significantly by 1.8%, while house prices increased by 1.0%, resulting in an overall combined rise of 0.8%.
Perth continued to demonstrate growth, with unit prices increasing by 2.4% and house prices by 1.5%, yielding a combined gain of 1.6%. Brisbane showed steady performance as well, with house prices edging up by 0.2% and units by 0.8%, producing a combined increase of 0.2%. Canberra displayed similar stability, with house prices rising by 1.0% and unit prices by 0.5%, leading to a combined increase of 0.8%.
Darwin marked a notable increase in house asking prices, which surged by 2.6%. However, unit prices have declined by 0.4%, resulting in a combined increase of 1.8% for the city.
Overall, the national trend reflects a slight increase in average asking prices, suggesting a generally stable market with pockets of growth balanced by softer demand in certain areas.