Economic Update
Year in Review 2015/16: Solid growth, low inflation
Economic & financial perspectives
- Flat year for shares: Total returns on Australian shares (All Ordinaries Accumulation index) are currently up 0.6 per cent over 2015/16 (20-year average +10.8 per cent).
- Other returns higher: Returns on dwellings are up 13.9 per cent while returns on government bonds have lifted by 7.3 per cent. So for the third year, bonds, property and shares have all lifted over the past year.
What does it all mean?
- In just over a week’s time investors will be inundated with data showing how investments, financial markets and economies have performed over the past year. But with the 2015/16 year now 97 per cent complete, we can provide an early snapshot on how things have tracked.
- Overall, it has been another challenging year, but one that should provide satisfaction for Australian policymakers. Economic growth has lifted, not slowed. That is despite the transition from the once-in-a-century mining construction boom to mining production and housing-driven growth. The inflation rate has eased, in line with global experience. Cash rates were cut to record lows in May. Iron ore and oil prices fell, but then rebounded. The US lifted interest rates for the first time in nine years. And the financial year is ending with jitters about the UK vote on European Union membership.
- But despite the challenges, returns on shares, residential property and bonds have all lifted over the past year while interest rates and the Aussie dollar are lower than a year ago. And the record economic expansion continues.
- The economy has grown by around 3.0 per cent in 2015/16 and we expect similar growth of around 3.0 per cent in 2016/17. Underlying inflation may lift from 1.6 per cent to 2.0 per cent over the coming financial year while unemployment may ease modestly from 5.7 per cent currently to around 5.5 per cent.
- It is clear that Australia is one of the great global survivors. Inflation is under control; while record low interest rates and a lower dollar are maintaining the record economic expansion into the 26th year.
What does the data show?
Interest rates
- The cash rate stands at a record low of 1.75 per cent, down from 2.00 per cent at the end of June 2015, and courtesy of a quarter per cent rate cut in May 2016.
- The market-determined 90-day bank bill rate has fallen from 2.15 per cent to 2.00 per cent over 2015/16. Yields on the long bond – 10-year government bonds – have held between 2.02 per cent and 3.11 per cent. Long-bond yields hit record lows on June 16 and now stand at 2.12 per cent.
Currencies
- The Aussie dollar has fallen around 4 per cent over 2015/16. The Aussie started the year around US77 cents and is currently around US74 cents. We have calculated that the Aussie is 76th strongest against the US dollar of 117 currencies tracked. The strongest currencies have been the Japan yen (up 15 per cent), Ghana cedi (up 13 per cent), and Iceland krone (up 7 per cent). Weakest currencies have been Surinam dollar (down 114 per cent), Malawi kwacha (down 63 per cent) and Mozambique metical (down 59 per cent).
- In the six months of 2016, the Aussie dollar is up 2 per cent against the US dollar, making it the 38th strongest of 117 currencies tracked. The strongest currencies have been the Brazil real (up 14 per cent), Japan yen (up 13 per cent), and Russia rouble (up 11 per cent). Weakest currencies have been Surinam dollar (down 76 per cent), Venezuela bolivar (down 59 per cent) and Mozambique metical (down 30 per cent).
- The high for the Aussie dollar in 2015/16 was US78.48 cents on April 21 2016 and the low was US68.24 cents on January 15 2016.
Commodities
- The Commodity Research Bureau index of commodities prices has fallen around 15 per cent over 2014/15, under-performing the Aussie dollar (down 4 per cent).
- In terms of those commodities with particular relevance to investors or the economy as a whole, the iron ore price has fallen 16 per cent over 2015/16 with thermal coal down 13 per cent, beef down 11 per cent, crude oil down 18 per cent, nickel down 23 per cent and copper down 21 per cent. Amongst the gains has been gold, up 10 per cent, and sugar, up 67 per cent.
Sharemarket
- The Australian sharemarket started 2015/16 with the All Ordinaries at 5,451.2 and the ASX200 at 5,459.0. Currently the All Ords is near 5,249.3 points (down 3.7 per cent) with the ASX200 at 5,162.7 (down 5.4 per cent). We estimate that Australia is 24th of 73 global bourses and only 18 bourses have managed gains. Best performer has been Latvia (up 41 per cent) followed by Slovakia (up 21 per cent) and Hungary (up 20 per cent). Worst performers have been Greece (down 43 per cent), Russia (down 29 per cent) and Columbia (down 23 per cent).
- In the six months of 2016, the All Ordinaries has fallen by 1.8 per cent, ranking Australia 35th of 73 nations. The strongest performer has been Peru (up 39 per cent), followed by Russia (up 20 per cent) and Pakistan (up 18 per cent). Worst performer has been Italy (down 21 per cent), Zimbabwe (down 19 per cent) and China (down 18 per cent).
Investment returns
- Total returns on Australian shares (All Ordinaries Accumulation index) are currently up 0.6 per cent over 2015/16. Returns on dwellings are up 13.9 per cent while returns on government bonds have lifted by 7.3 per cent. Returns on bonds, property and shares are all up over the year for the third straight year.
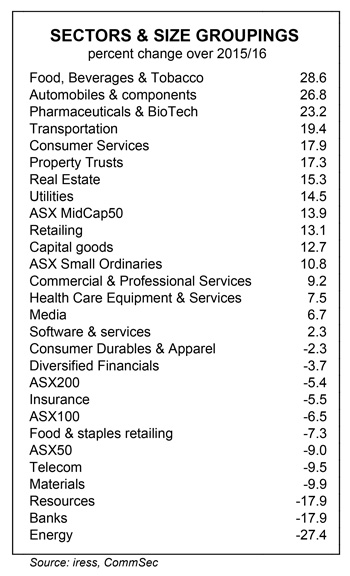
Sectors & size groupings
- Of the 21 identified industry sub-sectors, only eight have recorded declines so far in 2015/16.
- Leading the gains has been Food, Beverages & Tobacco (up almost 29 per cent) followed by Automobiles & Components (up almost 27 per cent) and Pharmaceuticals & BioTech (up 23 per cent)
- At the other end of the scale, Energy has fallen by 27 per cent, followed by the large Banks sector (down 18 per cent) and equally large Materials sector (down 10 per cent).
- Of the size categories, the MidCap 50 index has out-performed, (up 14 per cent), from the Small Ordinaries (up 11 per cent), ASX 100 (down 6.5 per cent) and ASX 50 (down 9 per cent).

 What are the implications for investors?
- There are still a few days to go until the end of the financial year. And there is the small matter of the UK referendum to decide membership of the European Union on June 23.
- At present, total returns on shares are still positive, but only just. Sharemarket returns have only fallen once in the past seven years. But an investor that has employed a diversified strategy across asset classes would be reasonably pleased with the performance over the past year.
- The economic and financial metrics remain encouraging. Australia has underlying inflation below the Reserve Bank’s 2-3 per cent target band at 1.6 per cent. Economic growth is at 3½-year highs at 3.1 per cent. The cash rate is at record lows. And unemployment is near 3-year lows at 5.7 per cent,
- Housing is providing the momentum for the economy with home building and purchase especially driving the NSW, Victorian and ACT economies.
- Over the coming year more and more apartments will be completed with stock hitting the market. So supply and demand are likely to prove more balanced in 2016/17, restraining growth in home prices.
- CommSec expects the All Ordinaries index to be near 5,500-5,700 points at end-December 2016 and 5,700-5,900 points in June 2016. Home prices are likely to grow by 5-7 per cent in 2016/17 with inflation averaging 2.0 per cent. The Aussie dollar is seen at US73 cents in December and US75 cents in June 2016.
- The low inflation/low interest rate environment means lower nominal investment returns. So investors will need to be alert to the returns achieved across sharemarket sectors and across asset classes to ensure that their savings are keeping pace with the cost of living.