
Five charts to keep an eye on – making sense of this unique investment environment
Following the US election, we have seen bond rates continuing to increase, a stronger US dollar, firmer commodity prices, and a US stock market at all-time highs.
How long will this unique investment environment last?
The prospect of rising US interest rates…
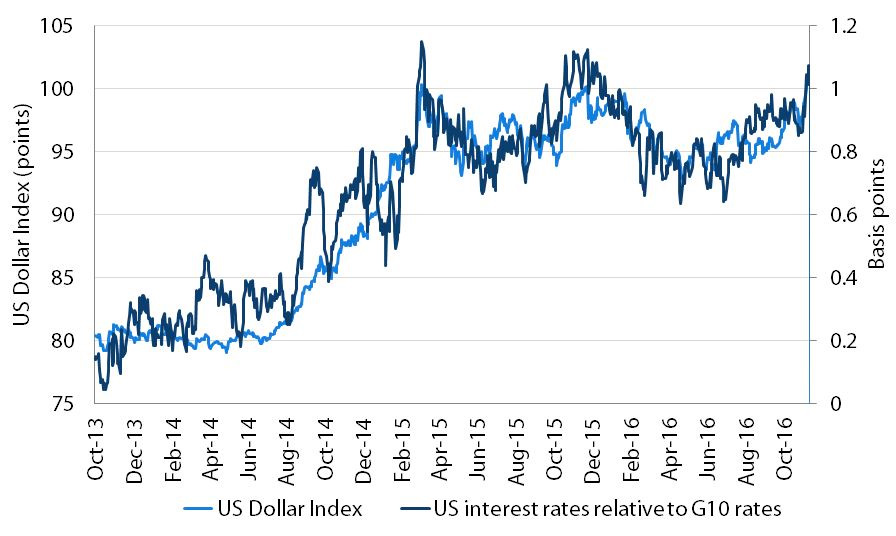
President-elect Donald Trump’s bullish fiscal stimulus plan has seen US real interest rates rise, relative to other G10 countries.
While fiscal expansion is obviously negative for long bond yields, it also raises the prospect of a more hawkish US Federal Reserve.
This has resulted in higher US bond yields, relative to other countries, and a strong US dollar.
Chart 1: Rising US dollar and relative 10-year bond yields
…has driven the US dollar and inflation pricing higher…
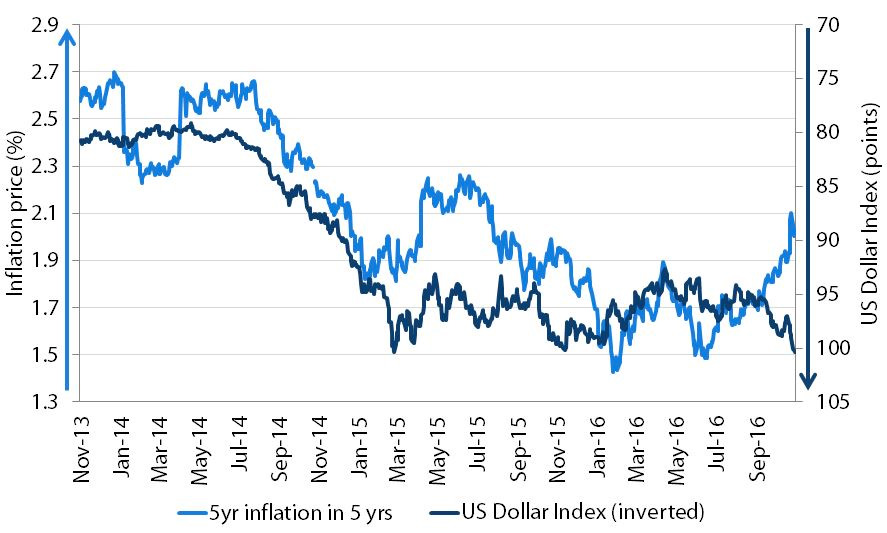
Fiscal expansion, at a time when the US economy seems to have reduced much of its slack, has seen markets pricing in a rise in inflation. This has driven up real and nominal bond rates.
Interestingly, the pricing of expected five-year inflation in five years’ time has separated from its long-term relationship with the US dollar.
Does this mean bond rates have gone too far?
Chart 2: US dollar and US inflation are no longer linked
…with commodities rising around the world…
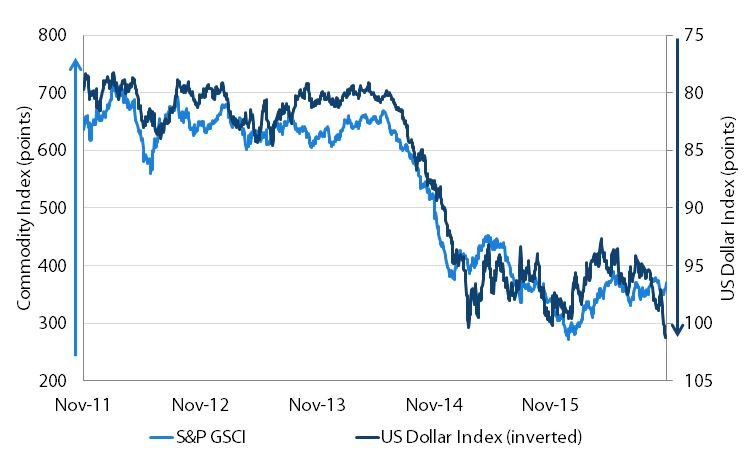
Although it has happened previously, there remains a question as to whether commodity prices can rise against a higher US dollar, even if the higher US dollar is due to a more hawkish US Federal Reserve.
In the past, a stronger US dollar signals tighter financial conditions which has caused commodity prices to fall.
This has hurt emerging market countries and those companies with large borrowing requirements, especially if these are in US dollars.
The rise in commodity prices this time around, especially metals, reflects optimism around US election promises for increased infrastructure spending.
The question is, can this optimism outweigh tighter US dollar conditions?
Chart 3: Commodities are rising, despite a strong US dollar
…especially metals in Australia…
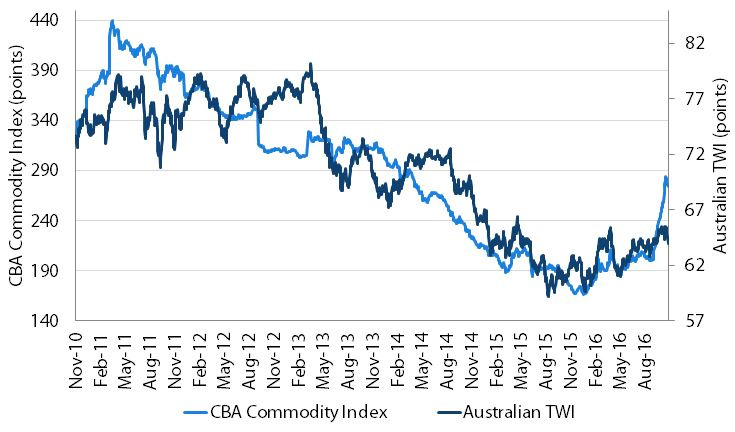
A rise in the US dollar has kept Australia’s Trade Weighted Index steady, despite a massive jump in Australian commodity prices, especially coal and iron ore.
This should allow the Reserve Bank to keep interest rates on hold.
This is a reversal from the situation in 2012, which saw the Australian economy badly hurt by an Australian dollar that was too strong, and only belatedly reacted to falling commodity prices.
If commodities, especially metals, continue to not react to a stronger US dollar, then concerns that inflation may be rising should remain.
Chart 4: Australian commodity prices continue to rise
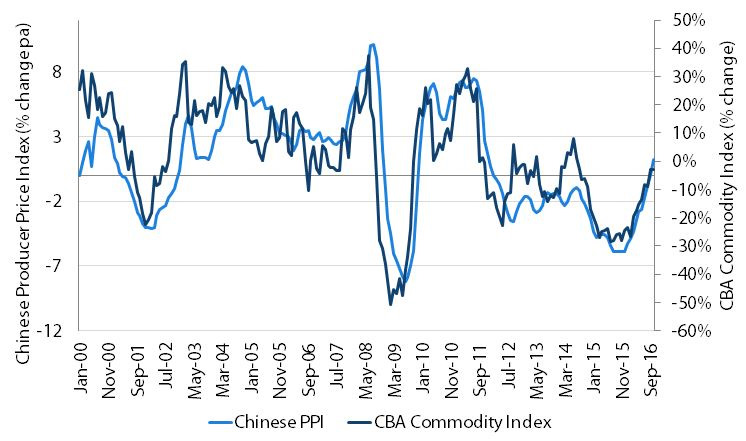
…as inflation starts to rise again in China.
A rise in Chinese inflation, as measured by its Producer Price Index, could suggest that the recent deflationary scare may have passed.
Could the threat of deflation even return, given we now have a stronger US dollar and a more aggressive US Federal Reserve?
Are investors and the bond market turning too quickly, thinking that rising inflation in China is about to return?
Or can commodities keep going?
Chart 5: Strong Chinese demand for Australian commodities
What this means for investors
Commodity prices (especially metals) are rising strongly in an environment where, previously, they would be stable, or even falling.
The change in several historical price relationships (such as the US dollar and commodities) has created a unique investment environment.
Is optimism around the US President-elect’s fiscal expansion masking the true deflationary picture?
We would suggest it has, and will continue to monitor the situation closely.
By Roger Bridges, Global Rates & Currencies Strategist
———


