
Understanding of the importance of global dividends and the role these play in generating income for investors.
At the end of November 2025, Australians had more than $242 billion[1] invested in cash. While it’s not uncommon for investors to seek the safe haven cash offers during periods of market volatility, with 12-month term deposit rates at around 4.10 percent[2], the return barely covers inflation. This is why investors – especially self-funded retirees – need to examine all income options available to them.
The need for income becomes increasingly important when you consider the millions of Australians expected to retire in the coming years. Projections suggest a potential doubling of retirements to around 300,000 per annum as the ‘silver tsunami’ of Baby Boomers moves into this life stage. In addition to this is the older cohort of Generation X, with approximately 710,000 individuals planning to retire within the next five years[3].
These retirees require income. While Australian investors love their income producing blue chip shares, a growing number of income-generating global stocks provide an opportunity to diversify clients’ income sources.
The benefits of global dividends
Allocating investment capital to global equities for income provides a powerful combination of portfolio diversification, long-term capital appreciation and potentially consistent yield. By looking beyond the Australian market, investors can access a vast spectrum of high-quality income opportunities and sectors that are often underrepresented in the domestic market.
Investing globally for dividends is about building a more resilient and growth-oriented income stream and can offer the following benefits.
1. Diversification and risk reduction
By investing in global equities, investors can spread their capital across different geographical regions and sectors. This diversification helps reduce the risk associated with a downturn in any one country or industry. Economic conditions, market cycles and political factors vary from country to country, so when one market underperforms, another might thrive. This balance can help stabilise income and returns over time.
Further, exposure to global equites helps reduce concentration risk. The Australian market is heavily concentrated in Financials (banks) and Materials (mining). Global markets provide exposure to dividend-paying companies, large and small, in sectors such as Technology, Healthcare and Consumer Staples, which are less prevalent in Australia.
2. Access to dividend paying companies
Global equities include companies with strong histories of paying dividends, often from industries less represented in the Australian markets. Many large multinational companies, especially in sectors like utilities, healthcare and consumer goods, have consistent dividend policies. This regular income stream is especially attractive for income-focused investors.
Many global markets, particularly the US, feature companies known as “dividend aristocrats”, firms that have increased their dividend payouts every year for 25 consecutive years or more. This offers investors stability, which is especially important for retirees.
3. Income and capital growth
Strong free cash flow allows companies to simultaneously reward shareholders with dividends while driving the growth that increases share value. In many cases, high-quality dividend payers demonstrate a financial discipline that frequently correlates with superior capital growth.
Components of equity returns
Most investors aim to grow their wealth while avoiding significant losses. Equities have a long-standing track record as the most effective vehicle for this growth. Investors profit from equities in two ways: through rising share prices and regular dividend payments.
A company’s share price is calculated by multiplying its earnings by its price earnings ratio; therefore, any change in price is ultimately the result of changes in either company profitability or the valuation multiple the market is willing to pay for the stock.
As such, the return from equities is the result of three factors: dividends, the change in earnings and the change in the price earnings multiple. Of these, history shows that earnings and dividends are the key drivers for share price valuation (figure one).
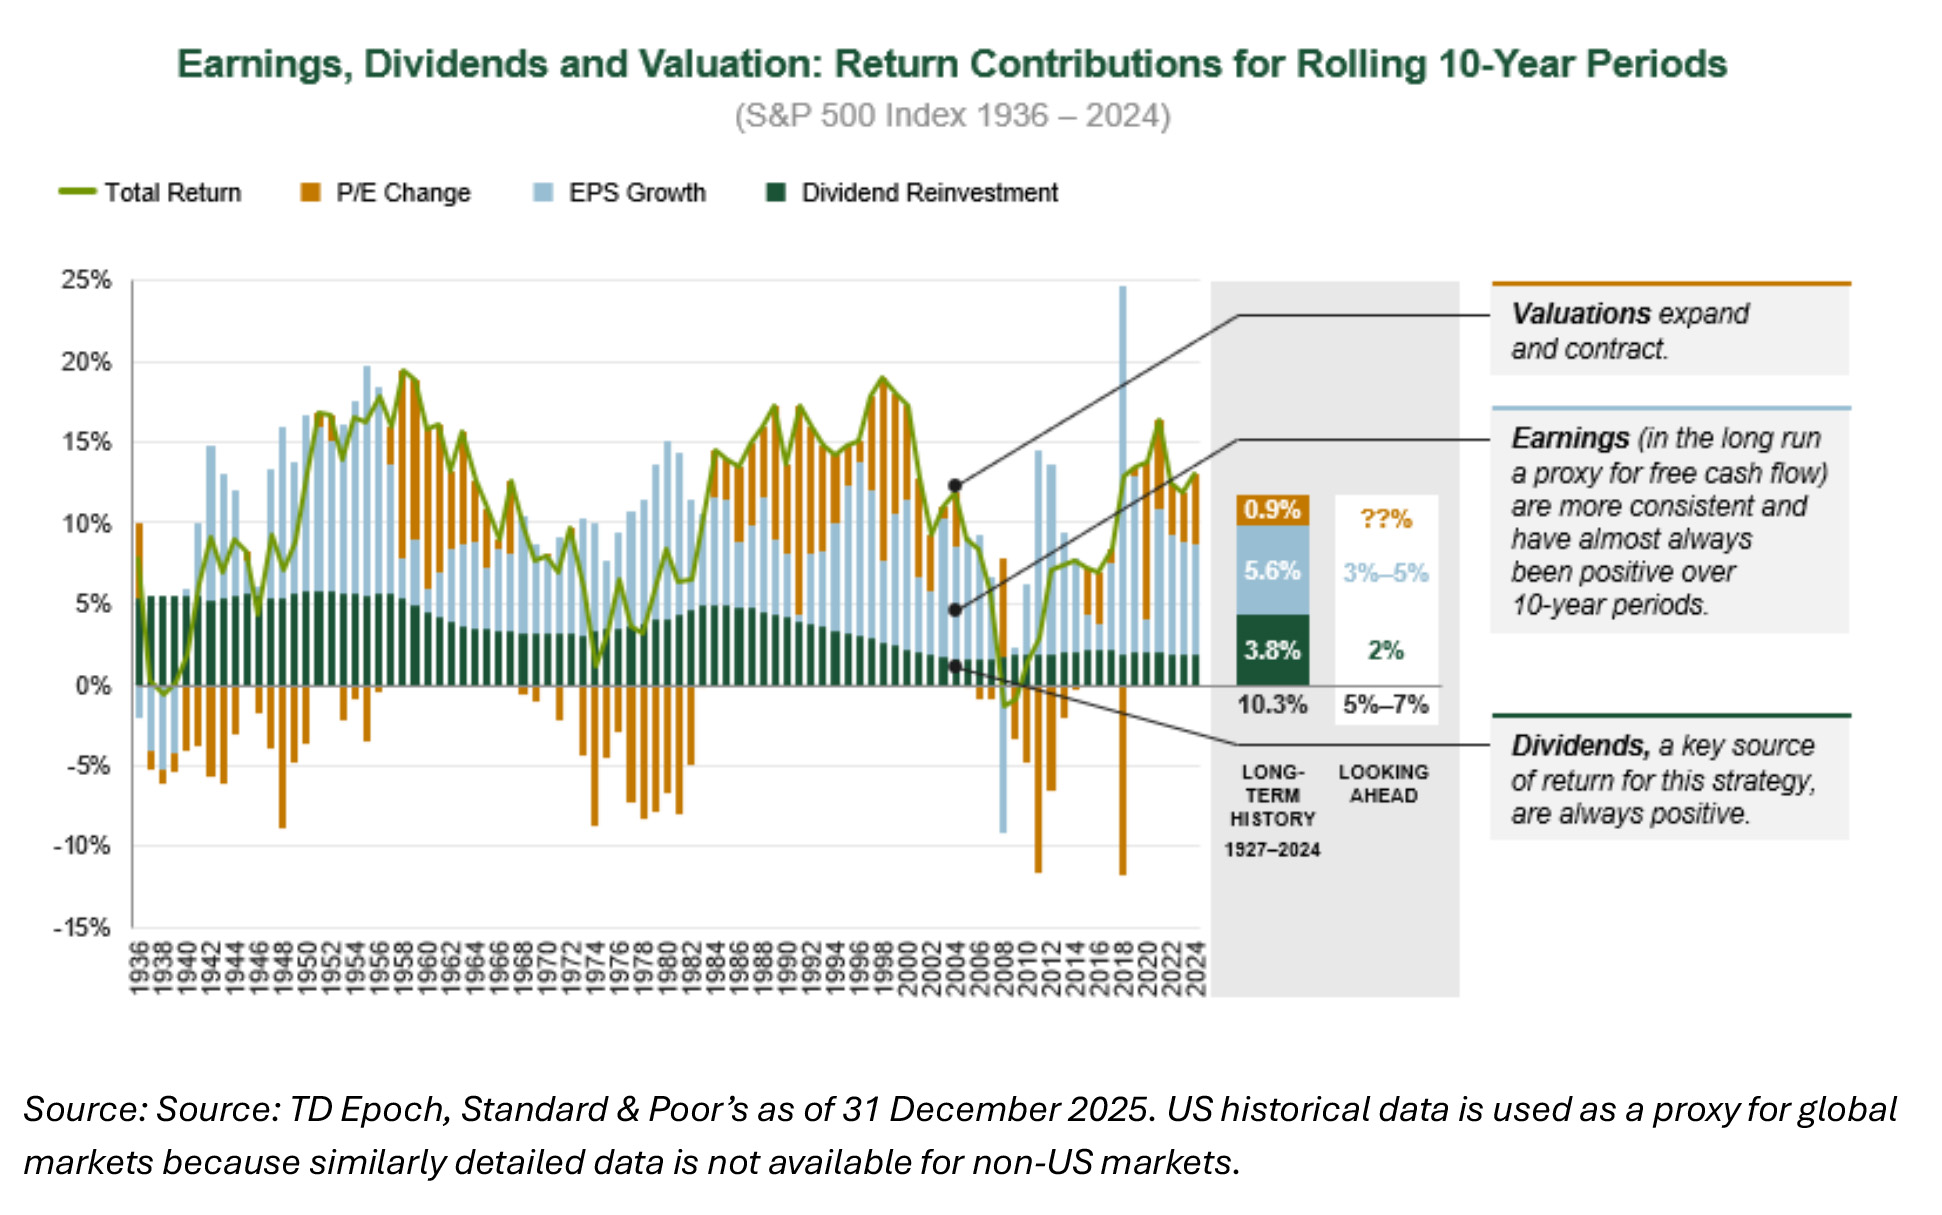
Figure one illustrates how the rolling 10-year return for the S&P 500 Index is broken down between those three components going back to the 1930s. Dividends have consistently been a positive contributor in every 10-year time period, and earnings have contributed positively in all but five of the 87 rolling 10-year periods.
The contribution from dividends appears to have decreased starting in the early 1990s; this is due to regulatory changes made ten years earlier that made share buybacks an attractive and tax-efficient alternative to cash dividends. Consequently, companies increasingly used share buybacks as a mechanism for returning cash to shareholders.
Because buybacks reduce the outstanding share count, they tend to drive up earnings per share, so some of what used to show up in this analysis as the contribution of dividends has more recently been transferred to the earnings contribution.
It is important to note that it’s exceptionally rare for one component to be the dominant driver of returns…it is even more rare for that component to be the company’s valuation. According to TD Epoch, in the period 1927-2024, the S&P500 delivered an average return of 10.3 percent. Of this, valuations accounted for just 0.9 percent of this return, while earnings and dividends accounted for 5.6 percent and 3.8 percent respectively.
The change in price earnings multiples shown in figure one has constituted the biggest ‘swing factor’ between those periods when shares have performed particularly well (as they did in the 1980s and 1990s) and when they have performed particularly poorly (as they did in the 1970s and from 2008-2014).
Over the long term, these swings in price earnings multiples have resulted in a contribution of less than one percent to the cumulative return of the S&P 500. Dividends and earnings have driven most of the returns.
Why dividend policies matter
The classic Wall Street adage, ‘profits are a matter of opinion, but dividends are matter of fact,’ highlights why income-producing stocks often show resilience during market volatility. While reported earnings rely on accounting estimates and complex valuations that can be subject to interpretation, dividends represent a tangible cash distribution.
Consequently, dividend paying companies generally provide investors with tangible returns on a regular basis irrespective of market conditions. Dividend payers tend towards steadier returns, less speculative valuations and heightened resilience through challenging and uncertain market environments. Companies that consistently pay dividends, and especially those that grow their dividends, are empirically proven to possess lower volatility than those who do not.
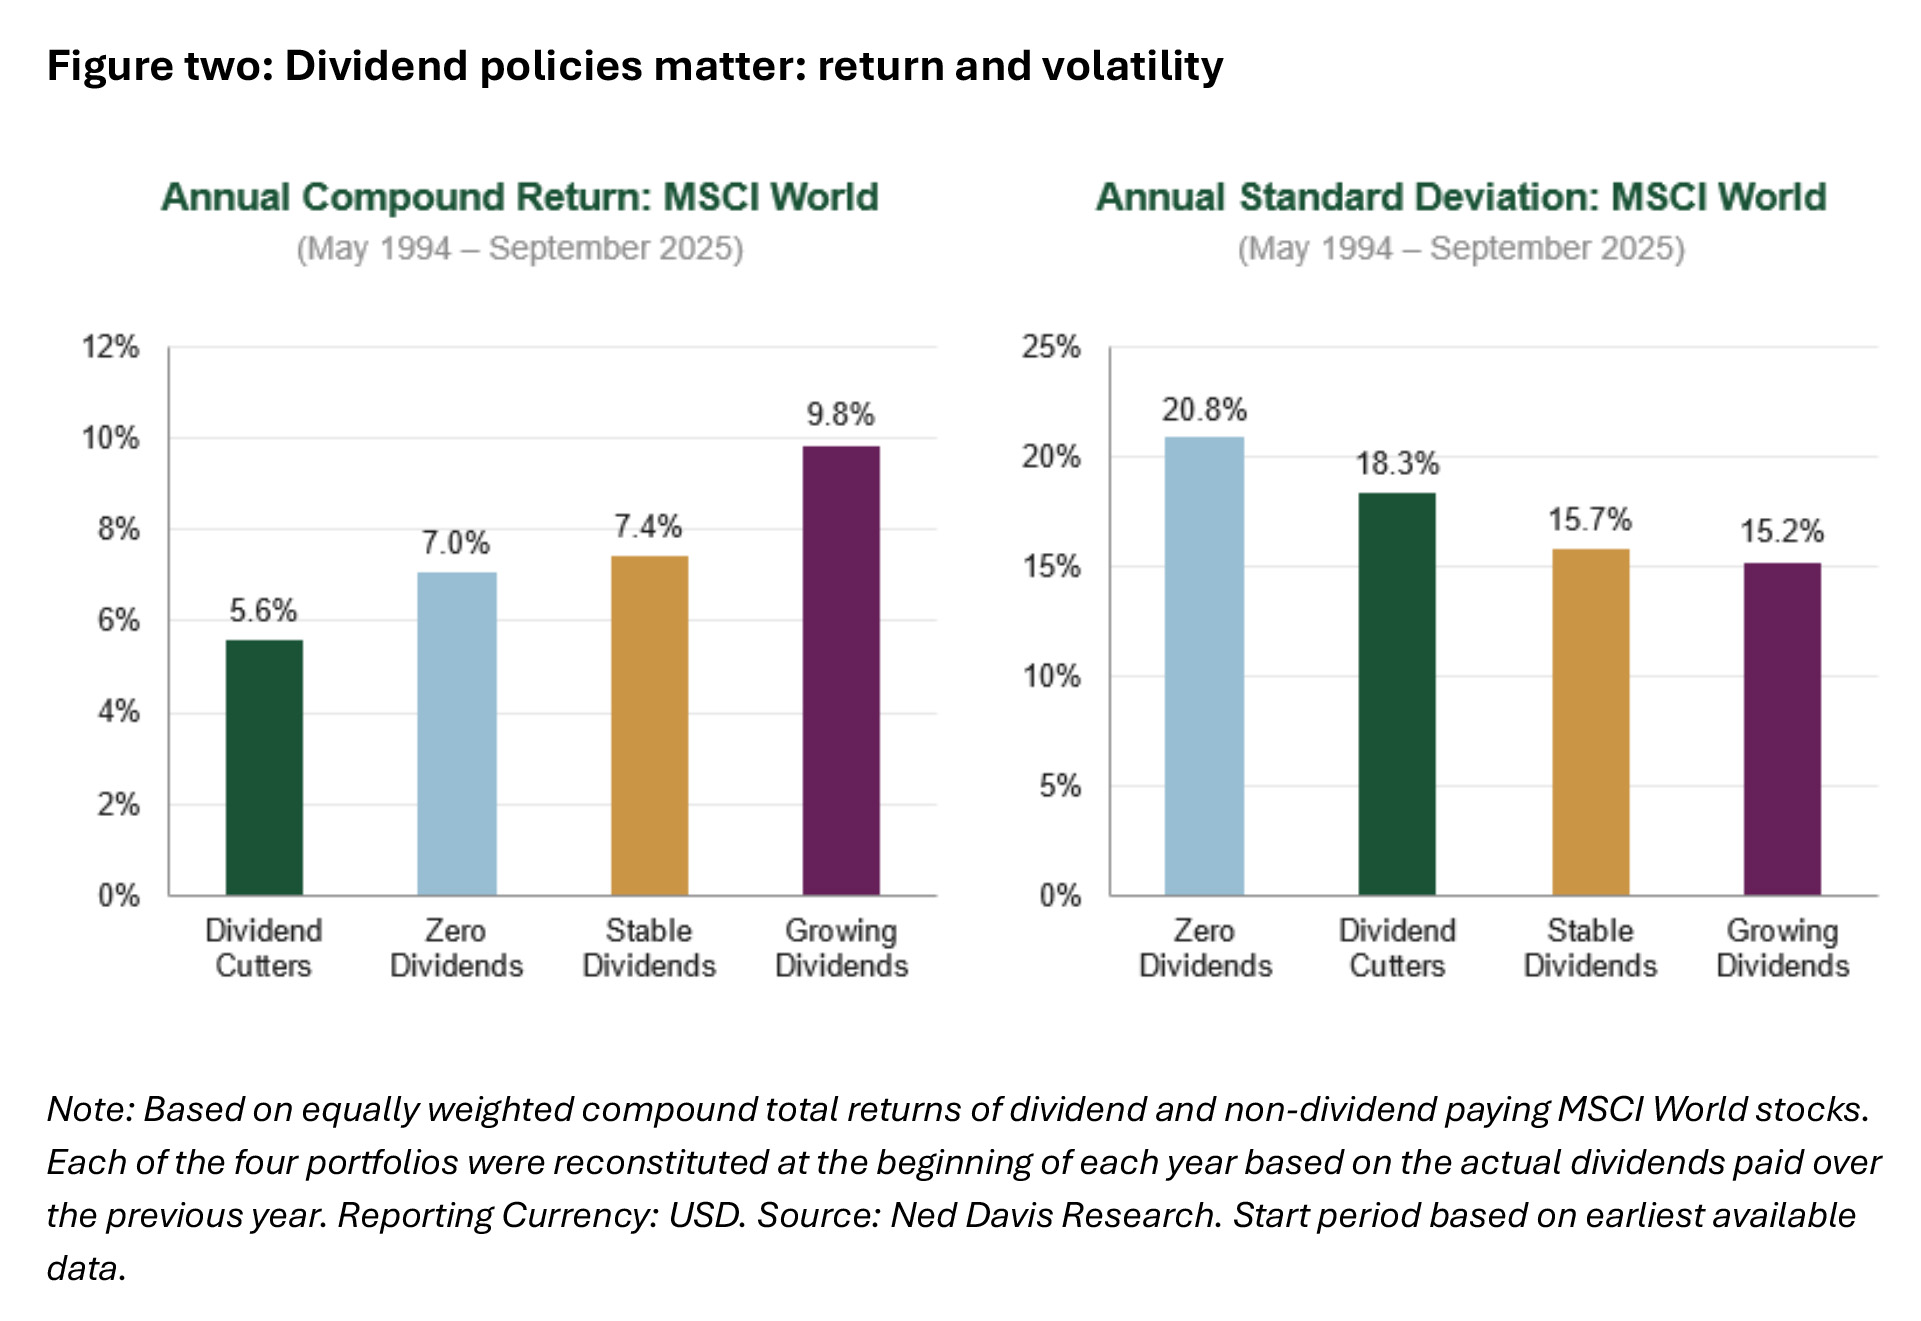
Representing the most historically stable and reliable component of equity returns, dividends offer a cushion to declines and add a degree of predictability to returns. Furthermore, companies that pay and grow their dividends over long periods often naturally exhibit other desirable attributes that denote durability: business maturity and strong market positions, excellent balance sheet health and disciplined management teams. In addition, dividend payers, especially dividend growers have outperformed companies that don’t pay dividends or have cut their dividends over the long term (figure two).
By way of illustration, from May 1994 to September 2025, companies in the MSCI World Index that paid stable dividends returned 1.8 percent per annum more than those companies that cut dividends. Those companies that consistently grew their dividends over this period did better, outperforming the dividend cutters by 4.2 percent per annum.
Importantly, the companies that consistently paid dividends achieved better returns with lower volatility. Dividend growers had a standard deviation of 15.2 percent per annum, and those with stable dividends experienced 15.7 percent per annum. The dividend cutters (18.3 percent per annum) and those companies that did not pay a dividend at all (20.8 percent per annum) delivered lower returns with higher volatility.
Those investment managers focused on companies that pay dividends may experience a positive ‘unintended consequence’. For example, TD Epoch’s focus on companies that pay out high levels of dividends as part of its shareholder yield strategy has resulted in a portfolio that tends to experience lower than market volatility. Because the total return that these companies generate over time is more ‘front loaded’ than that of the average company, there is less uncertainty around it. Over time, the price movements experienced by those companies reflect that lower uncertainty.
How lower volatility can add value
Maintaining lower volatility in an equity allocation can lead to a smoother return profile and enhance wealth creation in the long term. Market losses are asymmetric in nature and compound exponentially; the larger the loss, the more gain is needed to break even.
For example, a portfolio with a 10 percent drawdown would need an 11 percent return to get back to even, while one with a 50 percent drawdown would require a 100 percent return.
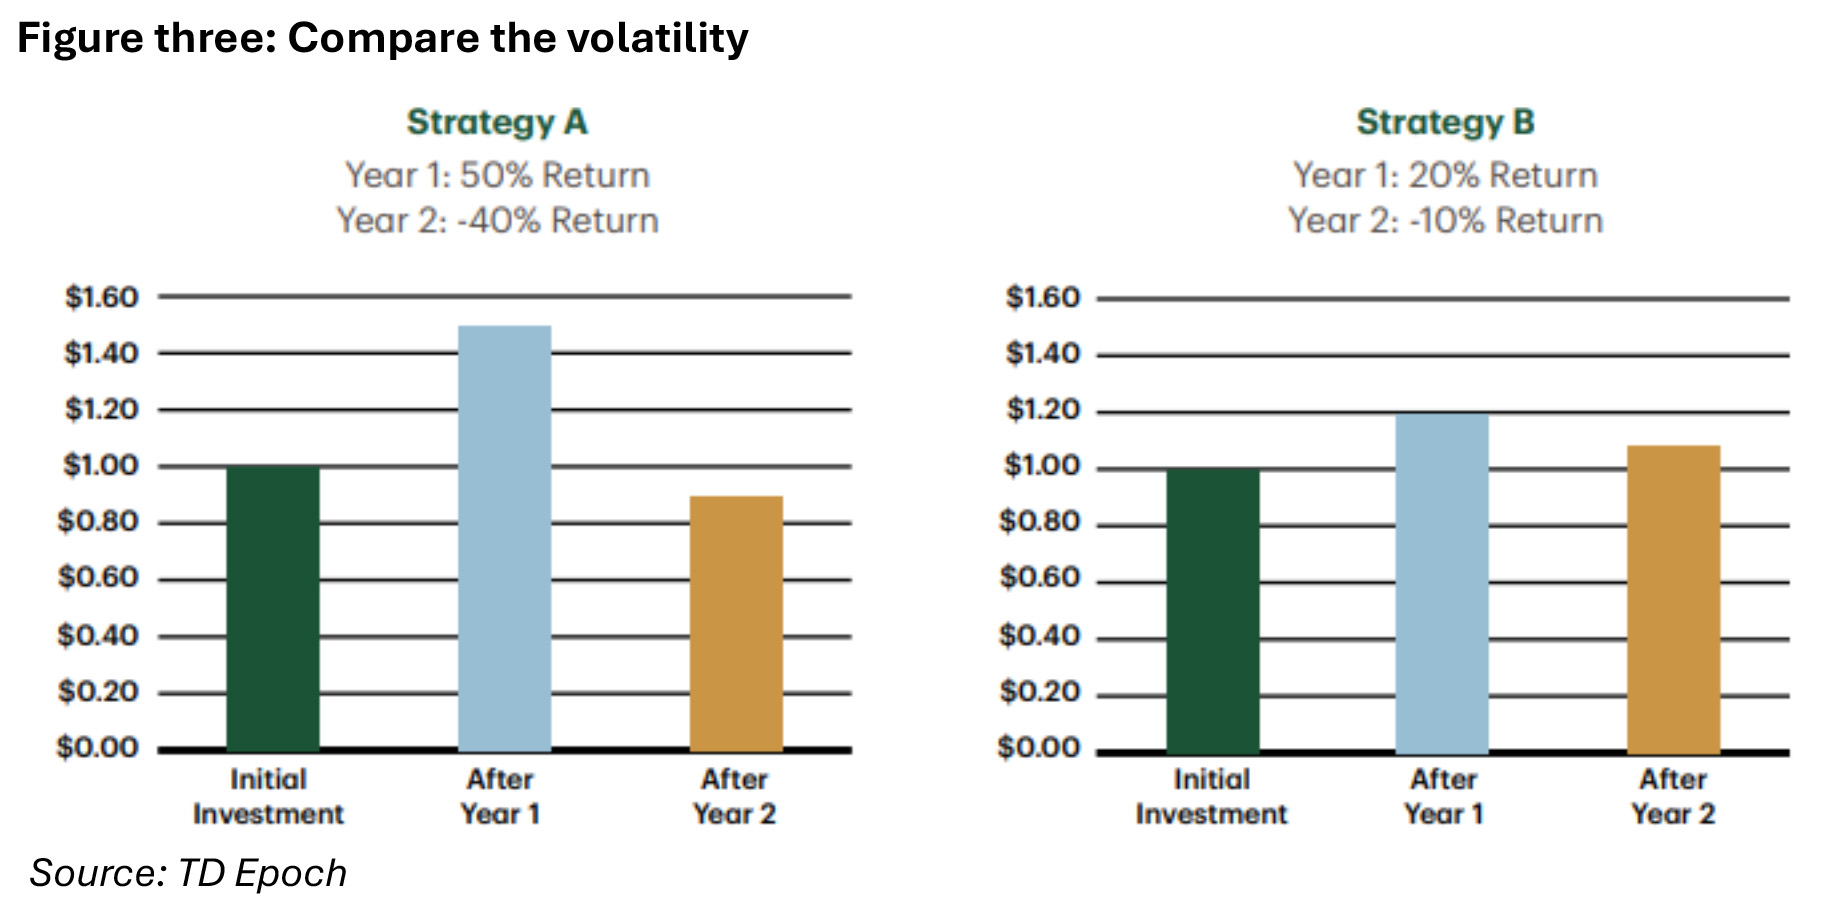
Over multiple time periods, consistently higher volatility can have a destructive impact on value, even if the portfolio has higher returns in up periods. This is illustrated in figure three. It shows a portfolio with a 50 percent return in one year would lose 10 percent of its value if its year two return was -40 percent, while a portfolio with a much more modest 20 percent return in year one would have a gain of 8 percent if its year two return was -10 percent. It will have $1.08 compared to 90 cents; that invested dollar first grew to $1.20, and then fell 10%, or 12 cents, to $1.08.
Ultimately, if a portfolio can generate the same average annual return as the market, but does so with less volatility, the investor ends up with a higher annualised return than the market. In other words, the investor will have more money than if they simply matched the index return each year. Like dividends, low volatility is a tangible investment benefit.
Not all dividends are created equal
While identifying stocks with the highest yields is a simple screening exercise, assessing the sustainability of those payouts is far more complex. A disproportionately high yield may often signal distress; as a company’s share price declines due to deteriorating fundamentals, its yield rises mechanically.
Frequently, the same headwinds that drive the stock price down eventually compel management to cut or eliminate the dividend entirely. Consequently, a successful income strategy must prioritise ‘dividend integrity’ and focus on those companies with the robust cash flows necessary to sustain and grow their distributions over time.
Dividends and the current environment
As global markets transition into disparate cycles of monetary policy in 2026, corporate fundamentals remain remarkably robust. Resilient consumer demand and disciplined cost management have bolstered free cash flow, providing a solid foundation for enhanced shareholder returns.
However, the cost of capital remains elevated in most jurisdictions and ‘sticky’ inflation remains a problem, keeping rates higher than anticipated. This means the cost of capital will remain elevated and companies will need to remain disciplined in their capital allocation decisions, especially with respect to directing cash towards growth initiatives.
Despite a challenging environment, a defining characteristic has been the broadening of the income set; traditional ‘growth’ sectors – most notably US technology – have matured into reliable dividend payers, offering investors a combination of structural growth and tangible yield.
Dividend initiations from US tech giants
A significant milestone in the 2026 investment landscape is the transformation of US ‘big tech’ from pure growth plays into a new class of dividend growers. Historically, these companies avoided payouts to reinvest every dollar into research and development; however, significant scale and consistent free cash flow have now forced a shift in capital allocation.
By initiating dividends, these companies are signalling financial maturity and a commitment to shareholder discipline, becoming attractive to investors who previously looked to more defensive sectors for income. This evolution has expanded the opportunity set for global income portfolios, allowing investors to capture technological upside without sacrificing regular cash distributions.
As of early 2026, five of the ‘Magnificent Seven’ now return capital via dividends:
- Meta initiated its first-ever dividend in early 2024, starting at $0.50 per share, paid quarterly. By end 2025, it had established an albeit short track record of consistent quarterly payments with an annual increase.
- Alphabet joined the dividend ranks in April 2024 with a $0.20 per share quarterly payout, rising to $0.21 in 2025.
- NVIDIA has paid a small dividend since late 2012; however, its dividends yield remains low.
- Apple and Microsoft are the ‘veterans’ of the tech-dividend space, with each firm having paid dividends for more than a decade.
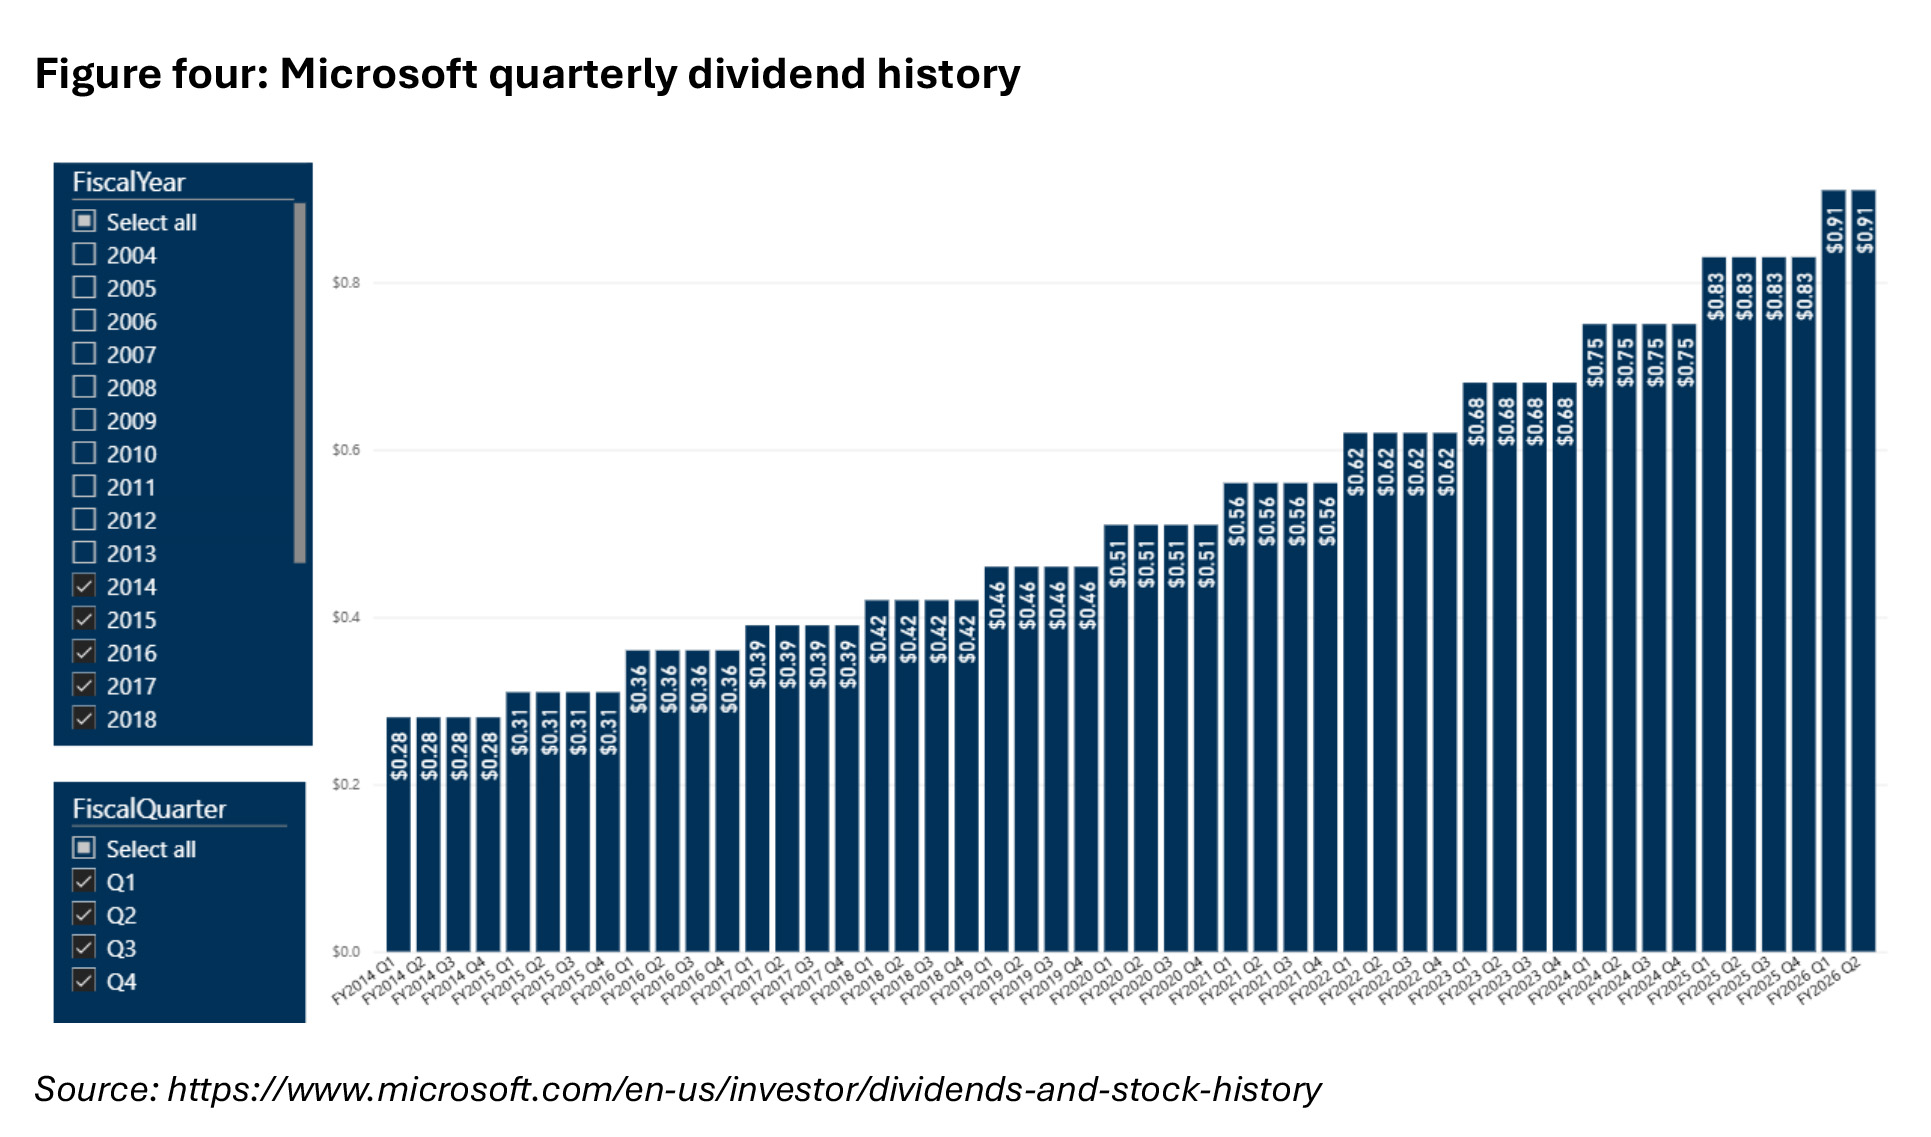
Microsoft is a good example of how dividends can play a positive role in company performance. The firm first initiated for shareholders on 16 January 2003 and has consistently increased its dividend payment to investors (figure four). The introduction of the quarterly dividend has not dampened Microsoft’s share price performance (figure five) and demonstrates that dividend growth can be a catalyst for share price growth.

A shareholder yield approach
The contribution dividends make to share price growth is strongly aligned with the core shareholder yield philosophy. This strategy requires portfolio holdings to be both consistently growing their free cash flow and returning much of that cash to shareholders.
Companies maximise returns through disciplined capital allocation and a shareholder yield strategy is premised on a belief that companies should reinvest capital if the expected return on invested capital is greater than the company’s cost of capital. Remaining free cash flow should be returned to shareholders via shareholder yield (figure six).
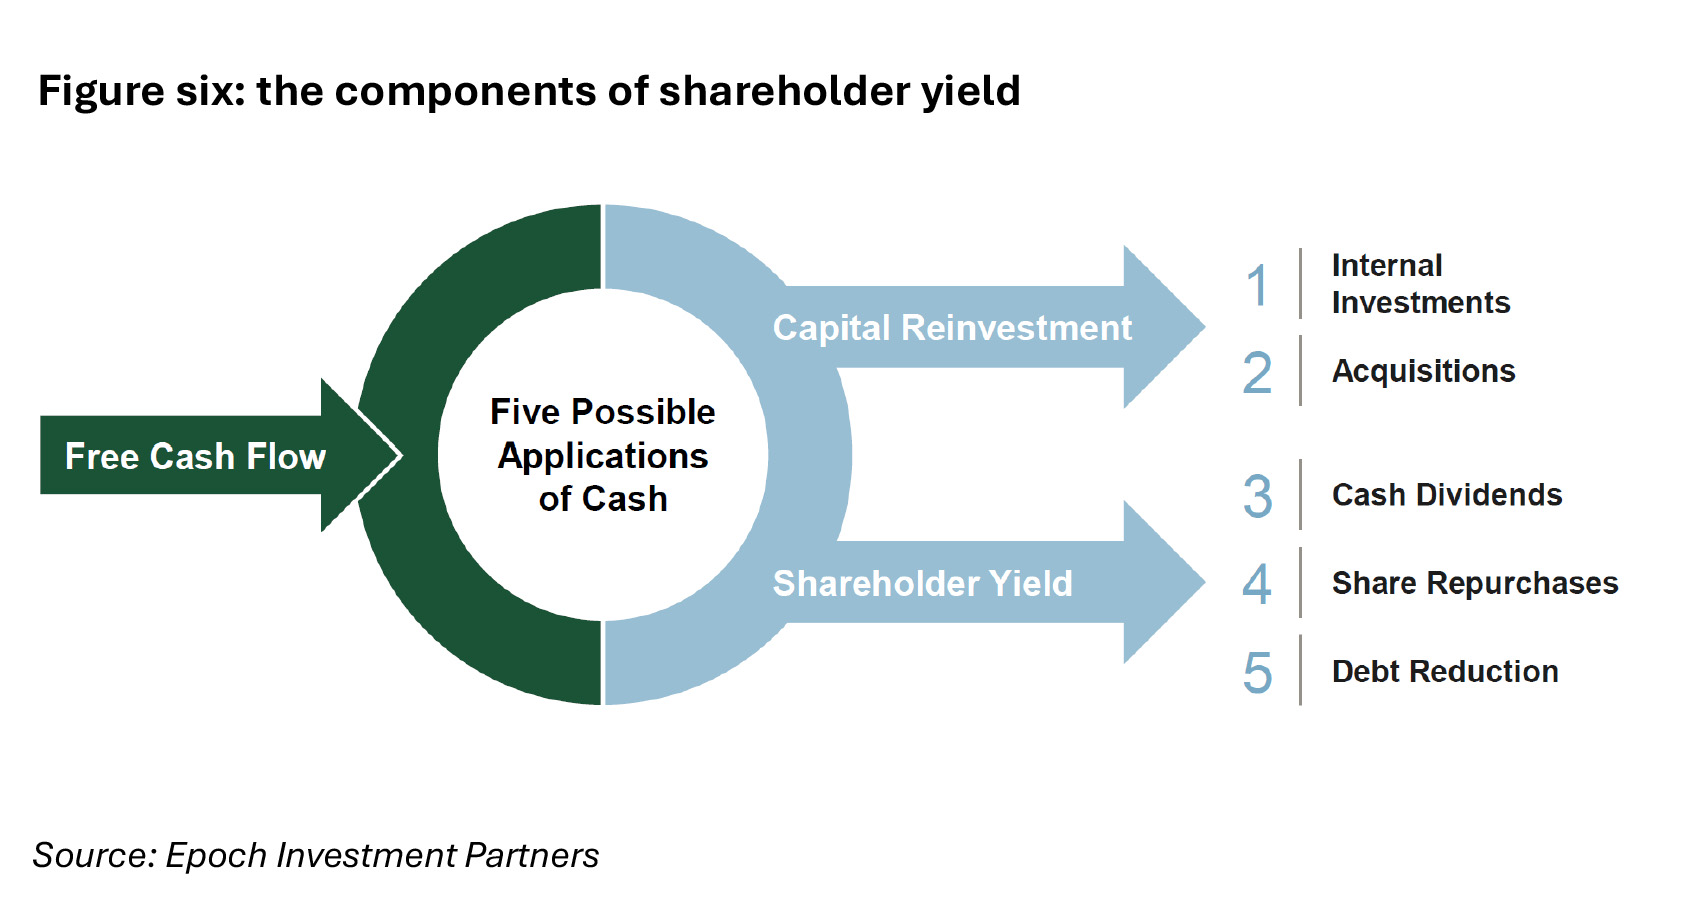
While cash dividends are the most obvious and direct way to return capital to shareholders, taking a broader view and recognising that share repurchases and debt reduction increase shareholder’s claims on company cashflows. Dividend payments are far more committal than share repurchases, as dividend cuts are often viewed as a signal to investors that a business is under pressure. Consequently, many companies, especially in the US, have opted to focus more on share buybacks as a mechanism for returning cash to shareholders, requiring the flexibility to dial distributions up and down without spooking the market.
Looking forward, the Fed is projected to cut rates to between 3.5% and 3.75% by the end of 2026. Fixed income yields tend to move in conjunction with interest rates, so their yields fall as interest rates fall. Dividend strategies can be attractive in a falling rate environment as investors look to replace the income they may be losing in their fixed income allocations. This is particularly true of those strategies that have offered a consistent level of dividend yield such as a shareholder yield strategy. In addition, falling rates could positively impact price appreciation on dividend paying stocks as they become more popular.
It’s important to note that dividend strategies are not unattractive in rising rate environments. Often, when interest rates are rising, it is because there is sustainable growth in the economy which is typically a favourable macroeconomic environment for companies. It should imply rising revenues, rising earnings and rising cash flows. This is particularly important to a shareholder yield strategy that is focused on identifying companies that can generate growing cash flow.
Investing in global equities offers a powerful solution for those seeking a blend of consistent income and long-term growth. This approach broadens your clients’ investment horizon, allowing access to world-class companies in sectors that may be underrepresented in the Australian market. Beyond just providing a wider array of dividend yields, a global strategy functions as a vital safety net, protecting investors from domestic downturns by spreading risk across multiple economies and regulatory environments.
As the global economy continues to evolve and expand, the potential for capital appreciation and increased income is promising. Although investors must navigate challenges like exchange rate fluctuations and geopolitical risks, the benefits of a diversified global equities portfolio can mitigate these concerns. Ultimately, global equities should be a fundamental component of any strategy designed to generate reliable income over time.
Take the FAAA accredited quiz to earn 0.5 CPD hour:
CPD Quiz
The following CPD quiz is accredited by the FAAA at 0.5 hour.
Legislated CPD Area: Technical Competence (0.5 hrs)
ASIC Knowledge Requirements: Securities (0.5 hrs)
please log in to start this quiz
———
References:
[1] APRA Monthly Authorised Deposit Taking Institution Statistics, November 2025
[2] Based on NAB 12-month deposit rate, 5 January 2026
[3] ABS, Retirement and Retirement Intentions 2024-2025, Australia
The information included in this article is provided for informational purposes only and is general advice only. It does not take into account an investor’s own objectives. The information contained in this article reflects, as of the date of publication, the current opinion of TD Epoch and is subject to change without notice. Sources for the material contained in this article are deemed reliable but cannot be guaranteed. We do not represent that this information is accurate and complete, and it should not be relied upon as such. Any opinions expressed in this material reflect our judgment at this date, are subject to change and should not be relied upon as the basis of your investment decisions. All reasonable care has been taken in producing the information set out in this article however subsequent changes in circumstances may occur at any time and may impact on the accuracy of the information. Neither TD Epoch, GSFM Pty Ltd, their related bodies nor associates gives any warranty nor makes any representation nor accepts responsibility for the accuracy or completeness of the information contained in this article.
CPD Quiz
The following CPD quiz is accredited by the FAAA at 0.5 hour.
Legislated CPD Area: Technical Competence (0.5 hrs)
ASIC Knowledge Requirements: Securities (0.5 hrs)
please log in to start this quiz———
References:
[1] APRA Monthly Authorised Deposit Taking Institution Statistics, November 2025
[2] Based on NAB 12-month deposit rate, 5 January 2026
[3] ABS, Retirement and Retirement Intentions 2024-2025, Australia
The information included in this article is provided for informational purposes only and is general advice only. It does not take into account an investor’s own objectives. The information contained in this article reflects, as of the date of publication, the current opinion of TD Epoch and is subject to change without notice. Sources for the material contained in this article are deemed reliable but cannot be guaranteed. We do not represent that this information is accurate and complete, and it should not be relied upon as such. Any opinions expressed in this material reflect our judgment at this date, are subject to change and should not be relied upon as the basis of your investment decisions. All reasonable care has been taken in producing the information set out in this article however subsequent changes in circumstances may occur at any time and may impact on the accuracy of the information. Neither TD Epoch, GSFM Pty Ltd, their related bodies nor associates gives any warranty nor makes any representation nor accepts responsibility for the accuracy or completeness of the information contained in this article.


Have feedback on this article? Contact Us
Earn CPD Points
 CPD: The spectrum of growth
Companies that generate strong, sustainable growth are valuable sources of long term capital appreciation in a portfolio, but these businesses are rare, difficult to identify and exist on a broad [...]
 CPD: Record-keeping in financial advice – the key to compliance and consumer protection
Introduction The financial services regulatory framework is a key pillar of financial consumer protection. Regulatory compliance is therefore not merely about avoiding penalties, but is a critical step in building [...]
 CPD: Trust and ethics in financial advice
In 2024, trust in financial advisers reached an all-time high. This article, proudly sponsored by GSFM, explores the inseparable links between trust and ethical practice when providing financial advice. Defined [...]
 CPD: Retirement Income Strategies
It has been almost 40 years since award superannuation was introduced in Australia, and 33 years since the introduction of mandatory occupational superannuation. This means the next decade will see [...]
 CPD: Free cash flow works
The difference between earnings and free cash flow is an important investment concept, one explained here by GSFM’s investment partner TD Epoch. Earnings have long played a dominant role in [...]