CPD: The global spectrum of growth equities

The global growth equity universe spans a broad spectrum, from emerging disruptors to established compounders with resilient long-term potential.
In a global market where ‘growth’ is often used as a catch-all term, true long-term capital appreciation remains a rare find. Identifying companies capable of sustaining strong growth requires more than just following trends; it requires navigating a vast spectrum that spans industries, borders and diverse corporate life cycles.
While these opportunities are diverse, the most resilient growth stories typically converge into two distinct categories: emerging growers and stable growth compounders.
By applying an empirical lens to these two groups over nearly two decades, Jennison uncovers how the unique investment characteristics of each group drives performance across different market cycles. This is important for growth investors to understand as they navigate through different market cycles. However, while this historical framework provides a vital roadmap for growth investors, it is no substitute for the rigorous, bottom-up fundamental analysis required to pinpoint the winners of tomorrow.
In this article, we explore the mechanics of these two growth archetypes and how they shape the modern global equity landscape.
The growth landscape
Companies that deliver above-average, sustainable growth over the long term are among the most valuable investments in the markets. These companies generate the strongest compound returns over time, a role that has been amply rewarded by investors. The fastest-growing companies have consistently led performance over the past three decades and through a range of market environments.[1]
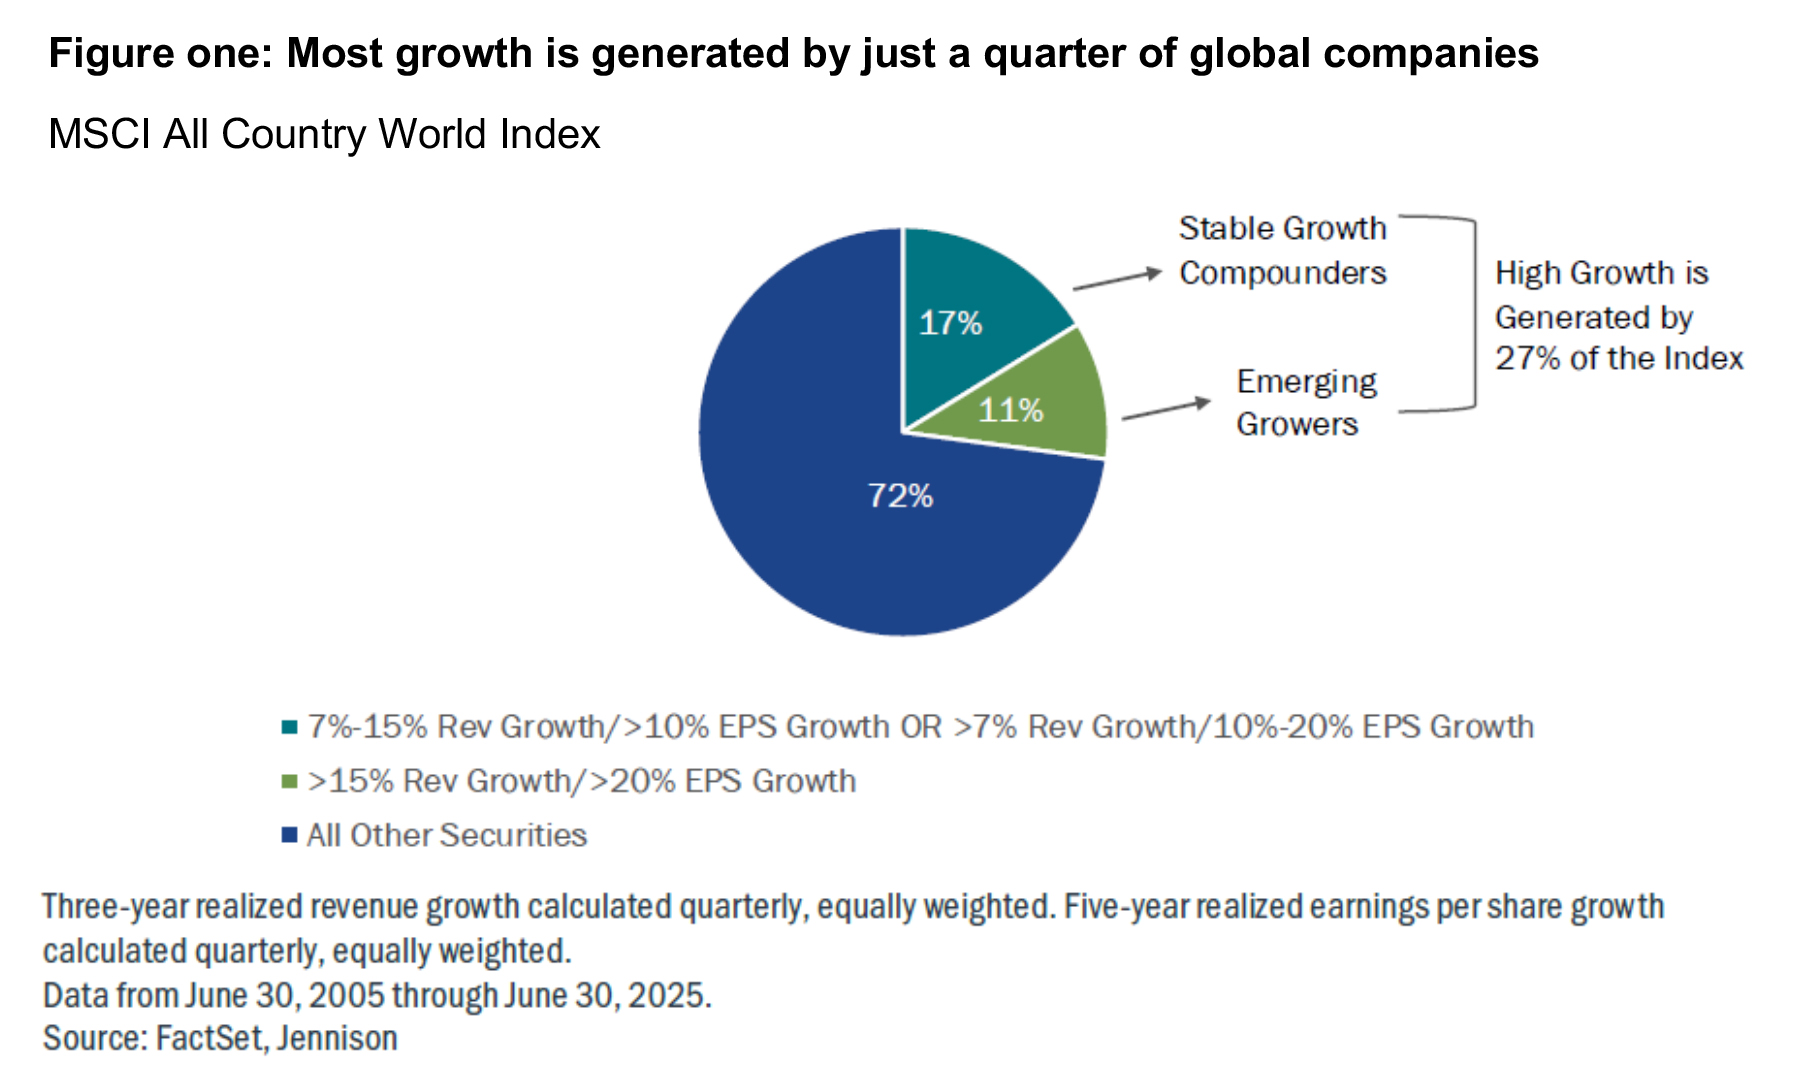
Growth companies, however, are rare. Since mid-2005[2], about one out of four publicly listed large- and mid-capitalisation companies globally posted seven percent or greater annualised revenue growth and 10 percent or higher earnings growth.
When the revenue growth threshold is raised to 15 percent and earnings growth to 20 percent, the number falls to about one in ten companies (figure one)[3].
The sources of growth can vary and are often fluid. While strong, persistent growth is typically driven by innovation or technological disruption, the drivers are rarely, if ever, predictable or static. In the course of fundamental research, Jennison has observed two distinct types of growth companies: emerging growers and stable growth compounders. Although both groups consist of growth stocks, the differences in their characteristics and performance can be profound (figure two).
 Emerging growers and stable growth compounders
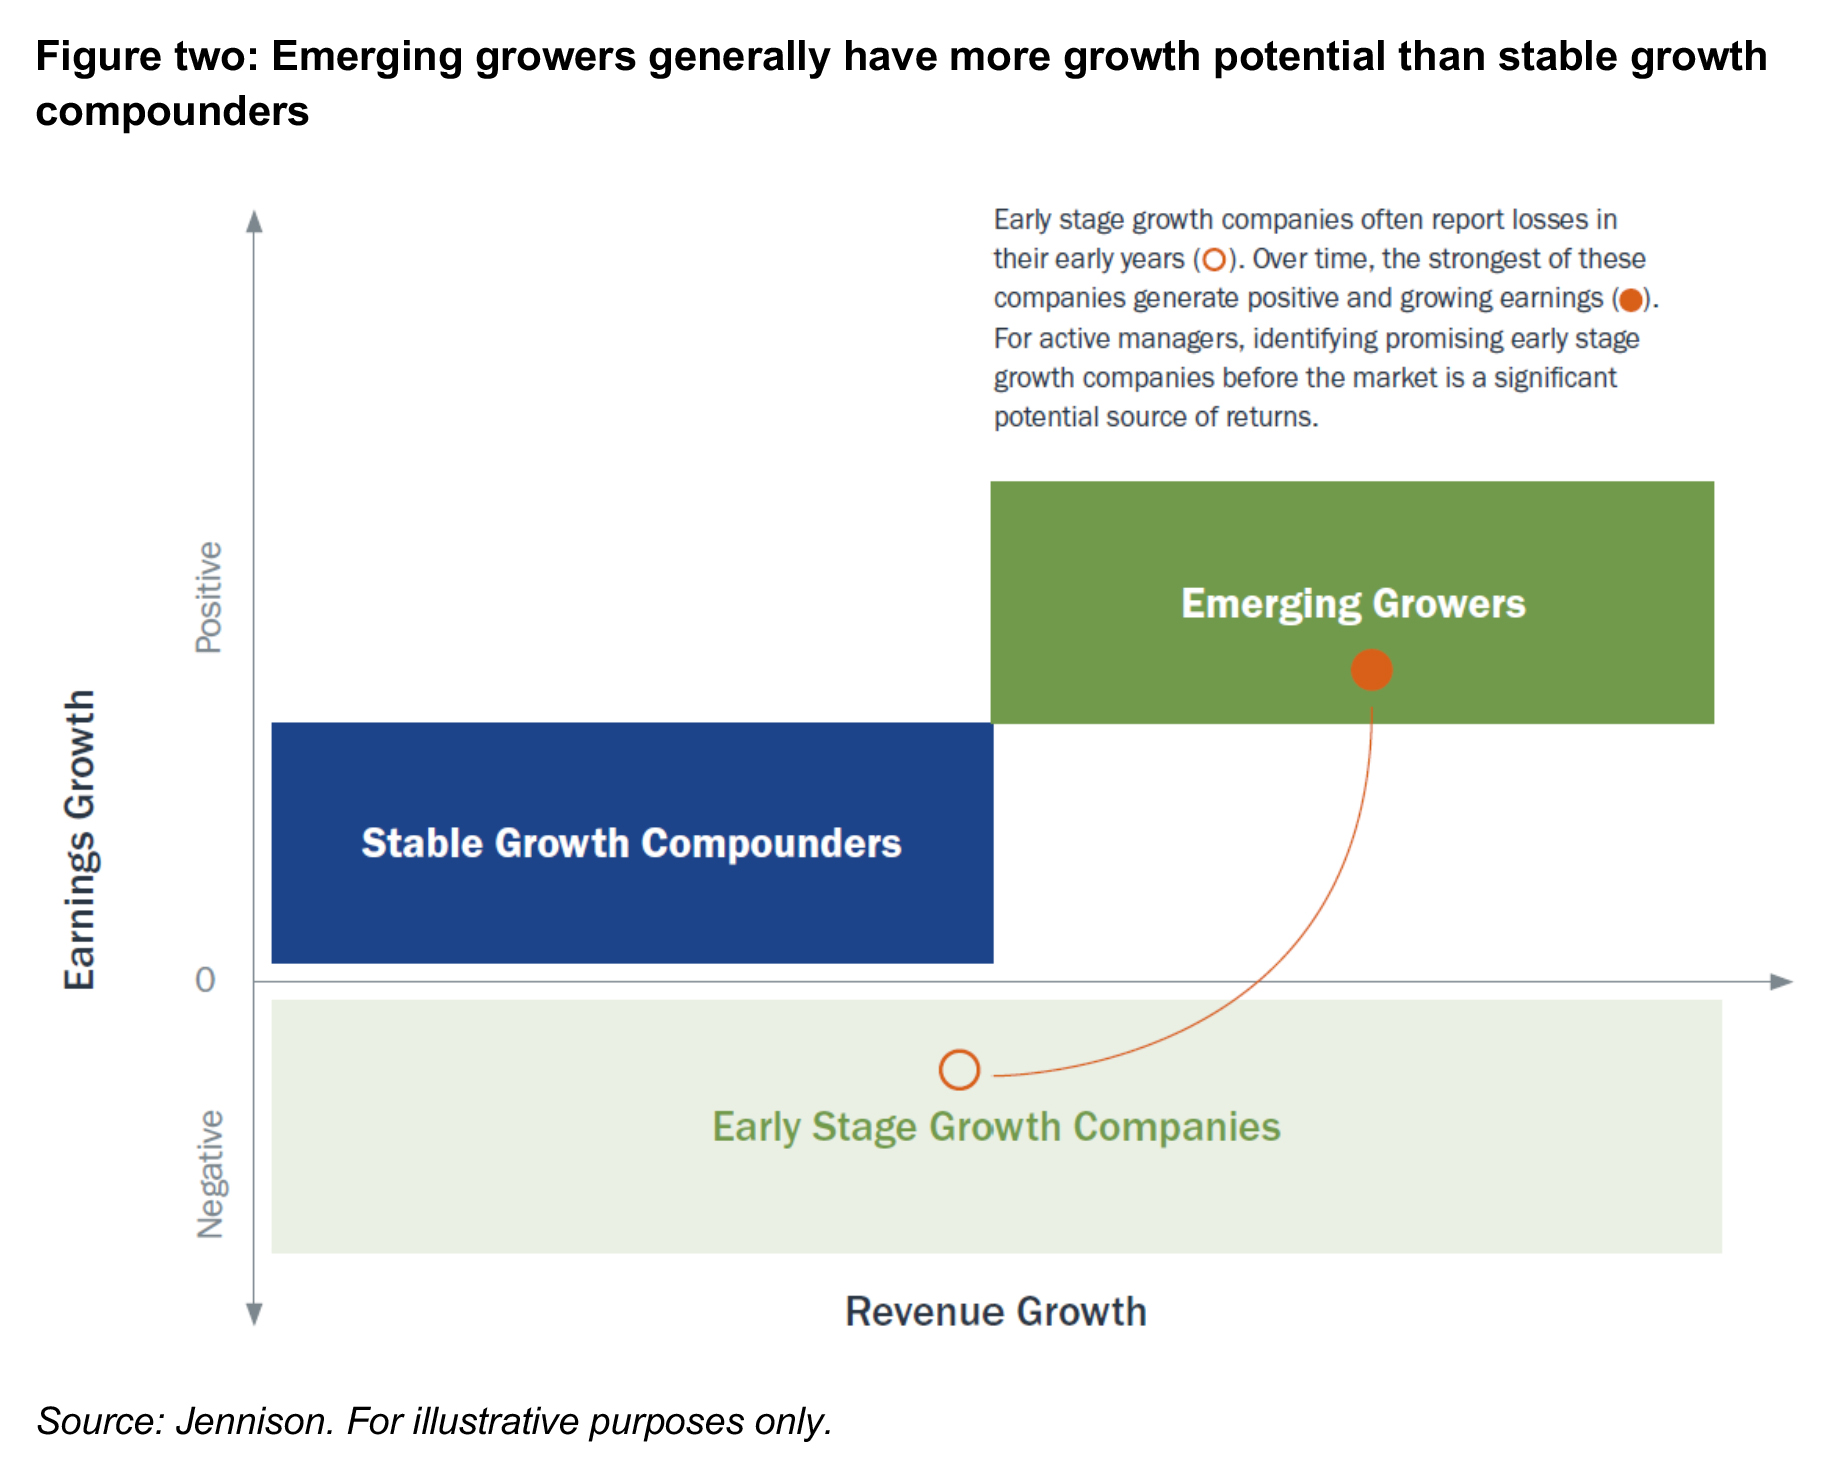
Emerging growers are typically young disruptors, in a new or developing industry, and offer significant upside potential. To fuel their rapid growth, these companies reinvest their cash flow into sales, marketing, research, product development and achieving scale, while reporting relatively low – or no –profits. These strategic decisions can depress margins and earnings over the short term (usually 1–2 years), but this is typically followed by a phase of pronounced growth over the following 3-5 years.
Emerging growers have been concentrated in many different industries over the past several decades. In the 1980s, they were found among pharmaceutical and biotech firms; in the 1990s, they were computer hardware and internet companies; today, they are concentrated in AI-related technology.
Stable growth compounders also demonstrate above average growth potential, but they have a history of profitability and established drivers of growth. They are often former emerging growers that have matured into large or mega cap companies with a flourishing mix of products and services. They can maintain their competitive position through continued innovation and expansion into new markets or by leveraging an established business that cannot be easily replicated by competitors. They can be found in a range of industries, including technology, luxury goods and high-end brands and healthcare.
The differences between these two groups impact their performance. Emerging growers can be relatively volatile; they tend to be more sensitive to market uncertainty because they have little history of reported earnings. Traditional valuation measures that are earnings-based, such as price-to-earnings, can make them appear unattractive, especially in their early years.
Emerging growers have longer duration profiles. In this context, long-duration growth companies have the bulk of their expected profits weighted towards more distant time periods. Conversely, short-duration companies are expected to report a more significant share of their future profits in the near term.
Due to their longer duration profiles, emerging growers also tend to underperform in a rising rate environment as investors apply a higher discount to future cash flows. However, in periods of stable economic growth and flat or declining interest rates, emerging growers are usually among the market leaders.
On the other hand, stable growth compounders typically have shorter duration profiles and can be less volatile, as their profits are usually more visible and their sources of growth more established or diverse. This can lead stable growth compounders to outperform emerging growers during periods of economic uncertainty, but their long term upside potential tends to be lower.
To further explore observations of emerging grower versus stable growth compounder behaviour, an empirical lens was applied to the global and US equity universes (as measured by the MSCI ACWI and the S&P 500 Index). Proxies were created for the two groups by screening each index based on realized revenue and earnings growth levels (figure three).
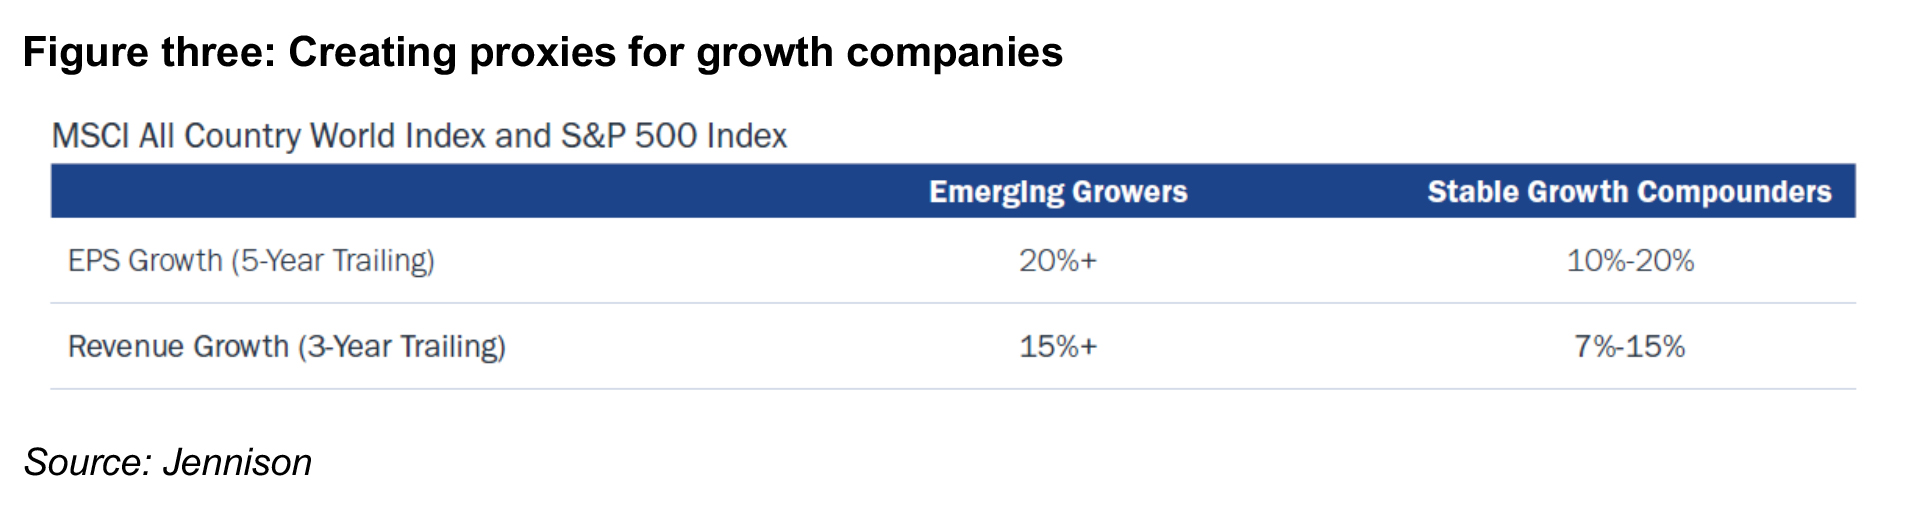
The parameters for emerging growers were 3-year trailing revenue growth rates above 15 percent and 5-year trailing earnings per share (EPS) growth rates above 20 percent. For stable growth compounders, lower thresholds were set – revenue growth rates of 7-15 percent and EPS growth rates between 10-20 percent. These thresholds are not intended to be definitive; Jennison believes they should be adjusted should levels of growth structurally reset over time.
These revenue and earnings screens are a simplification, one that serves as a useful way to aggregate and analyse two groups of growth companies that possess attributes that should allow them to generate strong returns for shareholders.
For the purposes of this analysis, the focus has been on companies that have reported positive earnings for most of the previous five years and have been growing in the ranges specified above. However, there are many high-growth companies that have not yet reported profits on a consistent basis, and some of these may offer compelling investment opportunities. Consequently, Jennison does not rely on these screens in its own investment process, which is driven by fundamental, bottom-up analysis and a forward-looking view.
Insights from performance analysis
Each group’s performance compared to the index was calculated from June 2005 through to June 2025 (figure four). Overall, both outperformed the MSCI ACWI during this time period. Stable growth compounders led, gaining 10.4 percent on an annualised basis compared to 9.8 percent by emerging growers and 8.2 percent by the index.
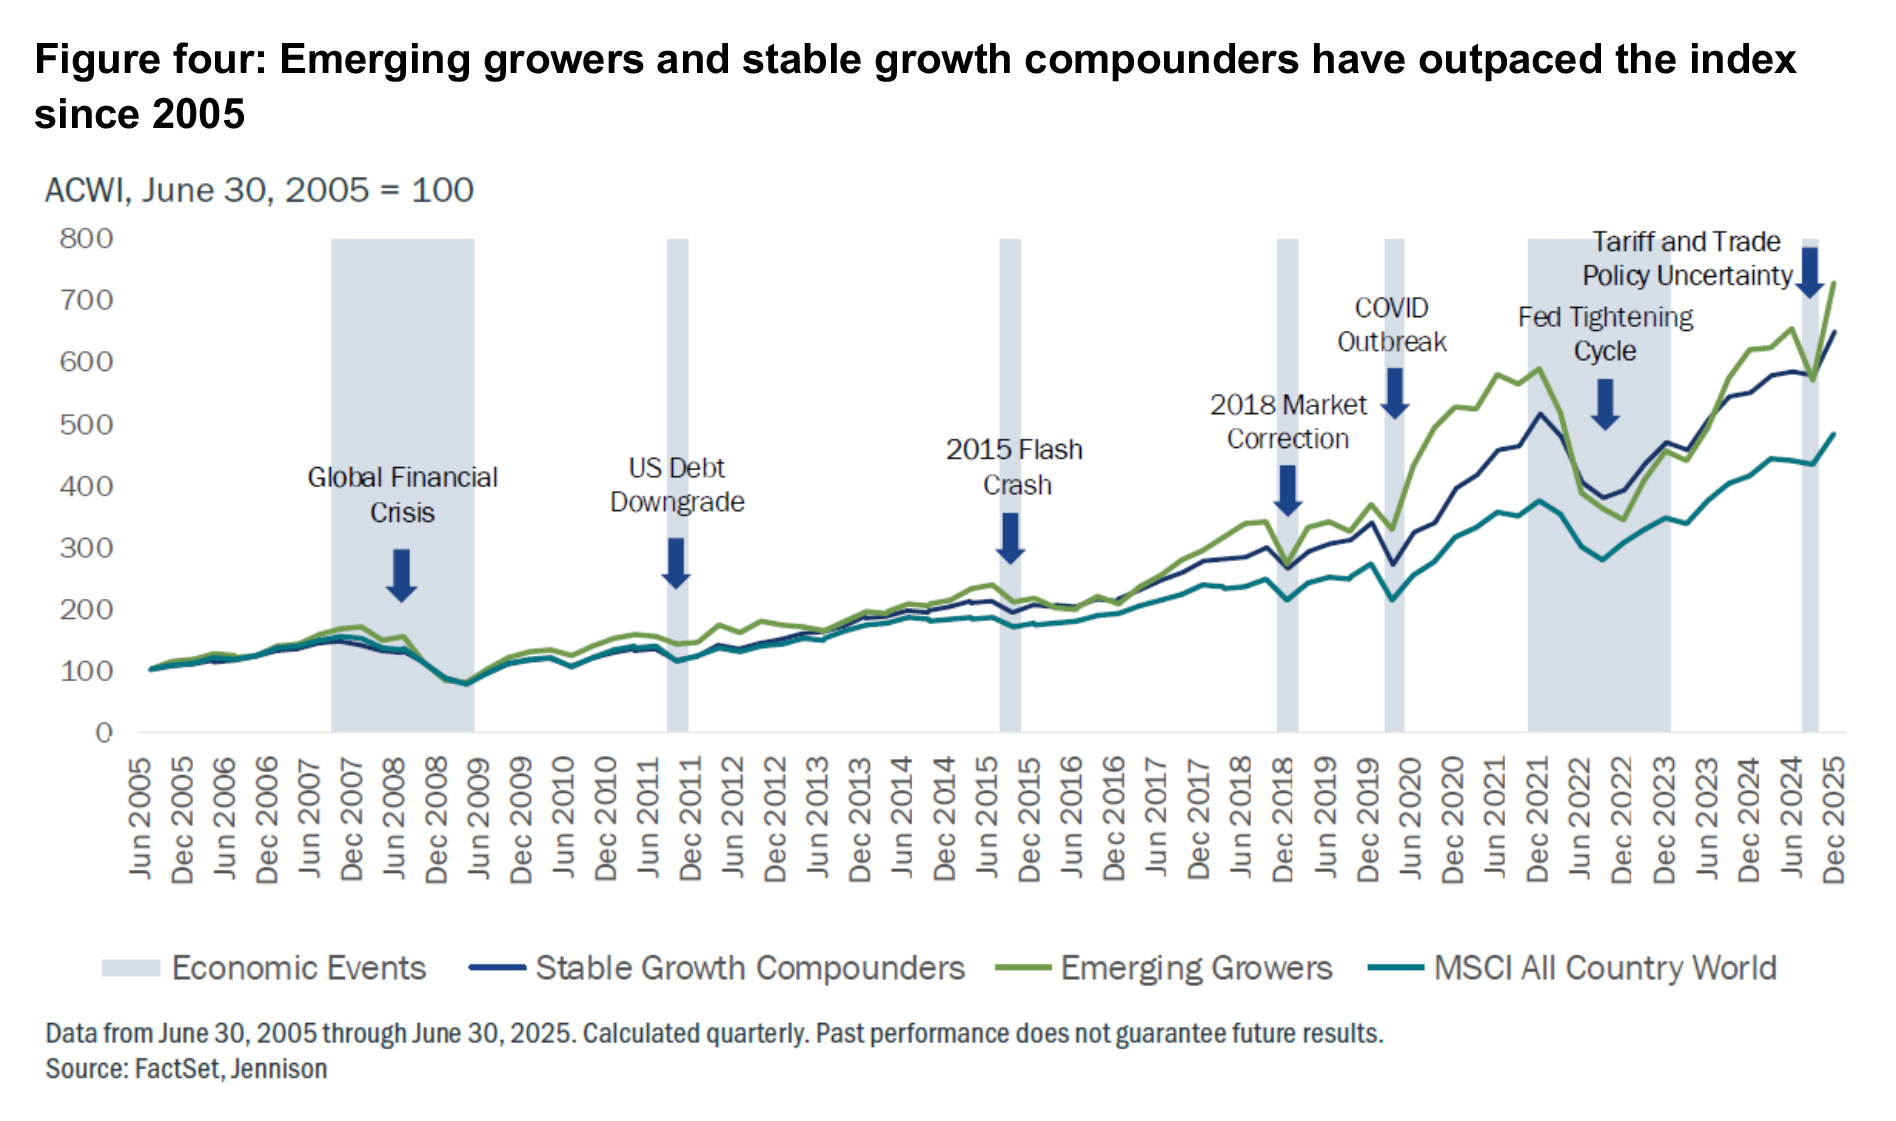
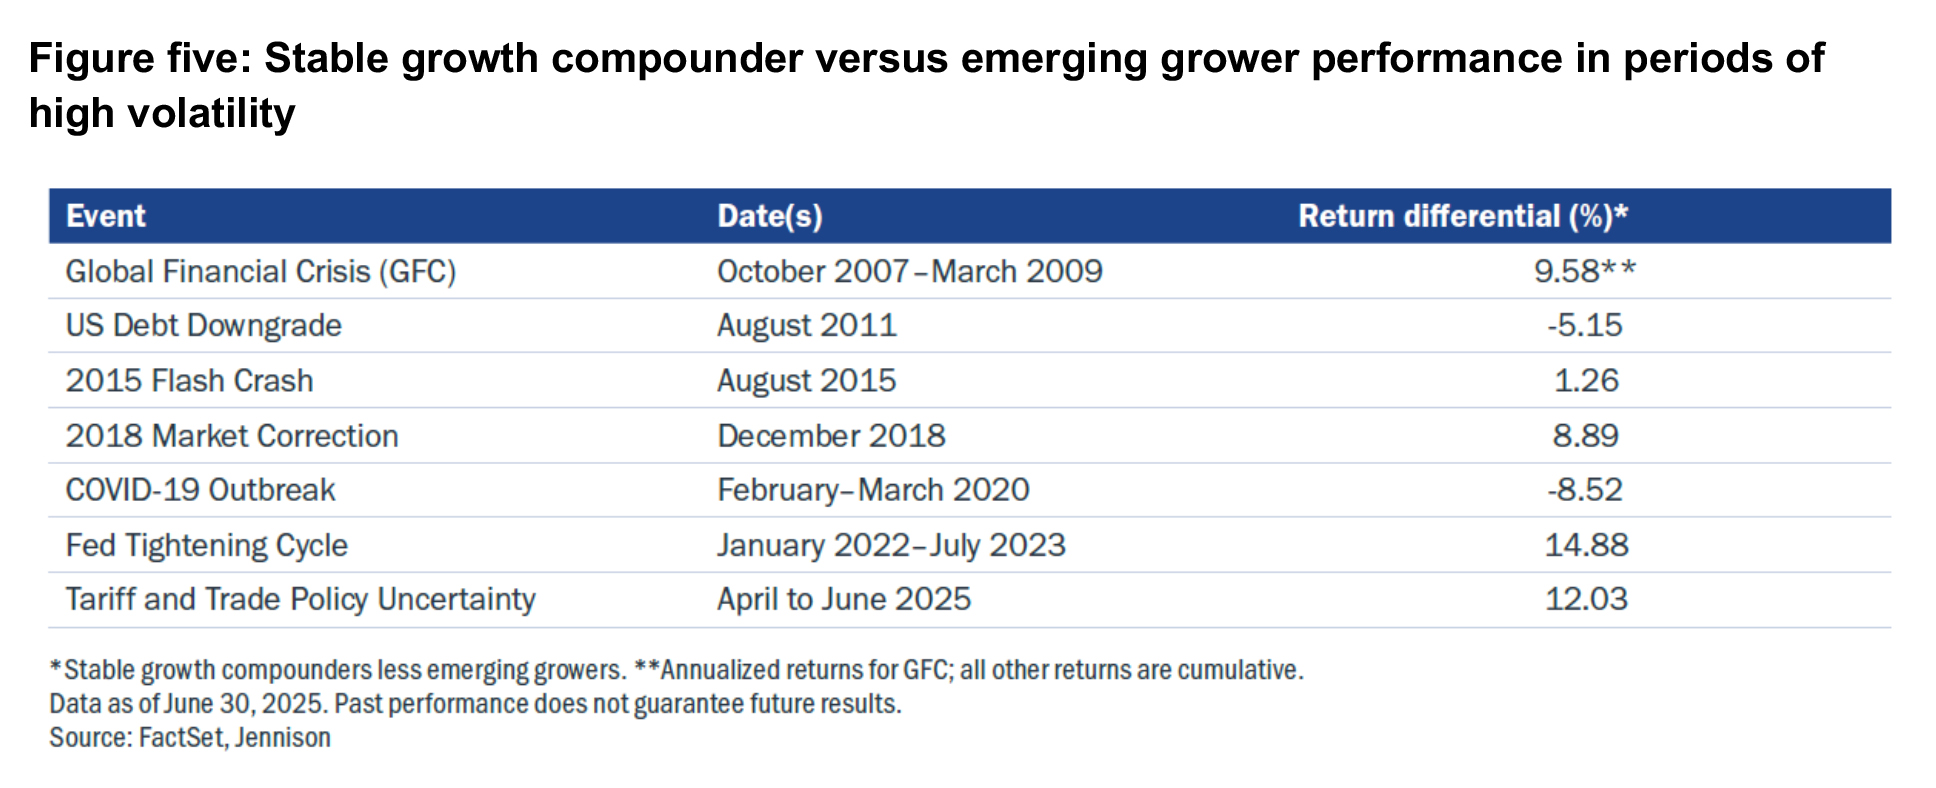
These growth stocks set a positive trajectory over time, but their paths are not perfectly linear. To gain more perspective on the performance of the two groups during periods of uncertainty, Jennison identified seven peaks in market volatility and the events that coincided with them:
- the global financial crisis (GFC)
- US debt downgrade (2011)
- flash crash (2015)
- market correction (2018),
- COVID-19 outbreak (2020)
- the Fed interest rate tightening cycle (2021–2023)
- tariff and trade policy uncertainty (2025).
These market events included major credit defaults, sudden panics, technical trading events, as well as pandemic and macroeconomic pressures. This allowed an examination of growth equity performance across different settings, with the common thread being that they each represented high volatility, tail-risk scenarios.
In these volatile environments, stable growth compounders outperformed emerging growers in each period except for the US debt downgrade and the COVID-19 outbreak (figure five).
The outperformance did not last beyond relatively short periods of market instability, which suggests that there could be more sensitivity of returns for stable growth compounders in a prolonged macro event, such as the GFC. However, the divergence in returns between emerging growers and stable growth compounders became significant during and after the COVID-19 outbreak (figure six).
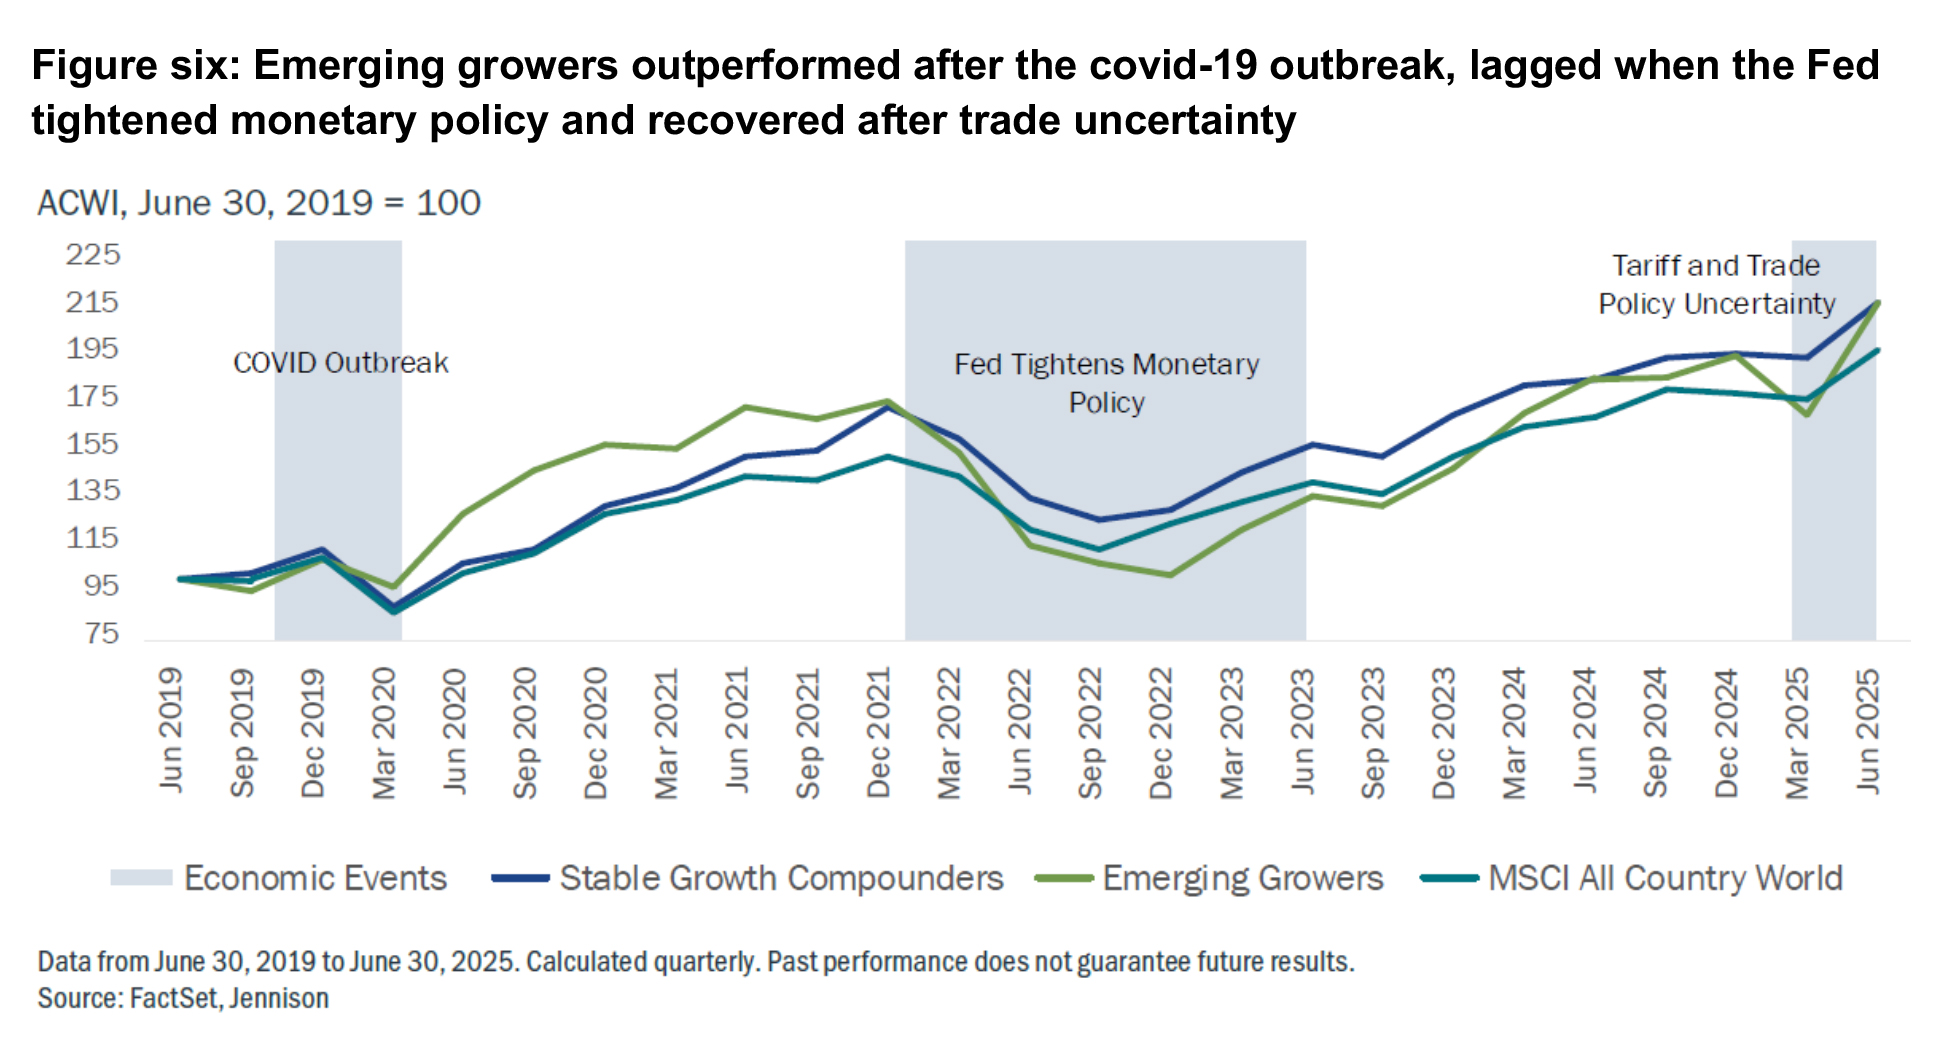
After March 2020, emerging growers outperformed stable growth compounders and the broad market by 12 and 11 percentage points, respectively, over the next five quarters. However, this performance reversed during the Fed tightening cycle, when emerging growers underperformed stable growth compounders and the broad market. Stable growth compounders outperformed again when uncertainty related to trade surged in the first half of 2025, but as the uncertainty dissipated, emerging growers returned to market favour.
Both groups benefited from the surge in technology adoption during the COVID-19 shutdowns, but emerging growers were more exposed to the Fed’s tightening cycle and rising interest rates. When the Fed’s tightening cycle neared an end, ACWI emerging growers made up ground against their stable growth compounders counterparts.
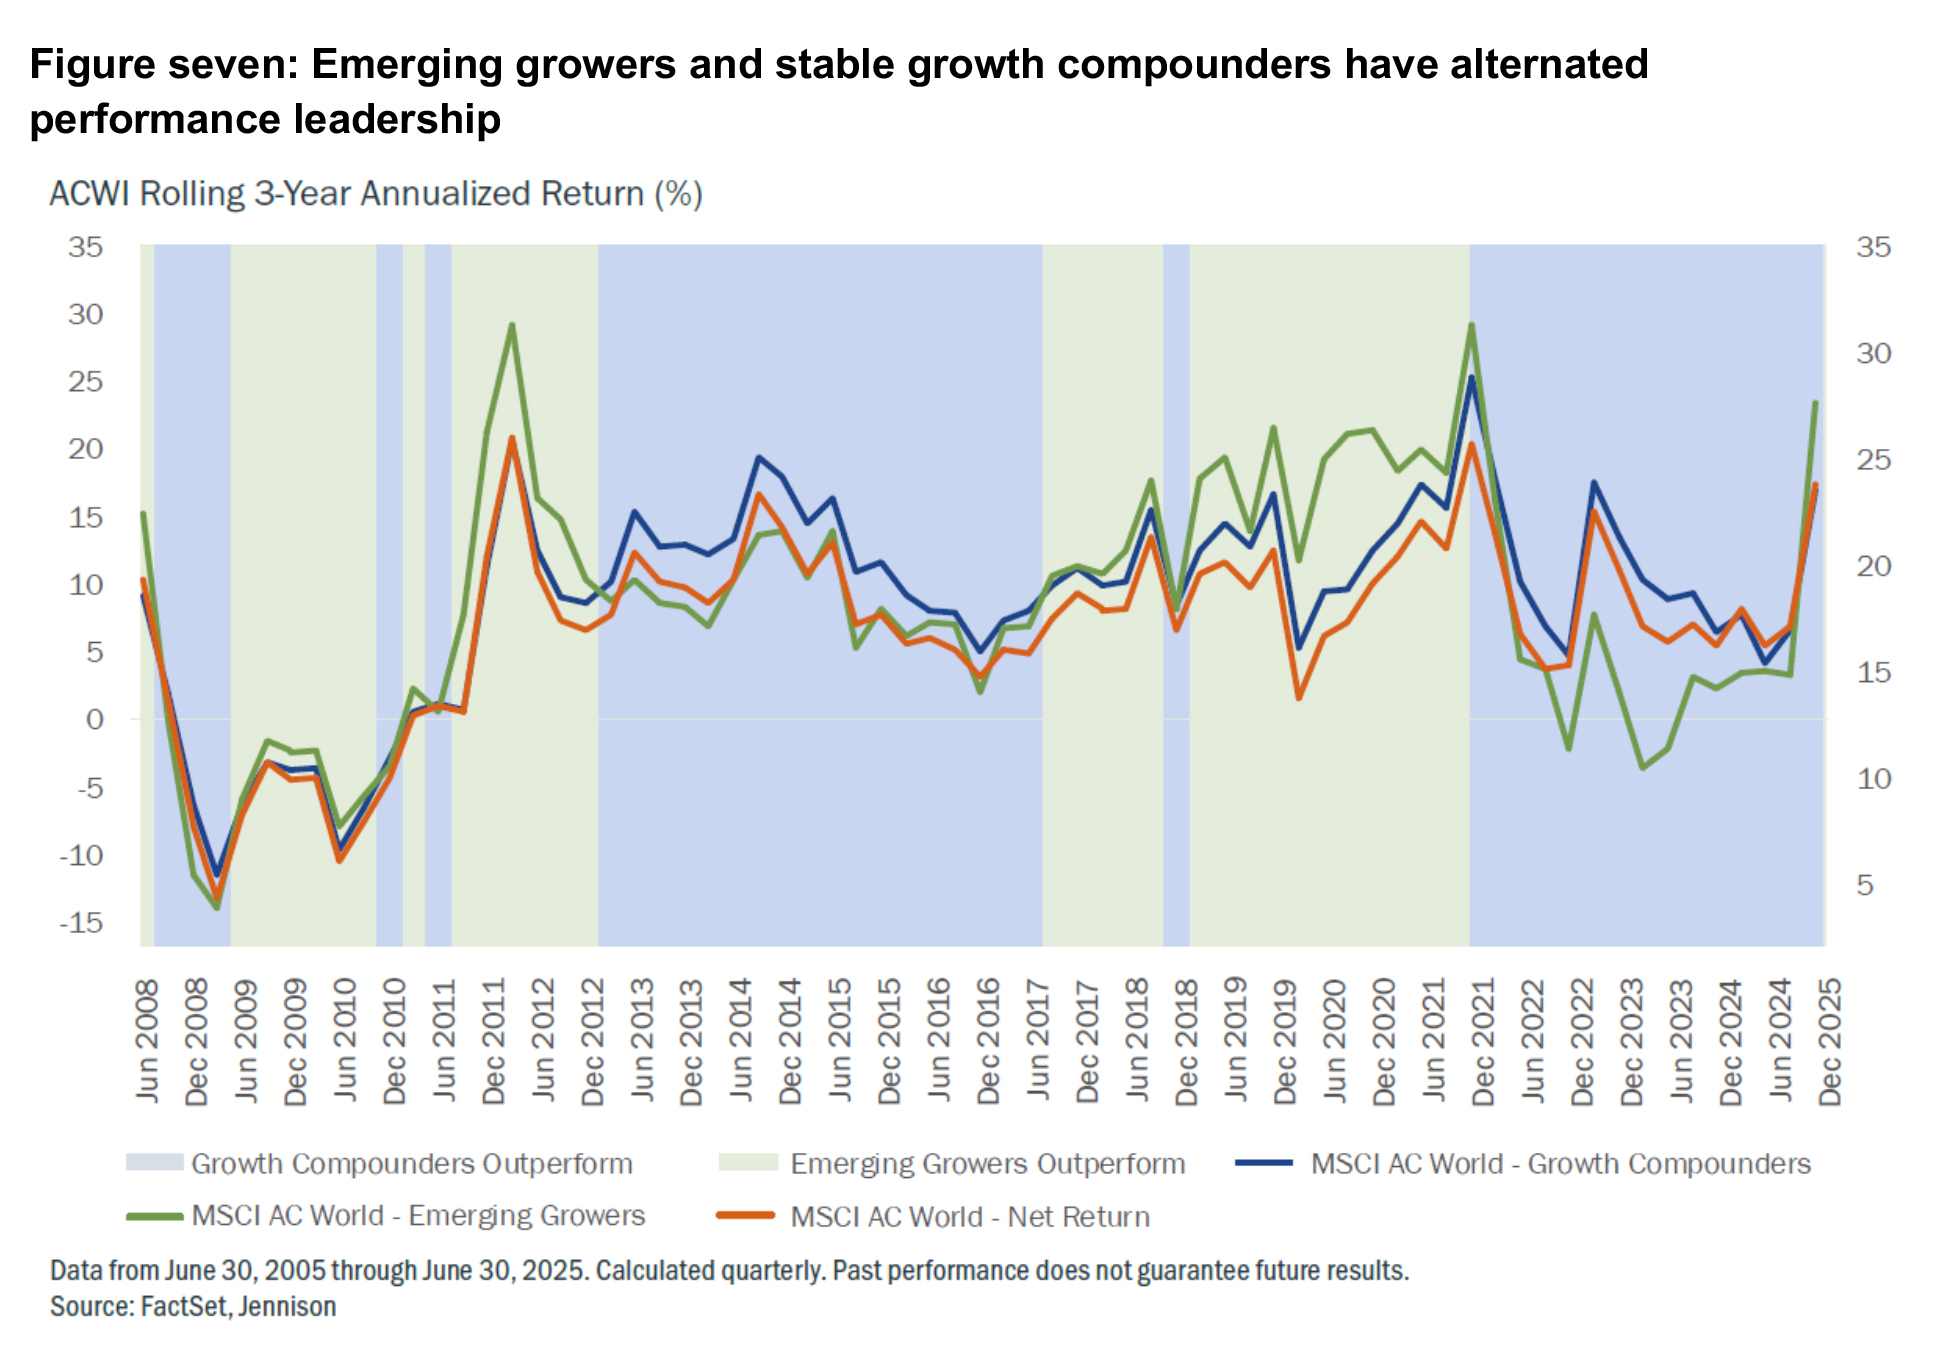
The risk and return profiles of emerging growers versus stable growth compounders were compared on a rolling 3-year basis. ACWI emerging growers and stable growth compounders generally outperformed the index, but with some important nuances.
Emerging growers generated the highest excess returns from mid-2011 to about mid-2013, and since mid-2017 until the sell-off in 2022 (figure seven). Notably, stable growth compounders led performance for several years, from early 2013 to mid-2017 and from early 2022 through early 2025. Moreover, while emerging growers occasionally lagged the broad markets, stable growth compounders have outperformed the benchmark since early 2012.
The volatility of emerging growers and stable growth compounders were calculated over the same time period (figure eight). The higher volatility of emerging growers compared to the index and stable growth compounders is in line with their higher growth, longer duration profile. Stable growth compounders have often exhibited lower volatility than the broad market historically, but growth companies in general have had higher standard deviation in recent years.
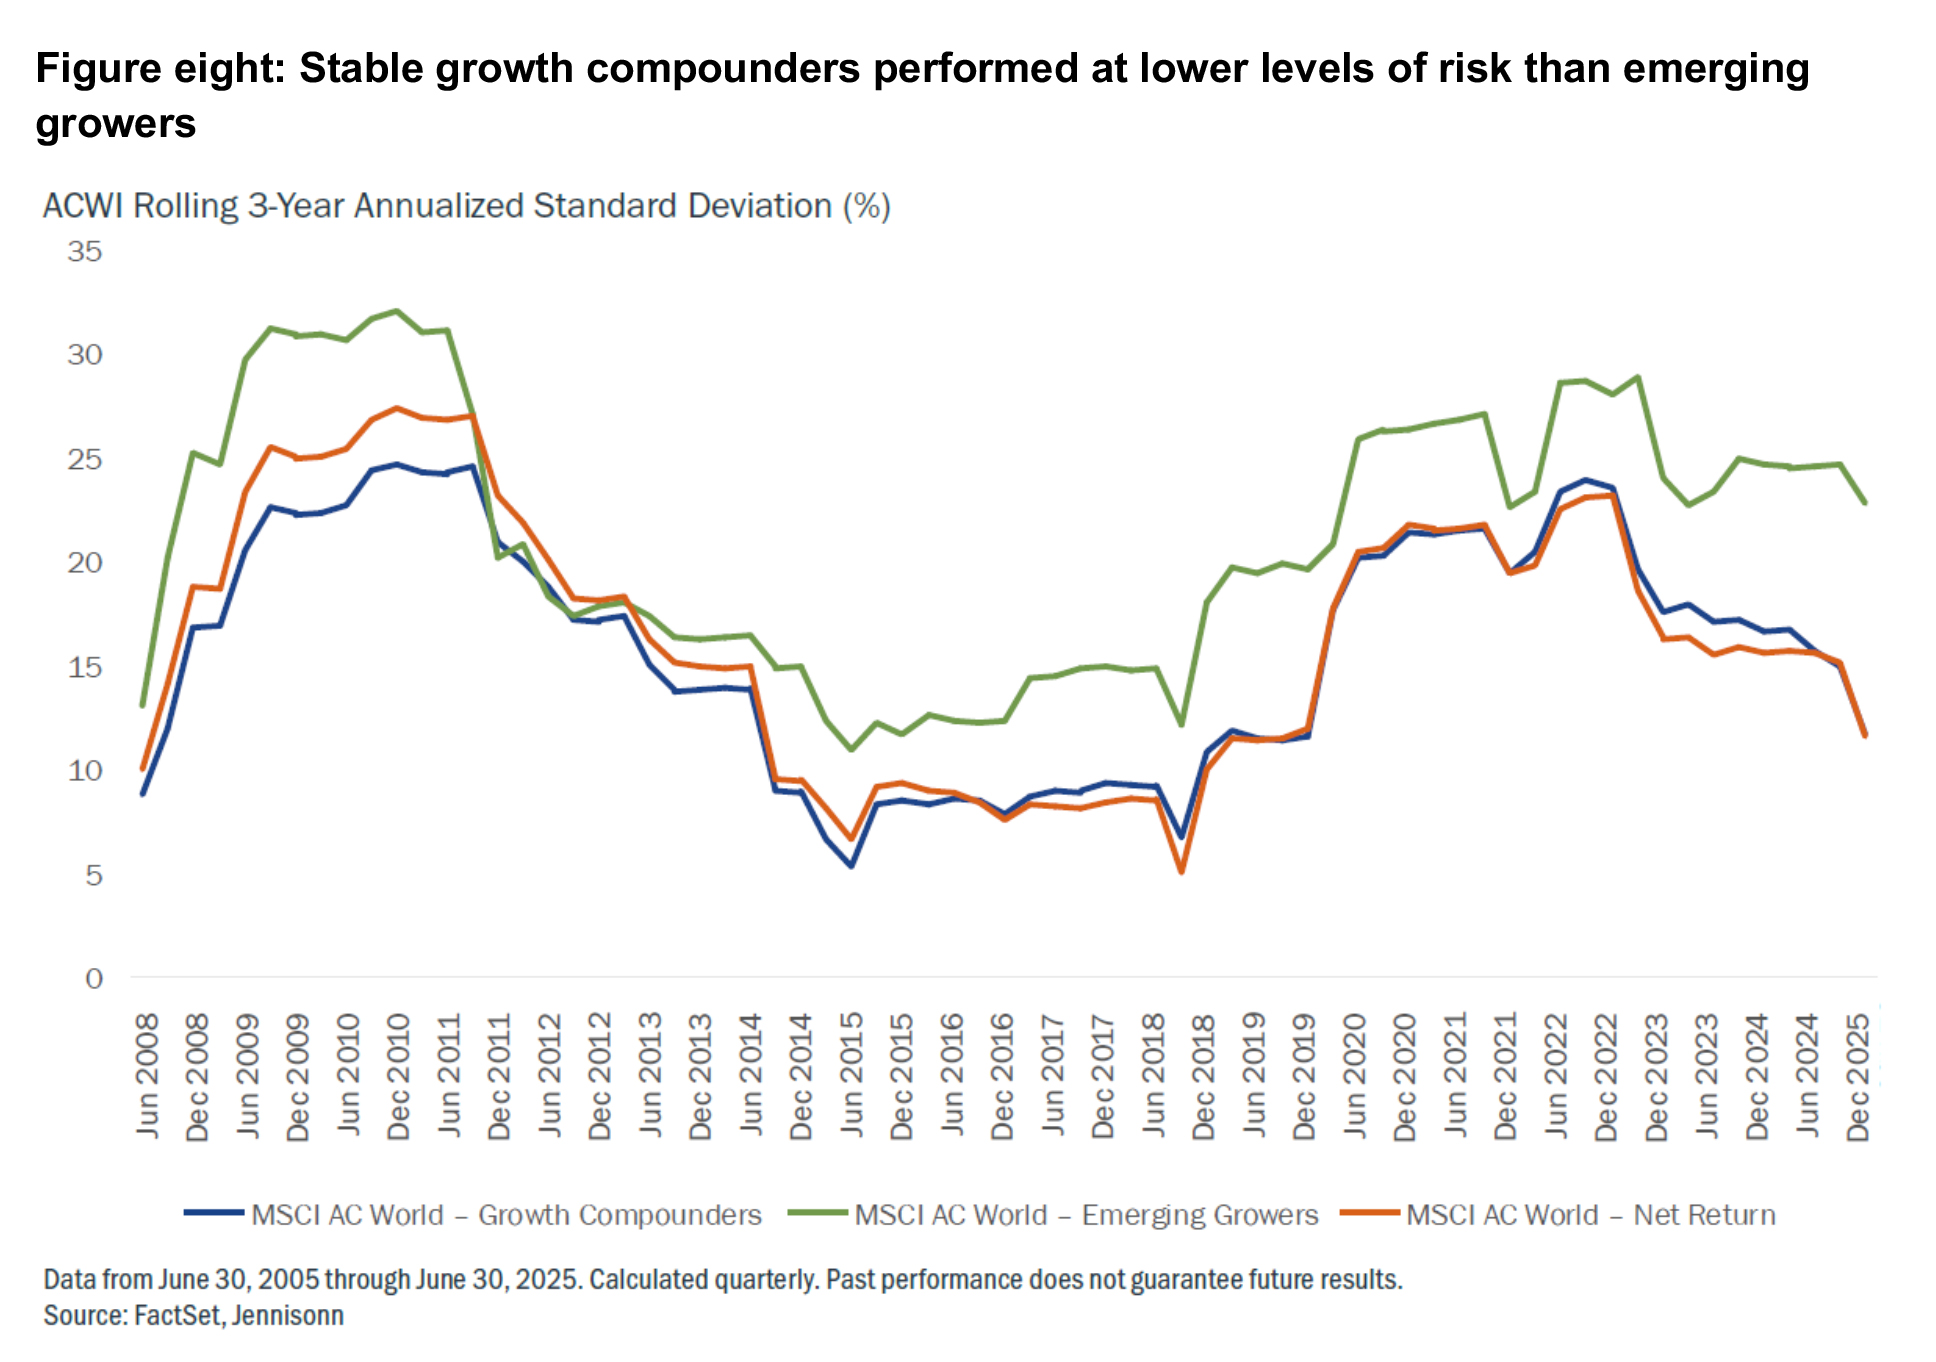
The analysis shows that emerging grower and stable growth compounder performance outcomes are mostly consistent with the characteristics of the underlying companies in the two groups. Emerging growers tend to have more dynamic long-term growth potential but are more volatile; stable growth compounders are more established and less volatile. While each group had different risk and return profiles, both outperformed the index over time.
These patterns of performance tie back to the fact that markets are discounting mechanisms that reward visibility. To generate excess market returns, growth investors must be earlier and more accurate than the market in identifying companies with a clear path to profitability and inflection points in the growth rates of their revenue and earnings. After all, earnings growth has been a potent driver of returns.
Returns have tracked earnings growth
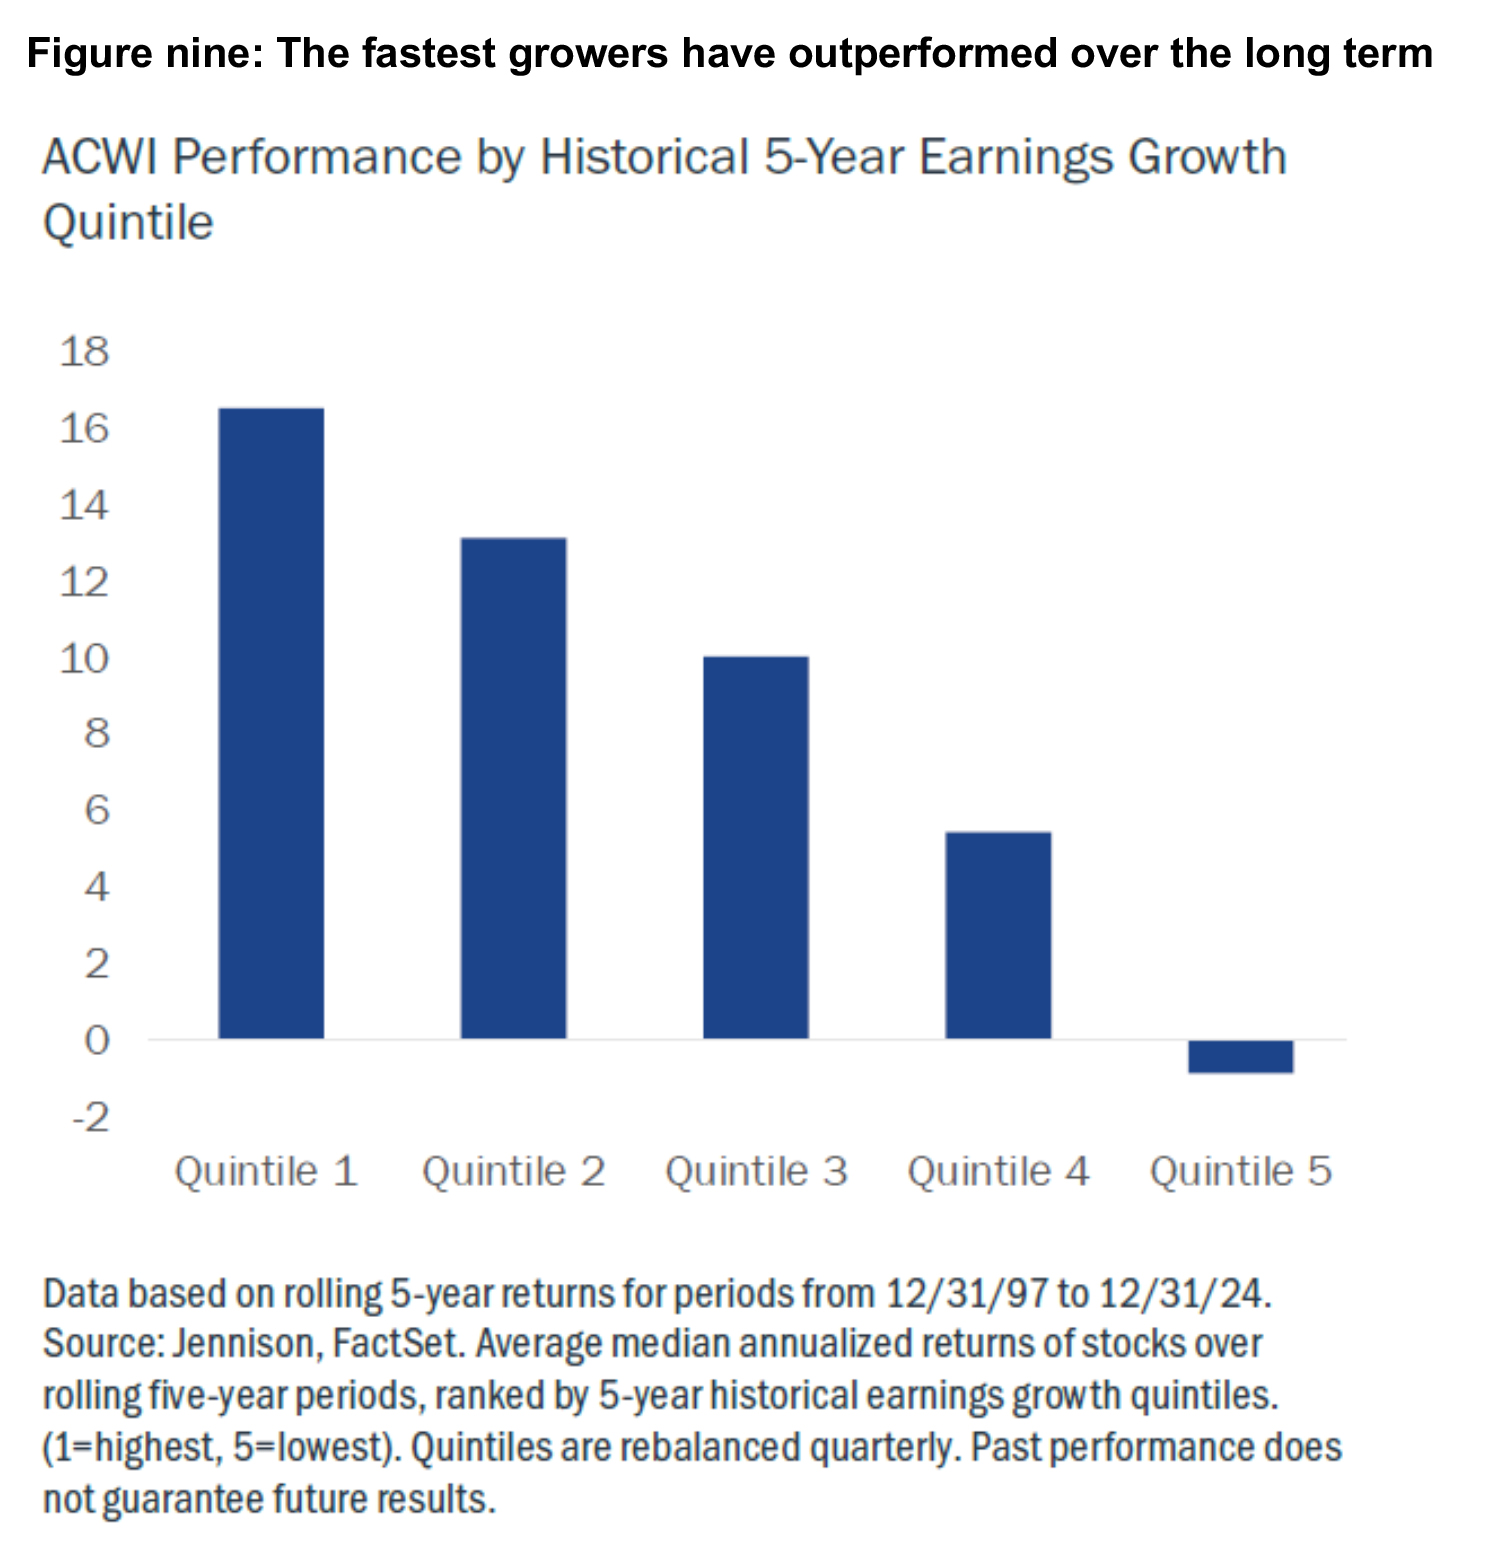
Over the past several decades, the companies with the fastest earnings growth have outperformed through a range of market environments (figure nine). Each company in the emerging growers and stable growth compounders proxy portfolios was mapped to the corresponding performance quintile, to test the hypothesis that they should be concentrated in the first two quintiles of returns. The results were in line with expectations.
The vast majority of emerging growers were concentrated in the top quintile of returns, which is an intuitive result as these companies are in the highest ranks of 5-year earnings growth. Stable growth compounders tended to cluster in the second quintile of returns, with some falling into the third quintile. This is consistent with the levels of earnings growth generated by these companies
Successful growth investing is an active challenge
Putting aside the reversal in returns over that time period, figure nine might suggest a strategy for successful long term growth investing: simply construct a portfolio of stocks from quintiles 1 and 2. It should come as little surprise, however, that the reality is far more complex.
Identifying in advance the companies that will deliver high and sustainable growth is extremely difficult. As a case in point, most companies fail to live up to consensus growth expectations (figure ten).
Companies with expected top quintile EPS growth (according to consensus) contrasted with the actual constituents of those quintiles five years later. Companies that met earnings expectations are “hits;” companies that did not meet expectations are “misses.”
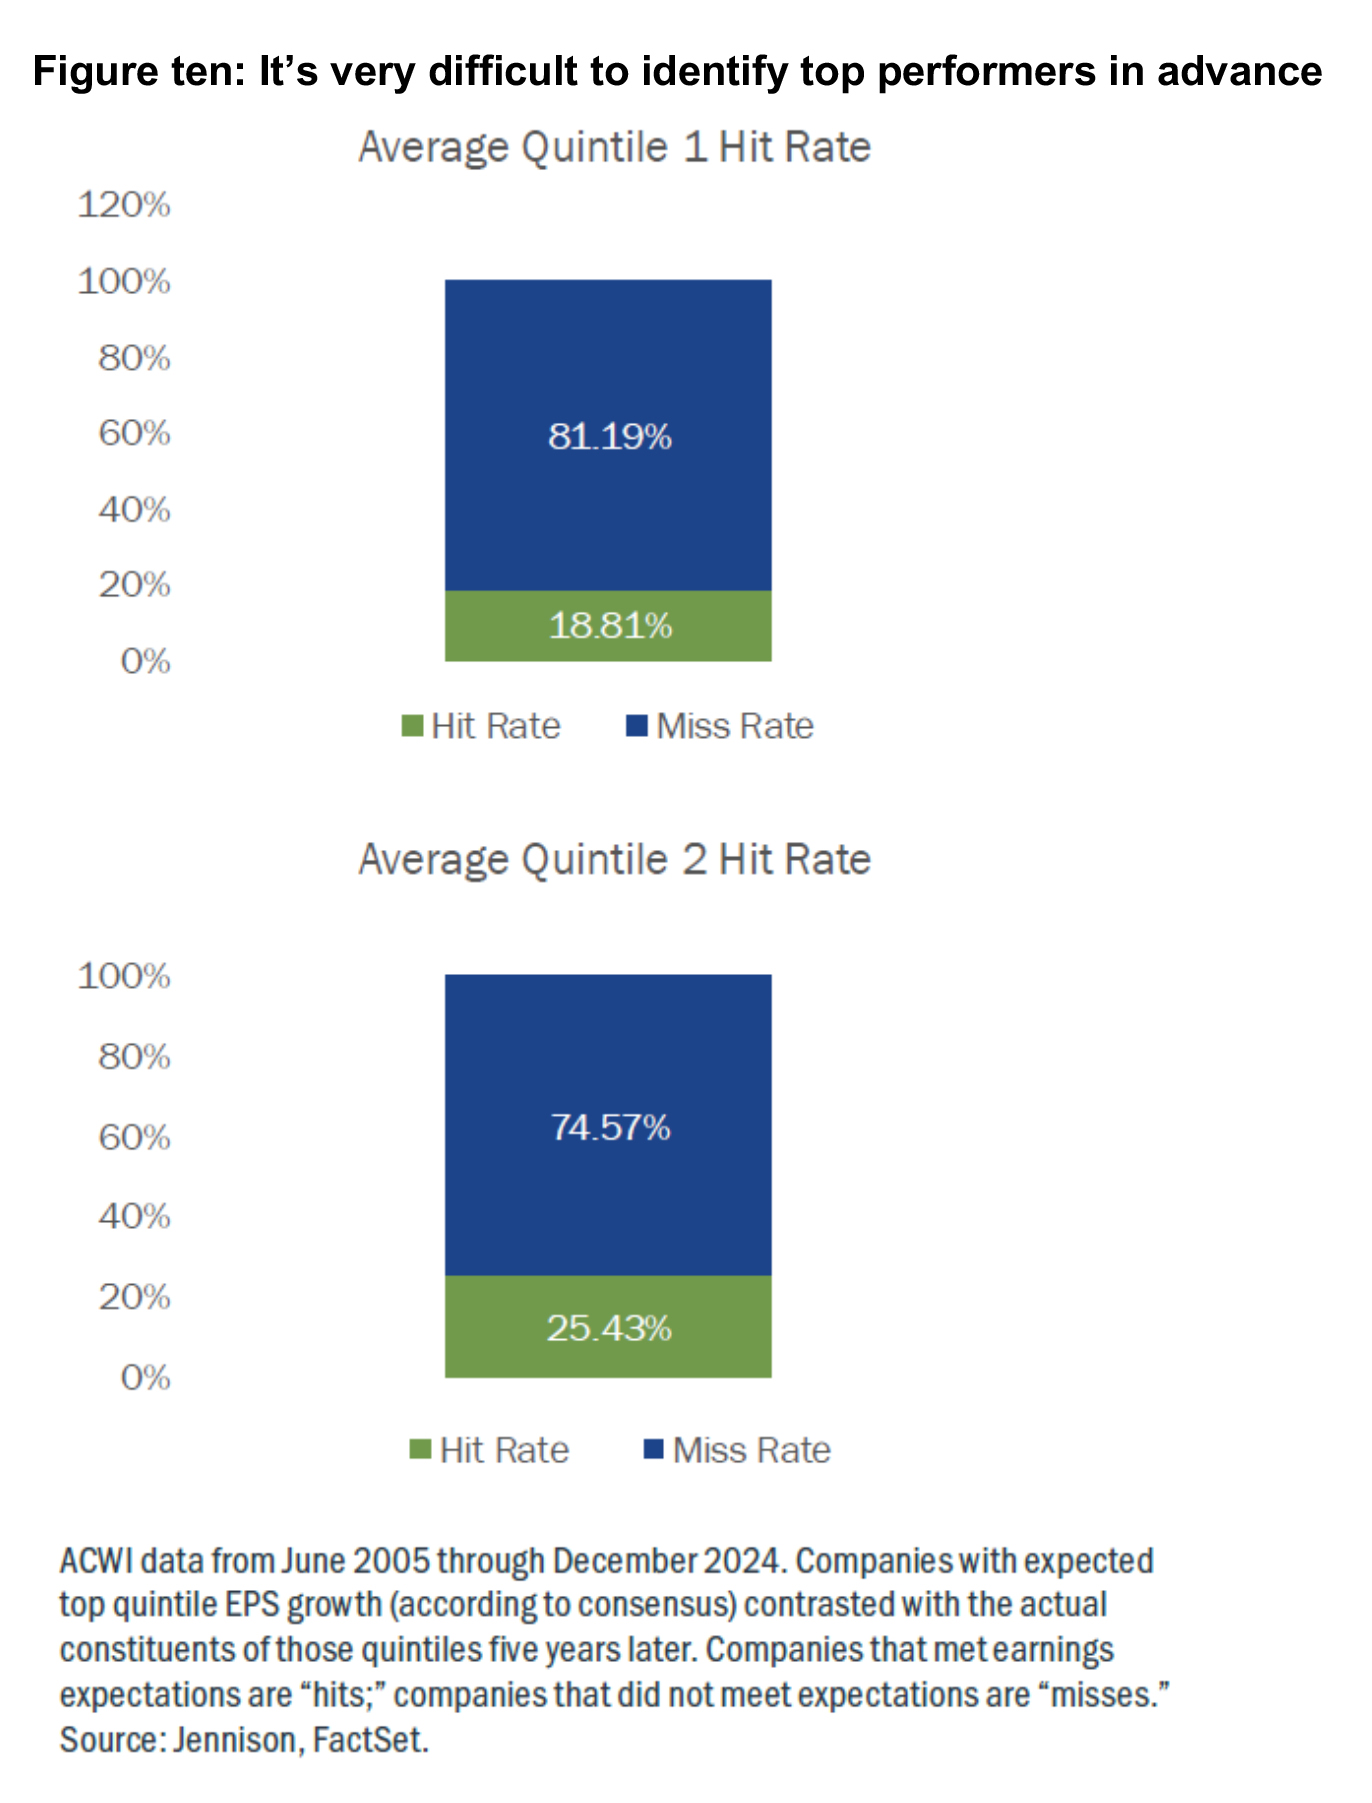
The result?
Less than one fifth of the companies that consensus estimates placed in quintile 1 (mostly emerging growers) met the mark. In quintile 2, the numbers were better – about 25% lived up to consensus expectations five years later.
This data shows that, most of the time, consensus earnings growth forecasts have been either too optimistic or too pessimistic. It also illustrates the market’s inefficiency and the potential benefits of having an experienced research function wholly focused on appraising growth opportunities via fundamental company research. Even small improvements in forecasting can add significantly to long-term returns.
Another example of the challenges of growth investing can be found in the way companies report earnings, the strength of which can be understated by evolving business models and conventional revenue recognition methods. In some cases, employing a different methodology—one that draws on measures such as free cashflow or enterprise value—can reveal underlying strength in a company’s valuation. This helps illustrate that successful growth investing can require active managers with the skill, experience, and resources to spot these irregularities and take advantage of them.
Navigating for the long term
A long-term perspective on investing is important, despite market uncertainty and volatility. Growth companies that offer differentiated products and services that create real value for society will generally continue to prosper. While demand may be uneven in the short term, the long-term trend is typically positive.
As we have explored, the spectrum of growth is not a monolith. By distinguishing between emerging growers and stable growth compounders, investors can better understand the distinct risk and return profiles that dictate performance across different cycles. While these two groups offer compelling long-term potential, their paths often diverge when market conditions shift, making this framework essential for staying the course when growth falls out of favour.
This aggregated analysis can be viewed as a framework for growth investing. However, Jennison emphasises its belief that success lies in the basic building blocks of fundamental security selection, which, when done well and consistently by a skilled active manager, meaningfully contributes to a long-term investment goal. It is a challenging proposition, but as history has shown, for the active manager, it is a journey that remains profoundly rewarding.
Take the FAAA accredited quiz to earn 0.5 CPD hour:
CPD Quiz
The following CPD quiz is accredited by the FAAA at 0.5 hour.
Legislated CPD Area: Technical Competence (0.5 hrs)
ASIC Knowledge Requirements: Securities (0.5 hrs)
please log in to start this quiz
———
Notes:
[1] Based on MSCI All Country World Index 5-year rolling returns from 1997-2024
[2] Based on MSCI All Country World Index. For this analysis we used company data going to back to 2005, the first year in our view with enough data to ensure thorough and meaningful analysis.
[3] Revenue growth based on 3-year historical revenue growth and earnings growth based on 5-year historical EPS Growth (equivalent to 736 of an average of 2,646 companies in the MSCI ACWI from June 2005 through June 2025). When we raise the growth threshold to 15% based on 3-year historical revenue growth, and 20% based on 5-year historical EPS Growth, this proportion shrinks to about a tenth of the index (or 11%, equivalent to 297 companies).
Important information: While every care has been taken in the preparation of this document, neither Jennison LLC nor PAN-Tribal Asset Management Pty Limited ABN 35 600 756 41 AFSL 462065 make any representation as to the accuracy or completeness of any statement in it, including without limitation, any forecasts. Past performance is not a reliable indicator of future performance. This document has been prepared for the purpose of providing general information, without taking account of any particular investor’s objectives, financial situation or needs. An investor should, before making any investment decisions, consider the appropriateness of the information in this document, and seek professional advice, having regard to the investor’s objectives, financial situation and needs. This document has been prepared for use by sophisticated investors and investment professionals only and is solely for the use of the party to whom it is provided. The views expressed herein are those of Jennison LLC investment professionals at the time the comments were made and may not be reflective of their current opinions and are subject to change without notice. Forecasts may not be achieved and are not a guarantee or reliable indicator of future results. Certain third party information in this document has been obtained from sources that Jennison believes to be reliable as of the date presented; however, Jennison cannot guarantee the accuracy of such information, assure its completeness, or warrant such information will not be changed. Jennison has no obligation to update any or all such third party information. There is no assurance that any forecasts, targets, or estimates will be attained. Jennison uses the Global Industry Classification Standard (GICS®) for categorizing companies into sectors and industries. The Global Industry Classification Standard (GICS®) is the exclusive intellectual property of MSCI Inc. (MSCI) and Standard & Poor’s Financial Services, LLC (S&P). Neither MSCI, S&P, their affiliates, nor any of their third party providers (“GICS Parties”) makes any representations or warranties, express or implied, with respect to GICS or the results to be obtained by the use thereof, and expressly disclaim all warranties, including warranties of accuracy, completeness, merchantability and fitness for a particular purpose. The GICS Parties shall not have any liability for any direct, indirect, special, punitive, consequential or any other damages (including lost profits) even if notified of such damages. The S&P index(es) (“Index”) is a product of S&P Dow Jones Indices LLC and/or its affiliates and has been licensed for use by Jennison LLC. Copyright © 2022 S&P Dow Jones Indices LLC, a division of S&P Global, Inc., and/or its affiliates. All rights reserved. Redistribution or reproduction in whole or in part are prohibited without written permission of S&P Dow Jones Indices LLC. For more information on any of S&P Dow Jones Indices LLC’s indices please visit www.spdji.com. S&P® is a registered trademark of S&P Global and Dow Jones® is a registered trademark of Dow Jones Trademark Holdings LLC. The Russell 1000® Growth Index measures the performance of the large cap growth segment of the US equity universe. It includes those Russell 1000 companies with relatively higher price-to-book ratios, higher I/B/E/S forecast medium term (2 year) growth and higher sales per share historical growth (5 years). The Russell 1000® Index is an index of approximately 1,000 of the largest companies in the U.S. equity market. The Russell 1000 is a subset of the Russell 3000 Index. It represents the top companies by market capitalization. It is considered a bellwether index for large cap investing. The financial indices referenced herein are provided for informational purposes only. The MSCI All Country World Index (MSCI ACWI) is a free float- adjusted market capitalisation weighted index designed to measure the equity market performance of developed and emerging markets. The MSCI ACWI comprises 24 developed country market indexes and 21 emerging market country indexes. The financial indexes referenced herein are provided for informational purposes only. Financial indices are unmanaged and assume reinvestment of dividends but do not reflect the impact of fees, applicable taxes or trading costs which may also reduce the returns shown. All indices referenced in this presentation are registered trade names or trademark/service marks of third parties. References to such trade names or trademark/service marks and data is proprietary and confidential and cannot be redistributed without Jennison’s prior consent. Investors cannot directly invest in an index.
CPD Quiz
The following CPD quiz is accredited by the FAAA at 0.5 hour.
Legislated CPD Area: Technical Competence (0.5 hrs)
ASIC Knowledge Requirements: Securities (0.5 hrs)
please log in to start this quiz———
Notes:
[1] Based on MSCI All Country World Index 5-year rolling returns from 1997-2024
[2] Based on MSCI All Country World Index. For this analysis we used company data going to back to 2005, the first year in our view with enough data to ensure thorough and meaningful analysis.
[3] Revenue growth based on 3-year historical revenue growth and earnings growth based on 5-year historical EPS Growth (equivalent to 736 of an average of 2,646 companies in the MSCI ACWI from June 2005 through June 2025). When we raise the growth threshold to 15% based on 3-year historical revenue growth, and 20% based on 5-year historical EPS Growth, this proportion shrinks to about a tenth of the index (or 11%, equivalent to 297 companies).
Important information: While every care has been taken in the preparation of this document, neither Jennison LLC nor PAN-Tribal Asset Management Pty Limited ABN 35 600 756 41 AFSL 462065 make any representation as to the accuracy or completeness of any statement in it, including without limitation, any forecasts. Past performance is not a reliable indicator of future performance. This document has been prepared for the purpose of providing general information, without taking account of any particular investor’s objectives, financial situation or needs. An investor should, before making any investment decisions, consider the appropriateness of the information in this document, and seek professional advice, having regard to the investor’s objectives, financial situation and needs. This document has been prepared for use by sophisticated investors and investment professionals only and is solely for the use of the party to whom it is provided. The views expressed herein are those of Jennison LLC investment professionals at the time the comments were made and may not be reflective of their current opinions and are subject to change without notice. Forecasts may not be achieved and are not a guarantee or reliable indicator of future results. Certain third party information in this document has been obtained from sources that Jennison believes to be reliable as of the date presented; however, Jennison cannot guarantee the accuracy of such information, assure its completeness, or warrant such information will not be changed. Jennison has no obligation to update any or all such third party information. There is no assurance that any forecasts, targets, or estimates will be attained. Jennison uses the Global Industry Classification Standard (GICS®) for categorizing companies into sectors and industries. The Global Industry Classification Standard (GICS®) is the exclusive intellectual property of MSCI Inc. (MSCI) and Standard & Poor’s Financial Services, LLC (S&P). Neither MSCI, S&P, their affiliates, nor any of their third party providers (“GICS Parties”) makes any representations or warranties, express or implied, with respect to GICS or the results to be obtained by the use thereof, and expressly disclaim all warranties, including warranties of accuracy, completeness, merchantability and fitness for a particular purpose. The GICS Parties shall not have any liability for any direct, indirect, special, punitive, consequential or any other damages (including lost profits) even if notified of such damages. The S&P index(es) (“Index”) is a product of S&P Dow Jones Indices LLC and/or its affiliates and has been licensed for use by Jennison LLC. Copyright © 2022 S&P Dow Jones Indices LLC, a division of S&P Global, Inc., and/or its affiliates. All rights reserved. Redistribution or reproduction in whole or in part are prohibited without written permission of S&P Dow Jones Indices LLC. For more information on any of S&P Dow Jones Indices LLC’s indices please visit www.spdji.com. S&P® is a registered trademark of S&P Global and Dow Jones® is a registered trademark of Dow Jones Trademark Holdings LLC. The Russell 1000® Growth Index measures the performance of the large cap growth segment of the US equity universe. It includes those Russell 1000 companies with relatively higher price-to-book ratios, higher I/B/E/S forecast medium term (2 year) growth and higher sales per share historical growth (5 years). The Russell 1000® Index is an index of approximately 1,000 of the largest companies in the U.S. equity market. The Russell 1000 is a subset of the Russell 3000 Index. It represents the top companies by market capitalization. It is considered a bellwether index for large cap investing. The financial indices referenced herein are provided for informational purposes only. The MSCI All Country World Index (MSCI ACWI) is a free float- adjusted market capitalisation weighted index designed to measure the equity market performance of developed and emerging markets. The MSCI ACWI comprises 24 developed country market indexes and 21 emerging market country indexes. The financial indexes referenced herein are provided for informational purposes only. Financial indices are unmanaged and assume reinvestment of dividends but do not reflect the impact of fees, applicable taxes or trading costs which may also reduce the returns shown. All indices referenced in this presentation are registered trade names or trademark/service marks of third parties. References to such trade names or trademark/service marks and data is proprietary and confidential and cannot be redistributed without Jennison’s prior consent. Investors cannot directly invest in an index.


Have feedback on this article? Contact Us
Earn CPD Points
 CPD: Consumer protection essentials – AFCA and advice complaints
As essential component of a robust framework for protecting financial consumers is the presence of mechanisms that hold individuals and organisations to account for causing consumer harm and allow consumers [...]
 CPD: A new approach to assessing risks in retirement
In our last article, we examined the common risks that can impact retirement. The financial risks we’re all acutely aware of: longevity risk, inflation risk, market risk and sequencing risk. [...]
 CPD: Ethics and financial abuse
Financial abuse is becoming more prevalent in Australian society. This article, proudly sponsored by GSFM, examines financial abuse in the context of an ethical financial advice practice. A lot of [...]
 CPD: Seeking stability
At a time of sweeping geopolitical change and clear challenges for riskier assets, bond markets offer a source of stability. Key takeaways The world has entered a period of geopolitical [...]
 CPD: The year ahead for fixed income markets
The forces shaping fixed-income markets found themselves at a confluence of economic, fiscal, and political factors heading into 2025. Inflation dynamics remained in flux, a new Treasury Department was in [...]