Mano Mohankumar
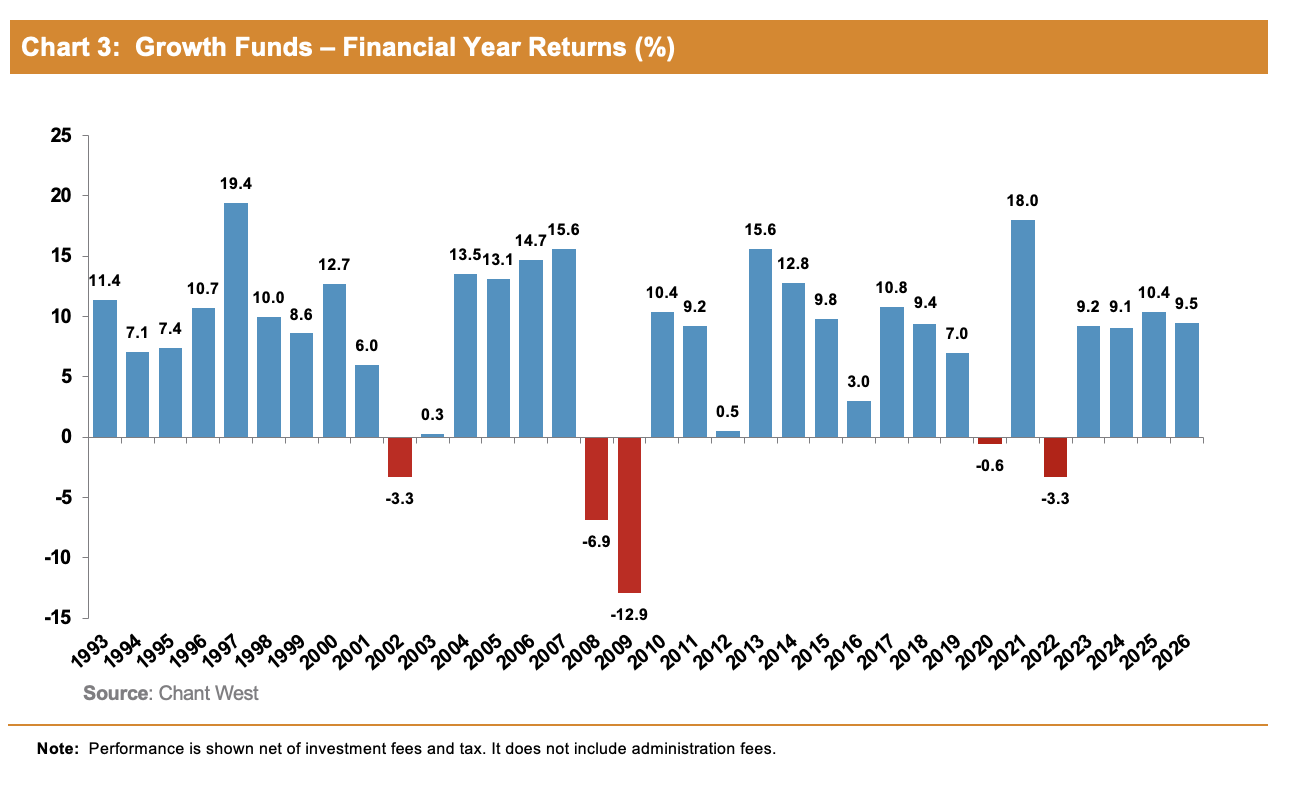
Despite tensions in the Middle East, lingering inflation concerns and periods of market volatility, super funds posted a fourth consecutive year of strong returns, with the median growth fund (61 to 80% in growth assets) gaining 9.5% for FY26. This follows the returns of 9.2% in FY23, 9.1% in FY24 and 10.4% in FY25, taking the cumulative return to an impressive 44% over the past four years. Members invested in higher-risk options would generally have enjoyed even stronger outcomes, reflecting the strength of share markets over this period.
Chant West Head of Super Investment, Mano Mohankumar, says that the FY26 result was once again driven by international shares, but it also helped that nearly all asset classes generated positive returns over the period. “International shares surged 25.5% in hedged terms, supported by continued enthusiasm for AI and robust corporate earnings. Despite the Australian dollar’s appreciation against most major currencies, the return in unhedged terms delivered an impressive 17%. International shares have the highest allocation within a typical growth fund, accounting for about 31% on average. By comparison, Australian shares, which on average has a weighting of 24%, returned a modest 6.2% over the year.
“Generally speaking, the better performing funds were those that had higher allocations to international shares, particularly where a larger proportion of that exposure was currency hedged. Diversification also provided some benefit given the wide dispersion of returns across asset classes, though it would have helped if you had lower allocations to traditional defensive assets. Australian bonds, international bonds and cash returned 1.5%, 2.9% and 3.9%, respectively, making them among the weakest performing asset classes over the year. The only asset class to finish in negative territory was Australian listed property, which declined 1.8%. In contrast, international listed real assets performed exceptionally well, with international listed infrastructure and listed property returning 17.2% and 14.3%, respectively.”
“We’re still collecting final returns for unlisted asset classes such as unlisted property, unlisted infrastructure and private equity. However, we expect infrastructure returns to finish the year in the 7% to 9% range, and estimate that private equity delivered gains of 8% to 11%. Unlisted property continued its recovery and is likely to post returns in the 5% to 7% range.”
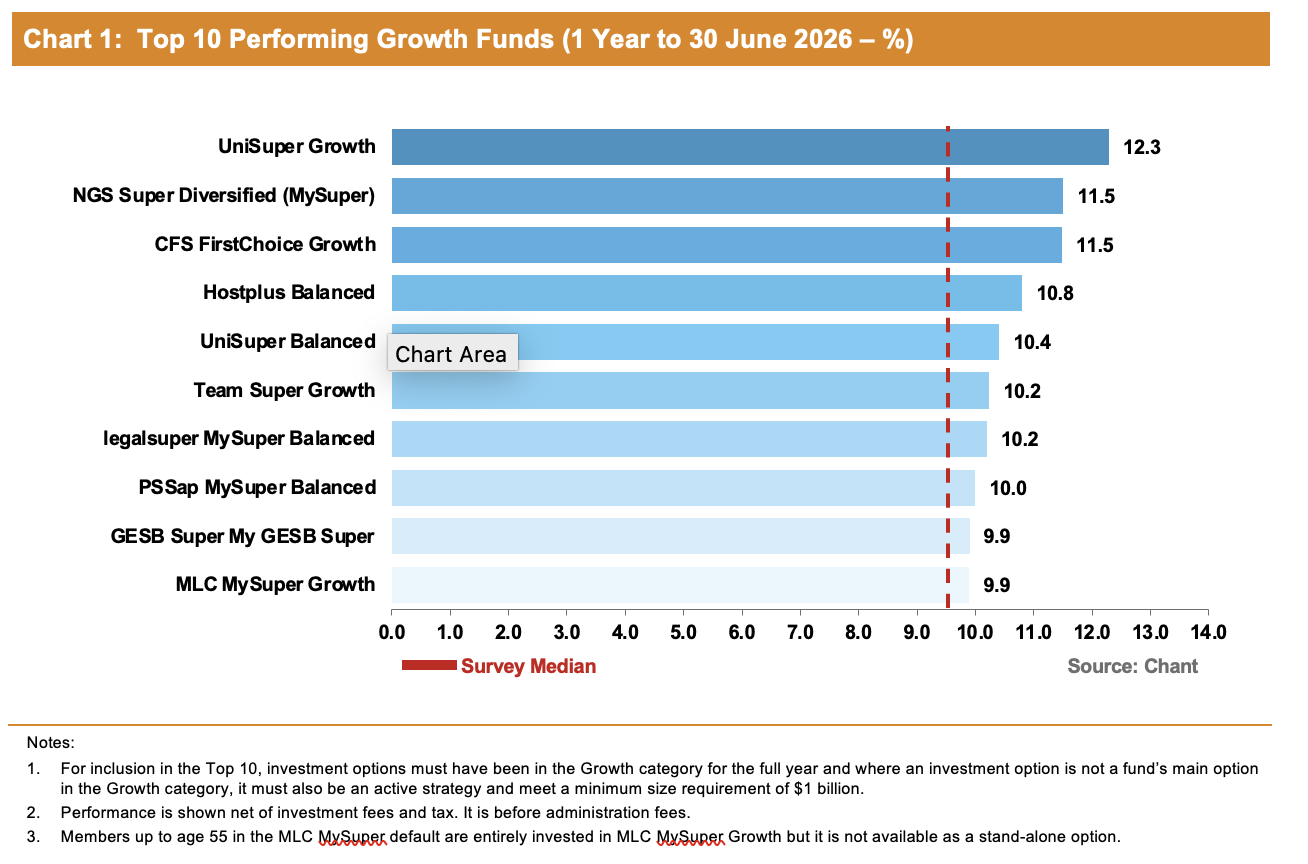
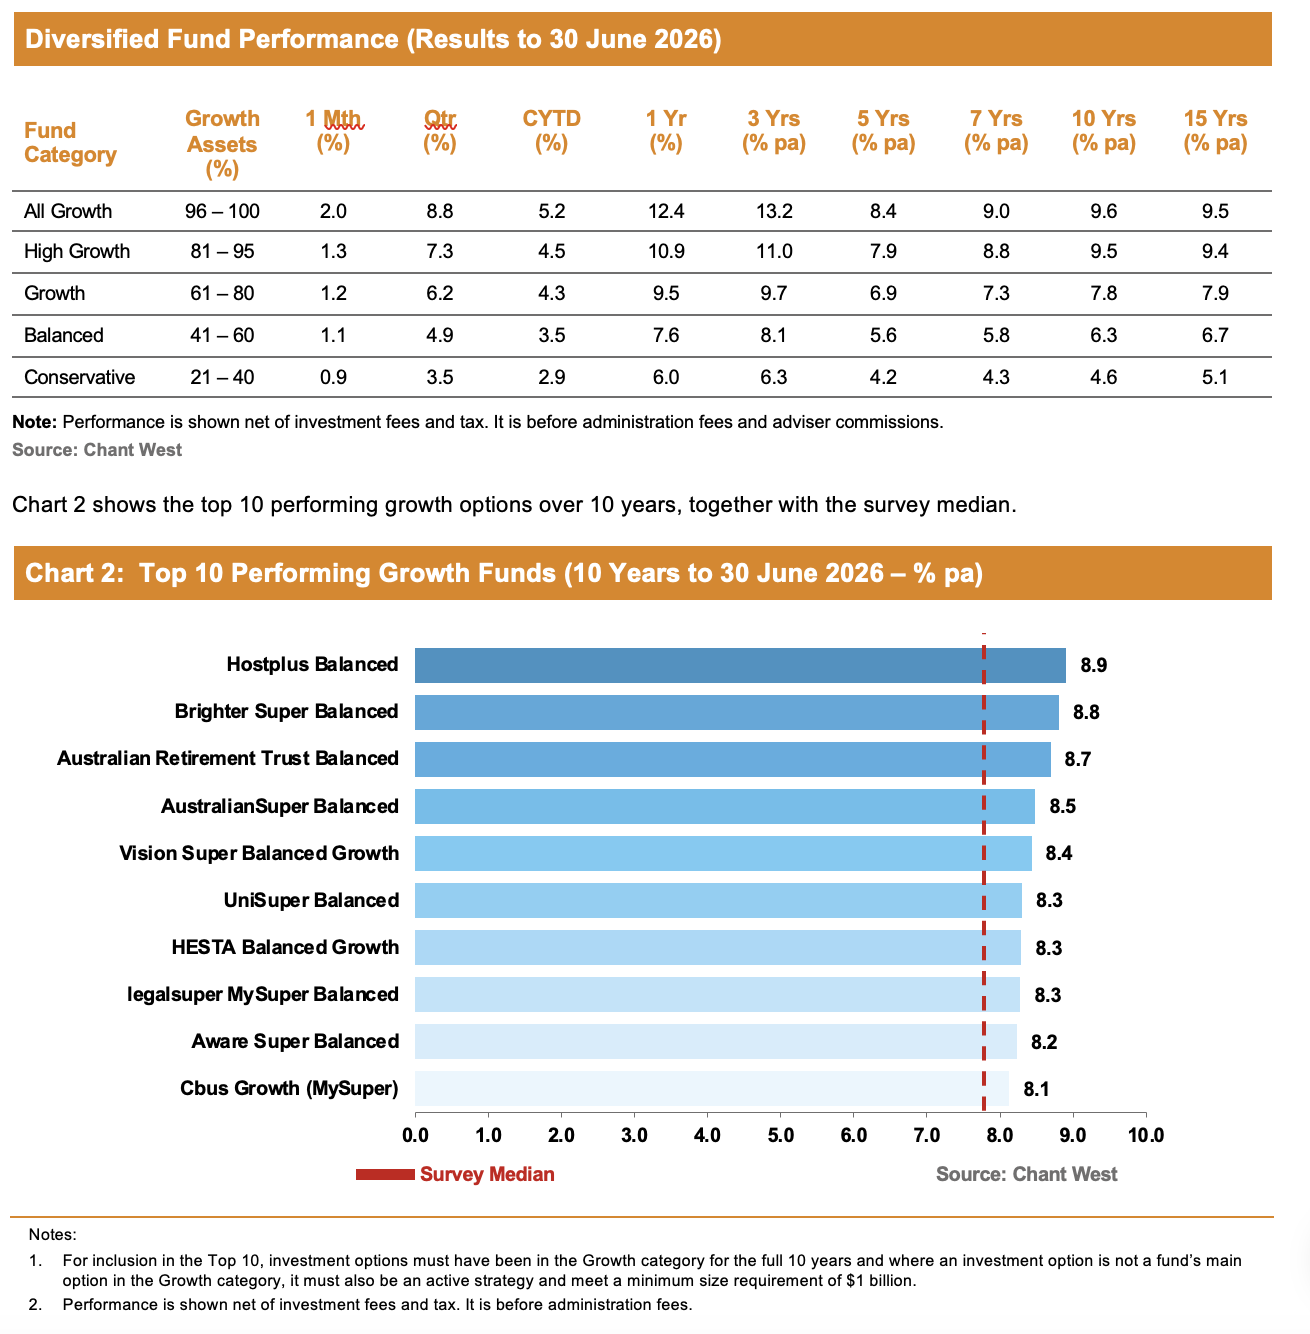
Chart 1 shows the top 10 performing growth options over the 2025/26 financial year, together with the survey median. However, long-term performance is far more important for super fund members. The top 10 performers over 10 years to 30 June 2026 are shown in Chart 2.
The table below compares the median performance to 30 June 2026 for each of the traditional diversified risk categories in Chant West’s Super Fund Performance Survey, ranging from All Growth to Conservative. Over the long term, all risk categories have met their typical return objectives, which range from CPI + 1.5% for Conservative funds to CPI + 4.25% for All Growth.
Funds continue to beat risk and return targets
While much of the focus at this time of year is on financial year performance, Mohankumar believes fund members always need to think long term. To provide further context, Chart 3 plots the year-by-year performance of the median growth fund over the 34 financial years since the introduction of compulsory super in July 1992. It shows that super funds have delivered on their risk and return objectives over the long term.
Mohankumar says that while super funds have delivered four straight years of returns of 9% or more, that level of return shouldn’t be thought of as normal. “The typical long-term return objective for growth funds is to beat inflation by 3.5% p.a., which translates to roughly 6% p.a. Since the introduction of compulsory super, the annualised return is 8% and the annual CPI increase is 2.7%, giving a real return of 5.3% p.a. – well above that 3.5% target. Even looking at the past 20 years, which includes three major share market downturns – the GFC in 2007-2009, COVID-19 in 2020 and the high inflation and rising interest rates in 2022 – super funds have returned 6.9% p.a., which is still comfortably ahead of the typical objective.
“Returns are important but so is risk, and most funds also set themselves a risk objective. Risk is typically expressed as the likelihood of a negative annual return, and typically a growth fund would aim to post no more than one negative return in five years on average. This objective would translate to no more than six negative years over the 34 financial years shown. As it turns out, there have only been five negative years, so the risk objective has been met as well as the performance objective.”
Long-term performance remains above target
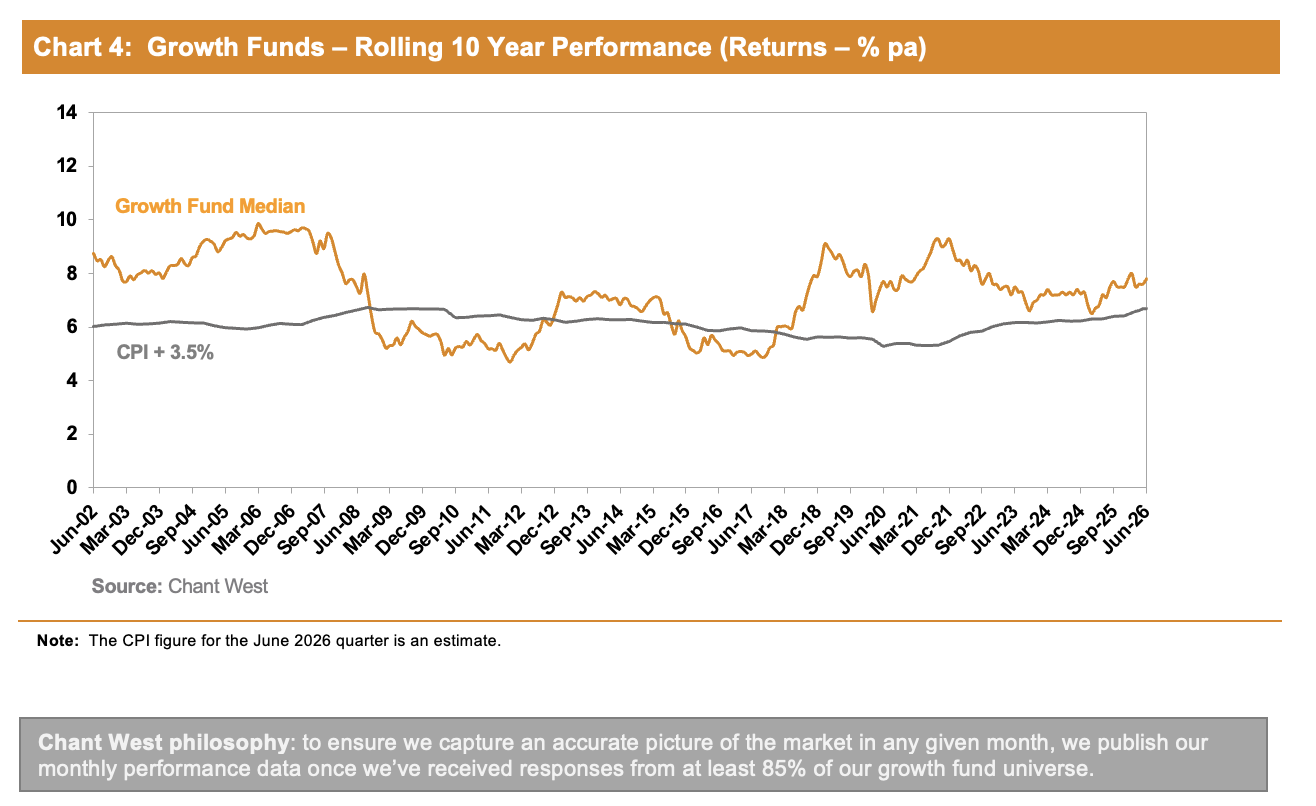
Chart 4 below shows that for about 73% of the time since compulsory super, the median growth fund has exceeded its return objective over rolling 10-year periods. This is a commonly used timeframe consistent with the long-term focus of super. The exceptions are two periods between mid-2008 and late-2017, when it fell behind. This is because of the devastating impact of the 16-month GFC period (end-October 2007 to end-February 2009) during which growth funds lost about 26% on average.