
National vacancy rate rises to 1.5%: Rental easing concentrated in Sydney and Melbourne as smaller capitals stay tight
SQM Research has released its latest data on residential property vacancy rates for October 2026.
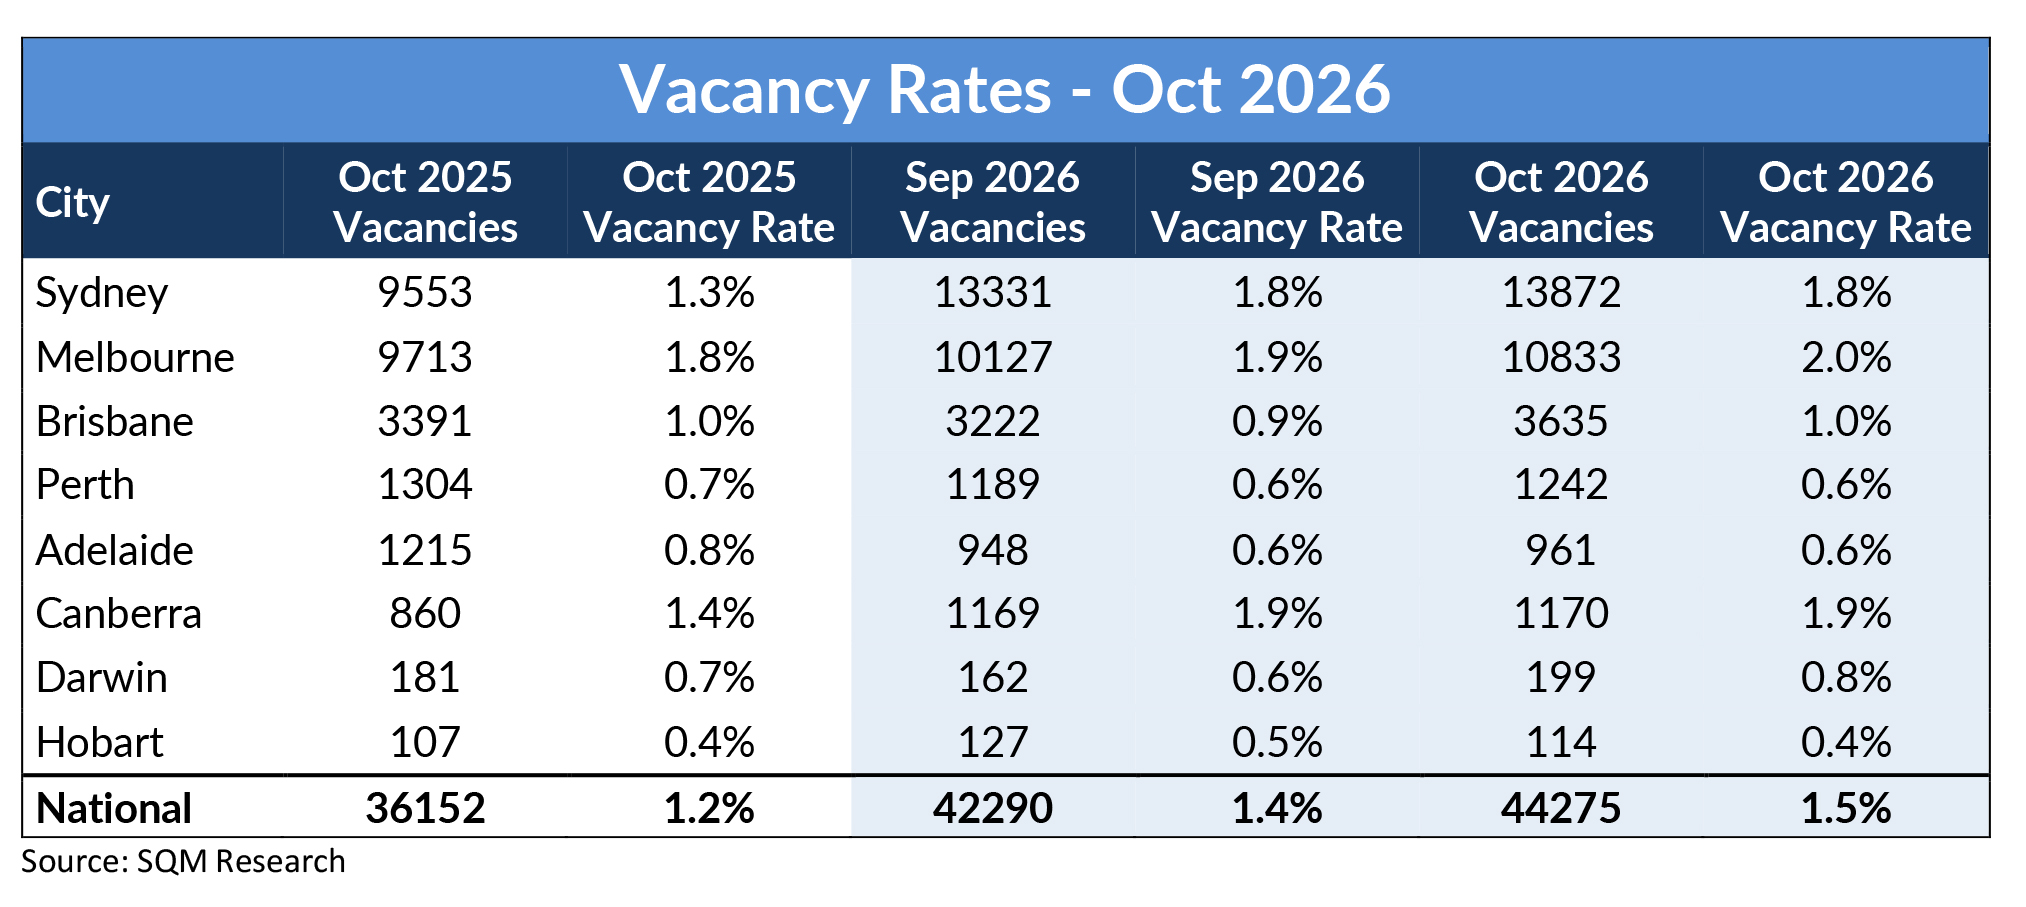
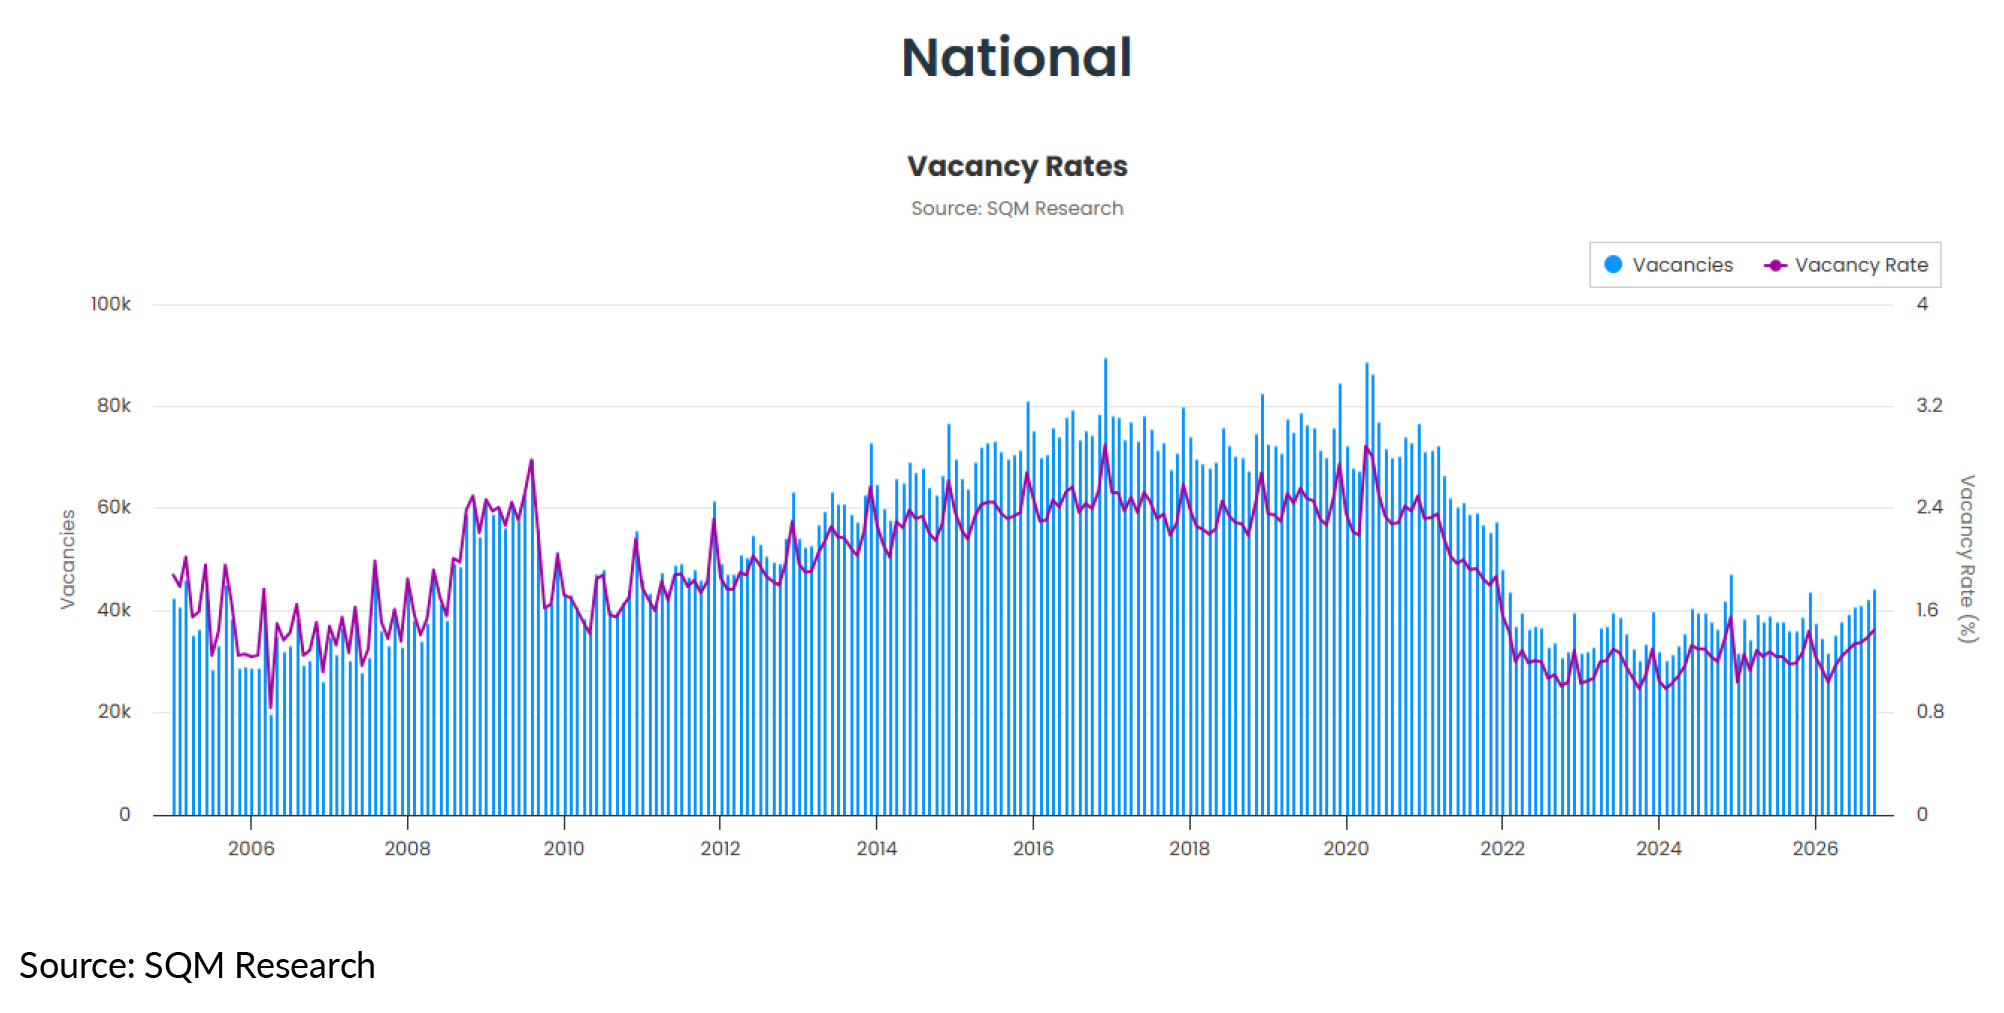
Australia’s national residential vacancy rate rose to 1.5% in October 2026, up from 1.4% in September and 1.3% in August. The total number of residential vacancies increased to 44,275 dwellings, up from 42,290 the previous month, marking a second consecutive monthly rise.
The longer-term shift is more significant. A year ago, the national vacancy rate stood at 1.2%, with 36,152 dwellings available. Over the past 12 months, more than 8,100 additional rental properties have become available nationally, suggesting that the extremely tight conditions of recent years are gradually giving way in parts of the market.
That easing, however, is far from evenly spread. Sydney alone accounts for more than half of the annual increase in vacancies, with 13,872 dwellings now available, around 45% more than a year ago. While Sydney’s vacancy rate held at 1.8% this month, the steady rise in available stock indicates that tenants in the city are gaining more choice. Melbourne has now reached 2.0%, the highest of any capital city, while Canberra remained at 1.9%.
Together, Sydney and Melbourne now hold more than half of all vacant rental properties nationally and contributed around 63% of this month’s increase. The rental market is increasingly being shaped by these two cities.
The picture is markedly different elsewhere. Across Brisbane, Perth, Adelaide, Darwin and Hobart, combined vacancies of 6,151 dwellings are slightly lower than a year ago, meaning tenants in these cities have seen little, if any, improvement in availability. Brisbane’s rate edged up to 1.0% and Darwin rose to 0.8%, but both remain historically tight. Perth and Adelaide held at 0.6%, while Hobart eased to 0.4%, the lowest of any capital and around one-fifth of Melbourne’s rate.
The key question over the coming months is whether the easing seen in the two largest cities begins to extend to the smaller capitals, or whether Australia’s rental market continues to move at two distinctly different speeds.
Capital city highlights
Sydney
The vacancy rate held at 1.8%, with 13,872 dwellings available, up from 13,331 in September. A year ago, the rate was 1.3%, with 9,553 vacancies recorded.
Melbourne
The vacancy rate rose to 2.0% from 1.9% in September, with 10,833 vacancies recorded. Melbourne now records the highest vacancy rate of any capital city, up from 1.8% a year ago.
Brisbane
The vacancy rate edged up to 1.0% from 0.9%, with 3,635 dwellings available. The rate is now back at its level of a year ago, although rental conditions remain tight.
Perth
The vacancy rate held steady at 0.6%, with 1,242 dwellings available. Perth remains one of Australia’s tightest rental markets.
Adelaide
The vacancy rate remained unchanged at 0.6%, with 961 dwellings available, compared with 1,215 a year ago. Rental supply continues to be constrained.
Canberra
The vacancy rate remained at 1.9%, with 1,170 dwellings available. Canberra continues to record relatively higher rental availability than most other capital cities, up from 1.4% a year ago.
Darwin
The vacancy rate increased to 0.8%, up from 0.6% in September, with 199 dwellings available. Despite the improvement, Darwin remains a tight rental market.
Hobart
The vacancy rate eased to 0.4% from 0.5% in September, with 114 dwellings available, the lowest vacancy rate of any capital city.
Advertised rents analysis
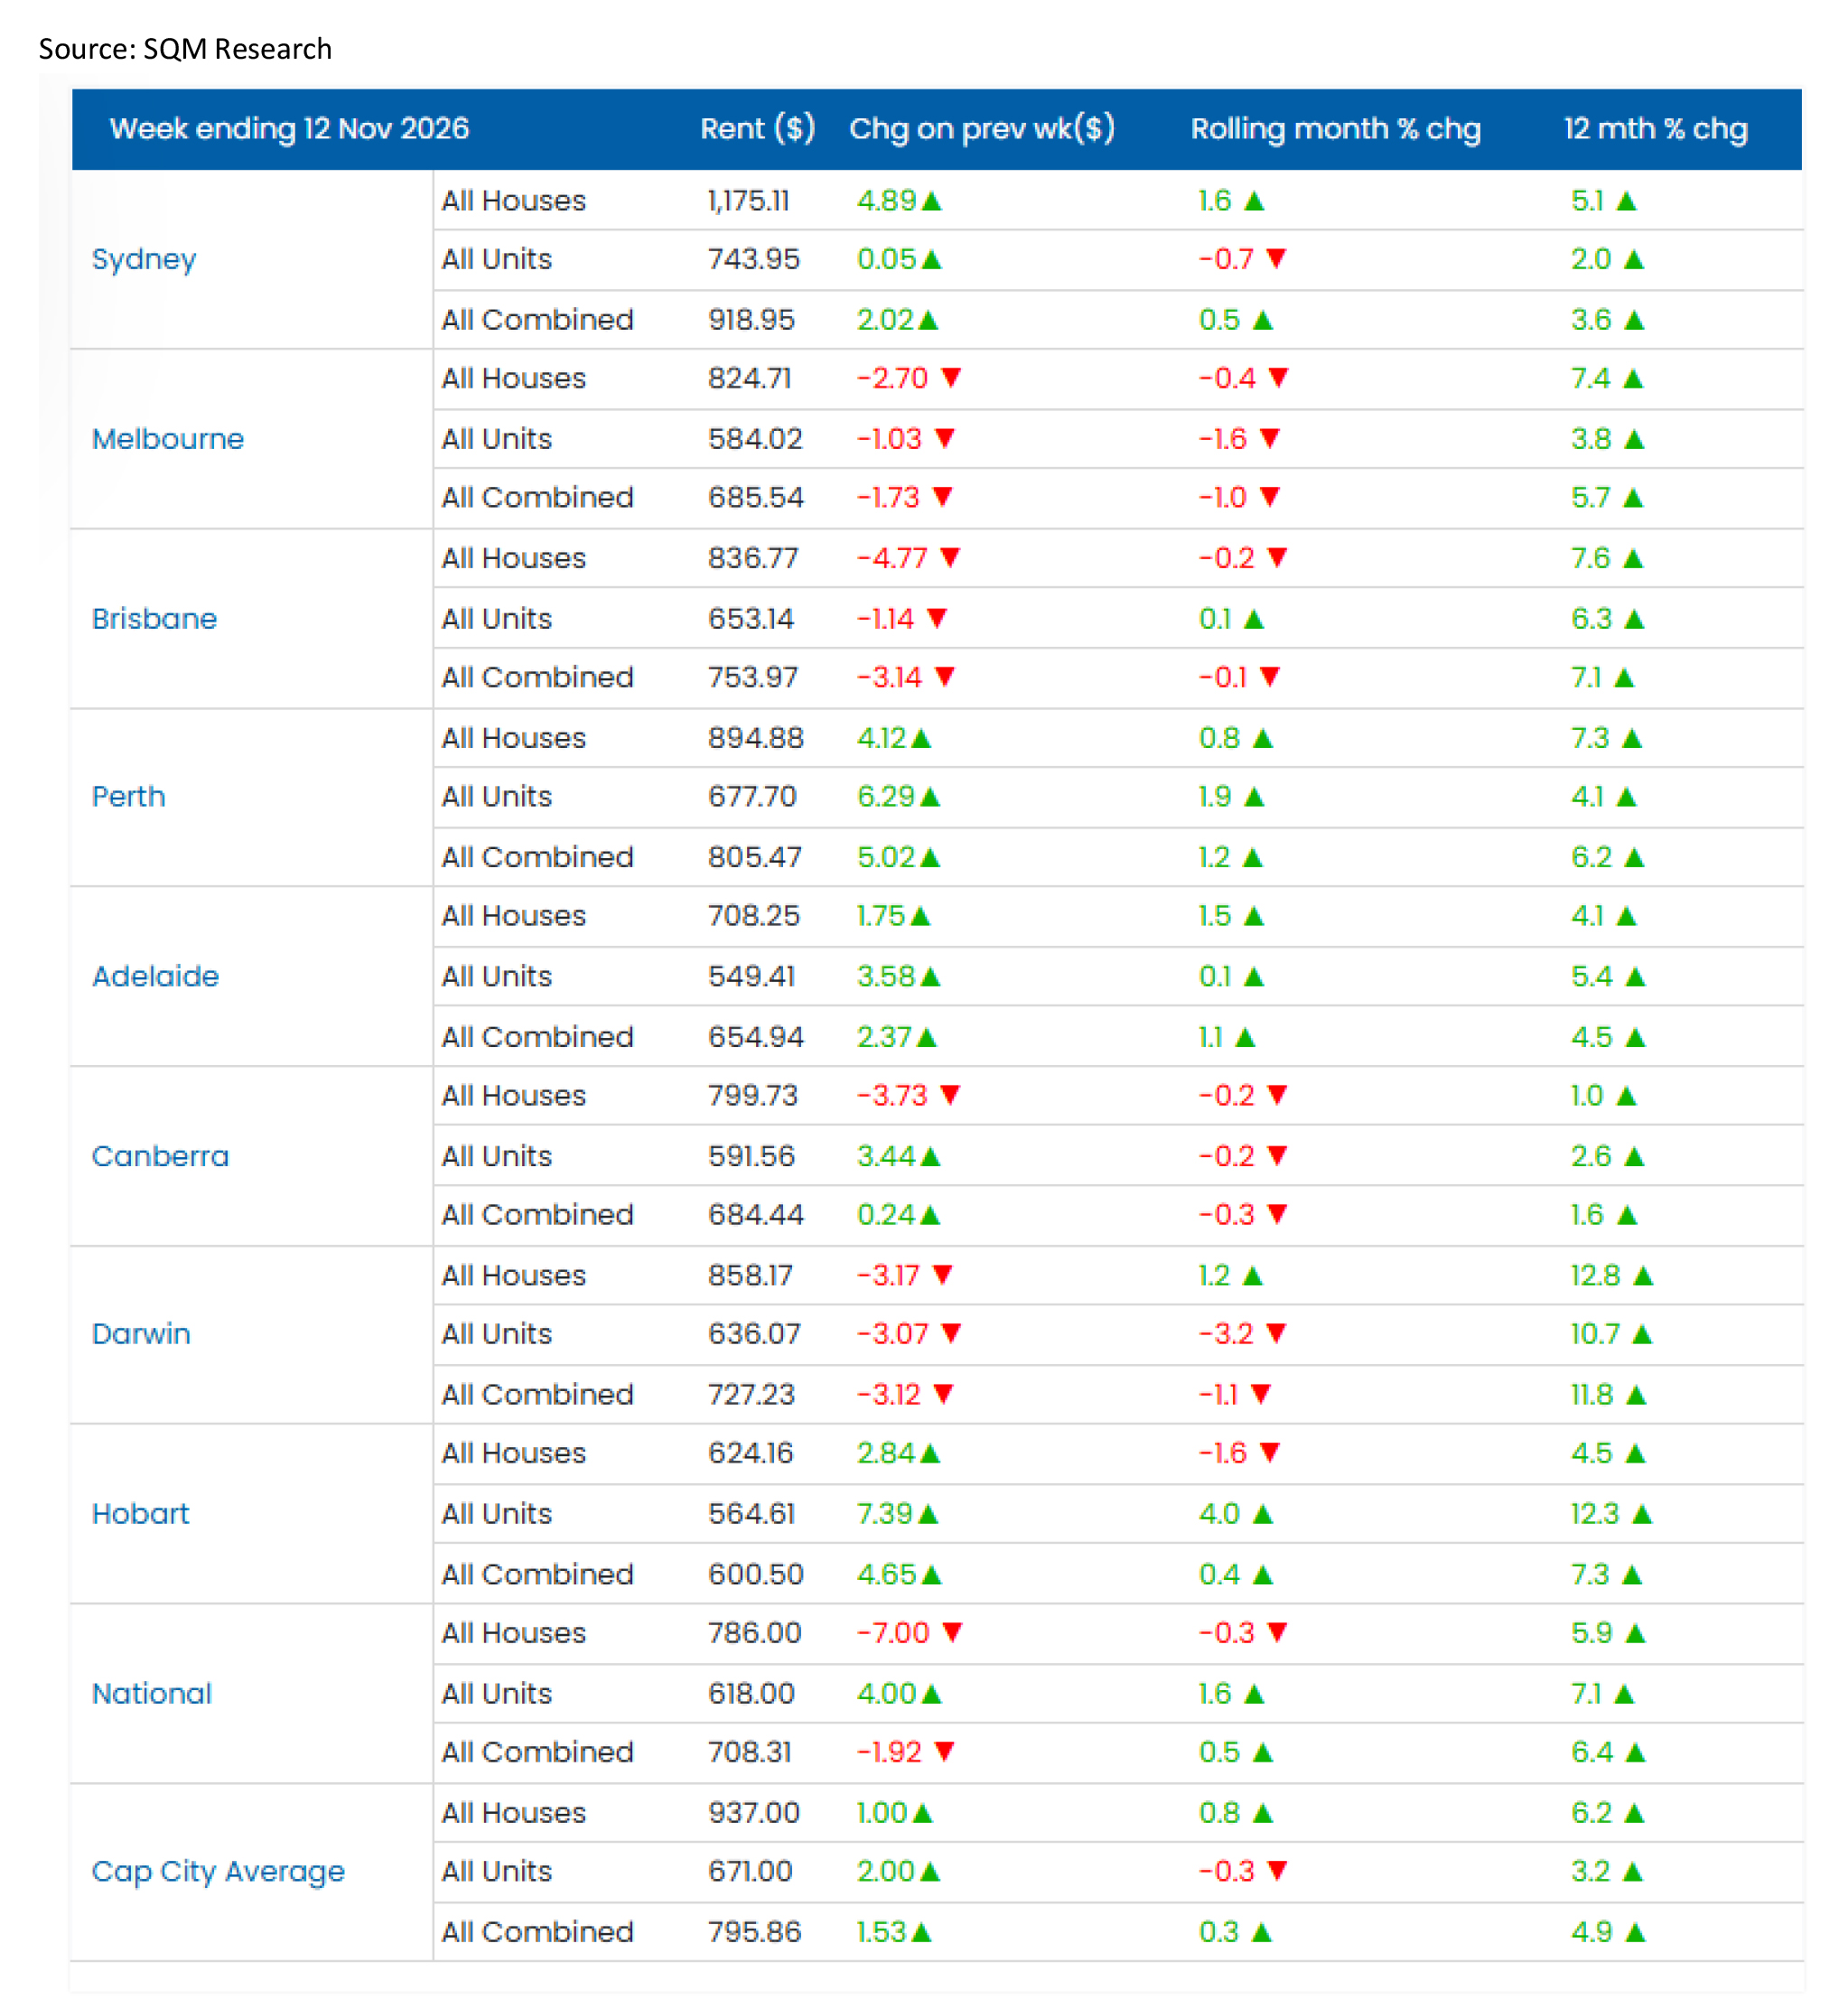
National combined advertised rents rose 0.5% over the 30 days to 12 November. In a reversal of last month, unit rents rose 1.6% while house rents eased 0.3%. Combined rents are 6.4% higher than a year ago, with house rents up 5.9% and unit rents up 7.1%. The capital city average combined rent rose 0.3% over the month and is 4.9% higher over the year.
The national combined advertised rent now stands at $708.31 per week, while the capital city average sits at $795.86 per week.
The national lift in unit rents was not reflected across the capitals, where the average unit rent eased 0.3% over the month while house rents rose 0.8%, suggesting the strength in units came largely from outside the capital cities. Annual rental growth has also moderated, with national combined rents up 6.4% compared with 7.6% a month earlier.
Sydney: Combined rents rose 0.5% over the month to $918.95 per week, again driven by house rents, up 1.6% to $1,175.11. Unit rents fell 0.7% to $743.95 and are just 2.0% higher over the year, the weakest annual unit growth of any capital. With vacancies continuing to build, the divergence between houses and units in Sydney has persisted for a second month.
Melbourne: Combined rents fell 1.0% to $685.54 per week and are 5.7% higher over the year. House (-0.4%) and unit (-1.6%) rents both declined for a second consecutive month, consistent with Melbourne now recording the highest vacancy rate of any capital at 2.0%.
Brisbane: Combined rents eased 0.1% to $753.97 per week and are 7.1% higher over the year, with house rents up 7.6% annually. While monthly movement has stalled, annual growth remains among the strongest of the capitals as the vacancy rate edged up to 1.0%.
Perth: Combined rents rose 1.2% to $805.47 per week and are 6.2% higher over the year. Unit rents lifted 1.9% over the month, with annual unit growth recovering to 4.1% from 1.9% a month earlier.
Adelaide: Combined rents rose 1.1% to $654.94 per week and are 4.5% higher over the year. House rents increased 1.5% over the month, while unit rents were broadly flat (+0.1%) but remain 5.4% higher annually.
Canberra: Combined rents eased 0.3% to $684.44 per week and are just 1.6% higher over the year, the weakest annual growth of any capital city. House and unit rents both slipped 0.2% over the month.
Darwin: Combined rents fell 1.1% to $727.23 per week but remain 11.8% higher over the year, still the strongest annual growth of any capital. Unit rents fell 3.2% over the month, a reminder that Darwin’s small rental stock makes monthly moves volatile.
Hobart: Combined rents rose 0.4% to $600.50 per week and are 7.3% higher over the year. Unit rents rebounded 4.0% over the month and are 12.3% higher annually, the strongest unit rent growth of any capital, while house rents fell 1.6%.
Louis Christopher, Managing Director of SQM Research, commented: October’s numbers show rental availability continuing to improve, with the national vacancy rate rising to 1.5 per cent and seven of the eight capital cities recording a monthly increase in vacant stock. Because our vacancy measure only counts properties advertised for three weeks or more, this tells us rental properties are taking longer to lease.
The annual comparison is particularly noteworthy. Sydney is carrying around 45 per cent more vacant rental stock than a year ago, and Canberra is up around 36 per cent. Tenants in these markets have considerably more choice than they did this time last year.
Melbourne deserves particular attention. Its vacancy rate has reached 2.0 per cent, the highest of any capital city, yet both house and unit rents have fallen for a second consecutive month. Rents would normally lift during spring. When vacancies are rising and rents are falling at the same time, this is not simply more properties coming onto the market. It points to softer tenant demand.
The smaller capitals are a different story. Adelaide has around 21 per cent fewer vacant properties than a year ago, and vacancy rates in Perth, Adelaide, Darwin and Hobart all remain below one per cent. Tenants in those cities are yet to see any meaningful relief.
What we are watching most closely is the slowdown in rental growth. National combined rents are now 6.4 per cent higher than a year ago, down from 7.6 per cent last month, and Sydney unit rents are up just 2.0 per cent annually. These are still solid increases, but annual growth is clearly moderating, led by the unit market in our two largest cities.
With more stock available and rents softening in Sydney and Melbourne, the summer leasing season will provide an important test of landlord expectations and tenant demand.


