
Mano Mohankumar and Ian Fryer
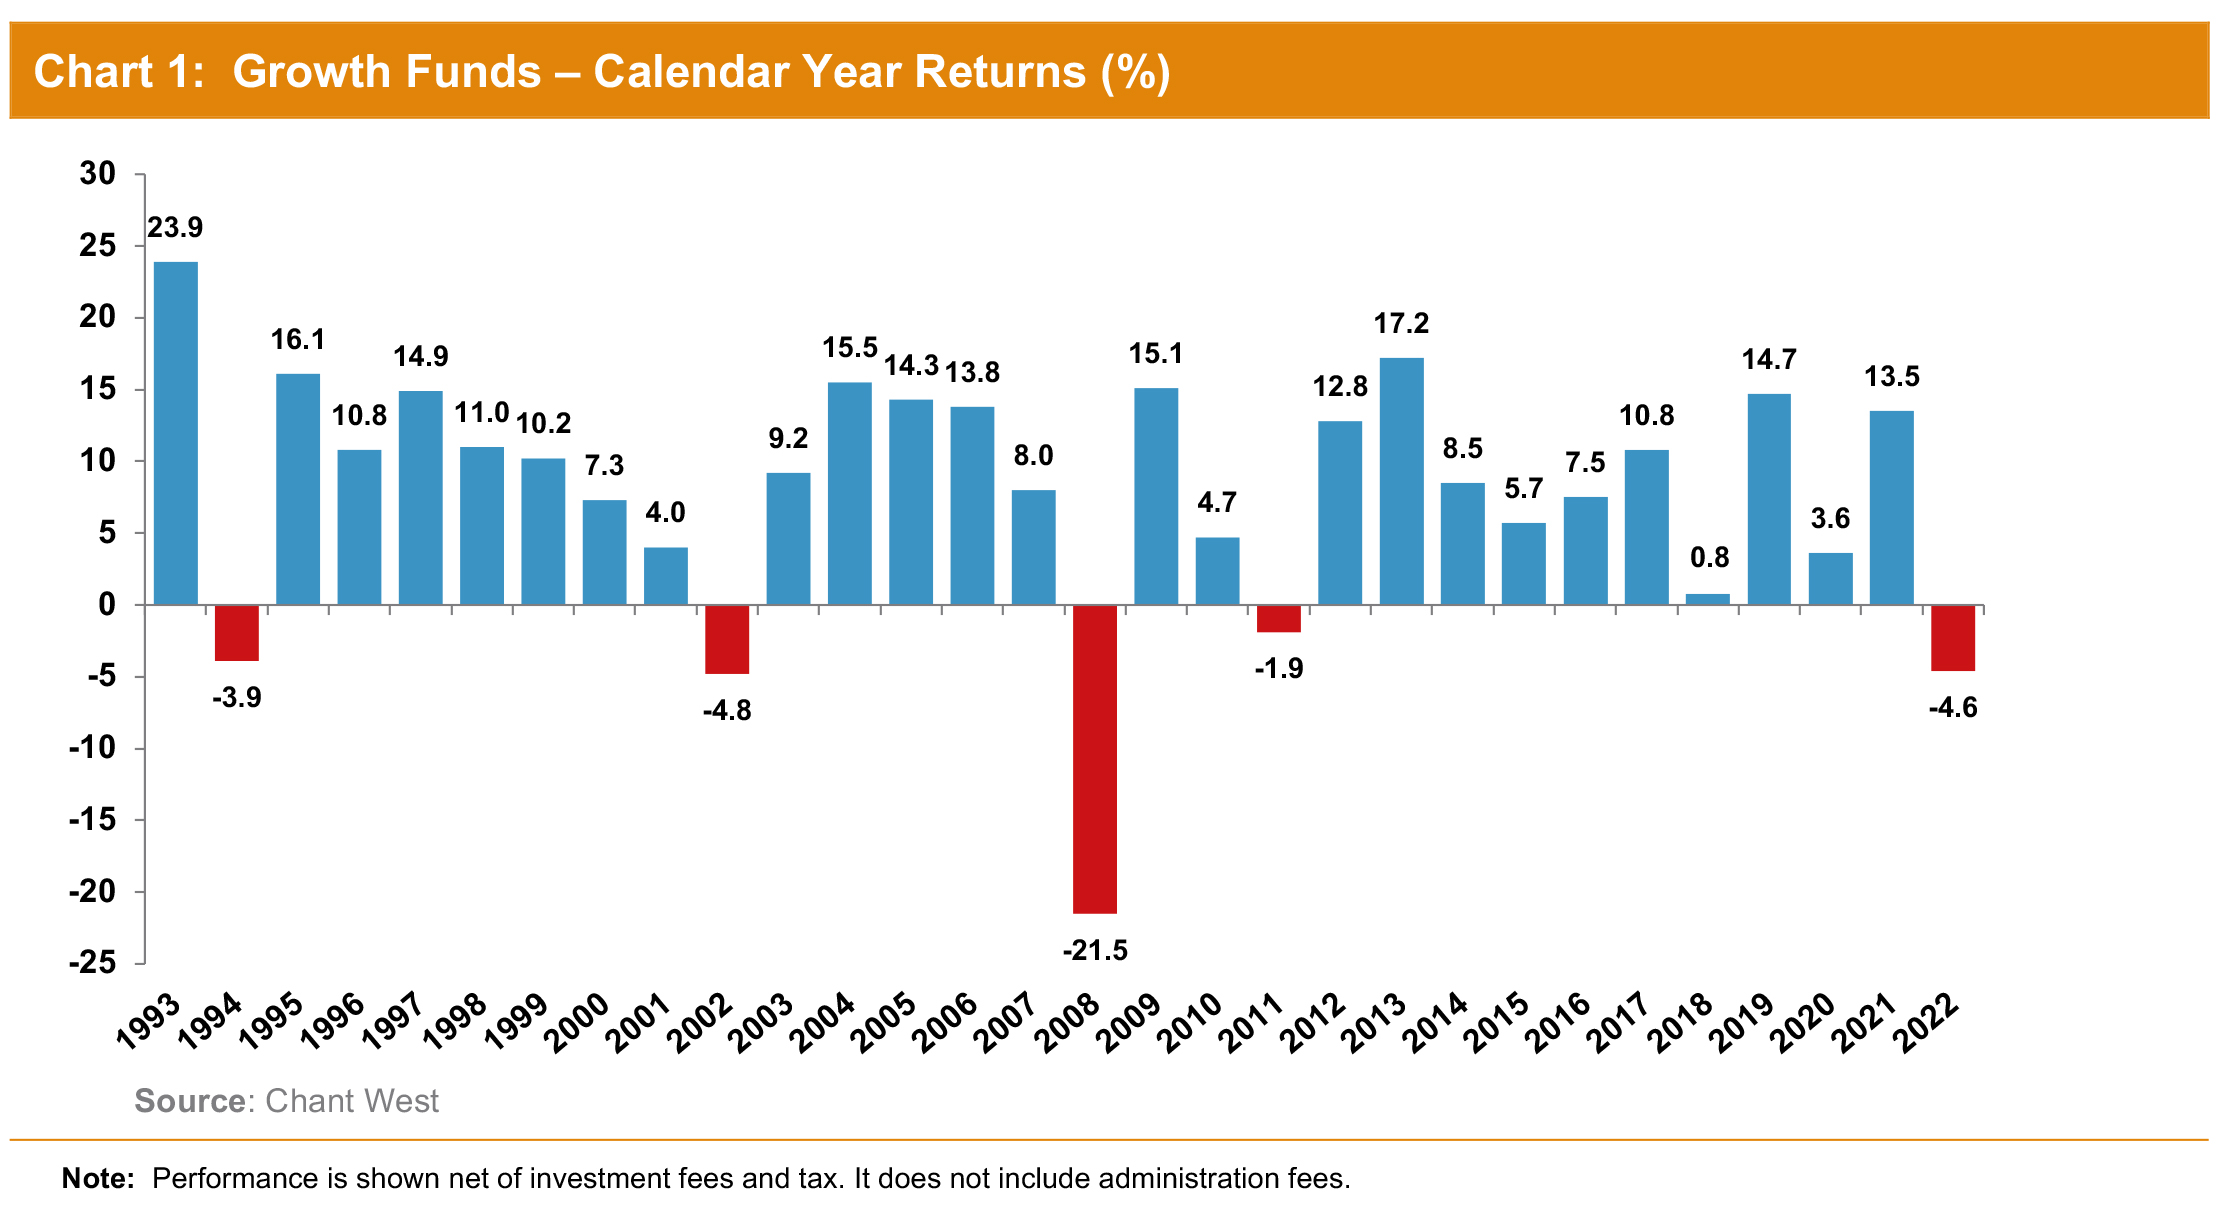
Super funds fought an uphill battle over the course of 2022, faced with heavy falls in most of the traditional investment markets – shares, listed property and bonds. Yet in these very testing circumstances they again managed to prove their resilience, with the median growth option (61 to 80% in growth assets) retreating just 4.6% over the year. While fund members might have read the headlines and feared the worst, the end result was only a modest setback after a decade-long sequence of positive calendar year returns.
Chant West Senior Investment Research Manager, Mano Mohankumar says that while no-one likes to see their super balance go backwards, it’s important for fund members to see things in perspective and view their super as a long-term investment. “This was the first negative calendar year since 2011 and only the fifth in the full 30 years of compulsory super. It also comes on the back of a particularly strong 2021, so perhaps we were due for a return to earth given the challenging investment backdrop. Most importantly, members should take comfort in the fact that funds are continuing to meet their long-term return objectives – and they’re doing so by a comfortable margin.
“Calendar 2022 was highly unusual in that all traditional listed asset sectors finished in the red except cash, and even that only delivered 1.3%. International shares were down 16.4% in hedged terms, led down by the US market which lost about 18%. In contrast, Australian shares held up relatively well, dropping back by only 1.8%. Australian and global REITs suffered the biggest falls, losing 20% and 24.1% respectively. What made the year even more challenging was that bonds didn’t play their usual cushioning role. It’s highly unusual for both shares and bonds to fall over a full year but that’s what happened in 2022, with Australian bonds and international bonds tumbling 9.7% and 12.3%, respectively.
“Despite all this, the median growth fund was down less than 5% – not a bad result at all. That’s mainly because most major funds now invest far beyond the traditional asset sectors, with meaningful allocations to private equity, unlisted property and unlisted infrastructure which all delivered positive returns over the year. Having a higher proportion of your shares exposure invested domestically would have also helped given the performance differential between Australian and international shares. Another lever that paid off was maintaining a shorter duration bond exposure which is less sensitive to rises in yields.”
Chart 1 plots the year-by-year performance of the median growth fund over the 30 full calendar years since the introduction of compulsory super. It shows that these funds have done better than their typical long-term risk objective, which is one negative return on average in every five years, which translates to six negative years over the 30 years. The chart shows that there have been only five. In addition, funds have achieved their typical long-term return objective to beat inflation by 3.5% p.a., which translates to 6.1% p.a. Since the introduction of compulsory super, growth funds have returned 7.8% p.a. on average. That’s 1.7% a year ahead of the objective, which is a great achievement over such an extended timeframe.
Other key points
- Diversified fund performance by risk category
- Long-term performance including rolling 10-year returns chart
- Top 10 performing growth funds over the 2022 calendar year
- Top 10 performing growth funds over 10 years
- Retail lifecycle product performance
Mohankumar says that when investment markets fall sharply, there’s a tendency for some people to panic and think about moving money into less risky investment options, or to cash, with a view to switching back later. “We caution members about the perils of attempting to time the market. Far more often than not, it results in a worse outcome in the long run than if you stay the course. Panicking only converts paper losses into real ones. Not only that, you risk missing out when markets rebound – as they will at some point. Even members close to retirement can generally afford to take a long-term view. That’s because a lot of people won’t take out all their super when they retire. A substantial amount is likely to stay in the super system in the pension phase, often for many years, which provides plenty of time for losses to be recovered.
“We encourage everyone – younger and older – to remember that superannuation is indeed a long-term investment. Most members can afford to remain patient and, if you’re thinking about withdrawing money or switching to a less risky option, we strongly encourage you to seek financial advice before doing so.”
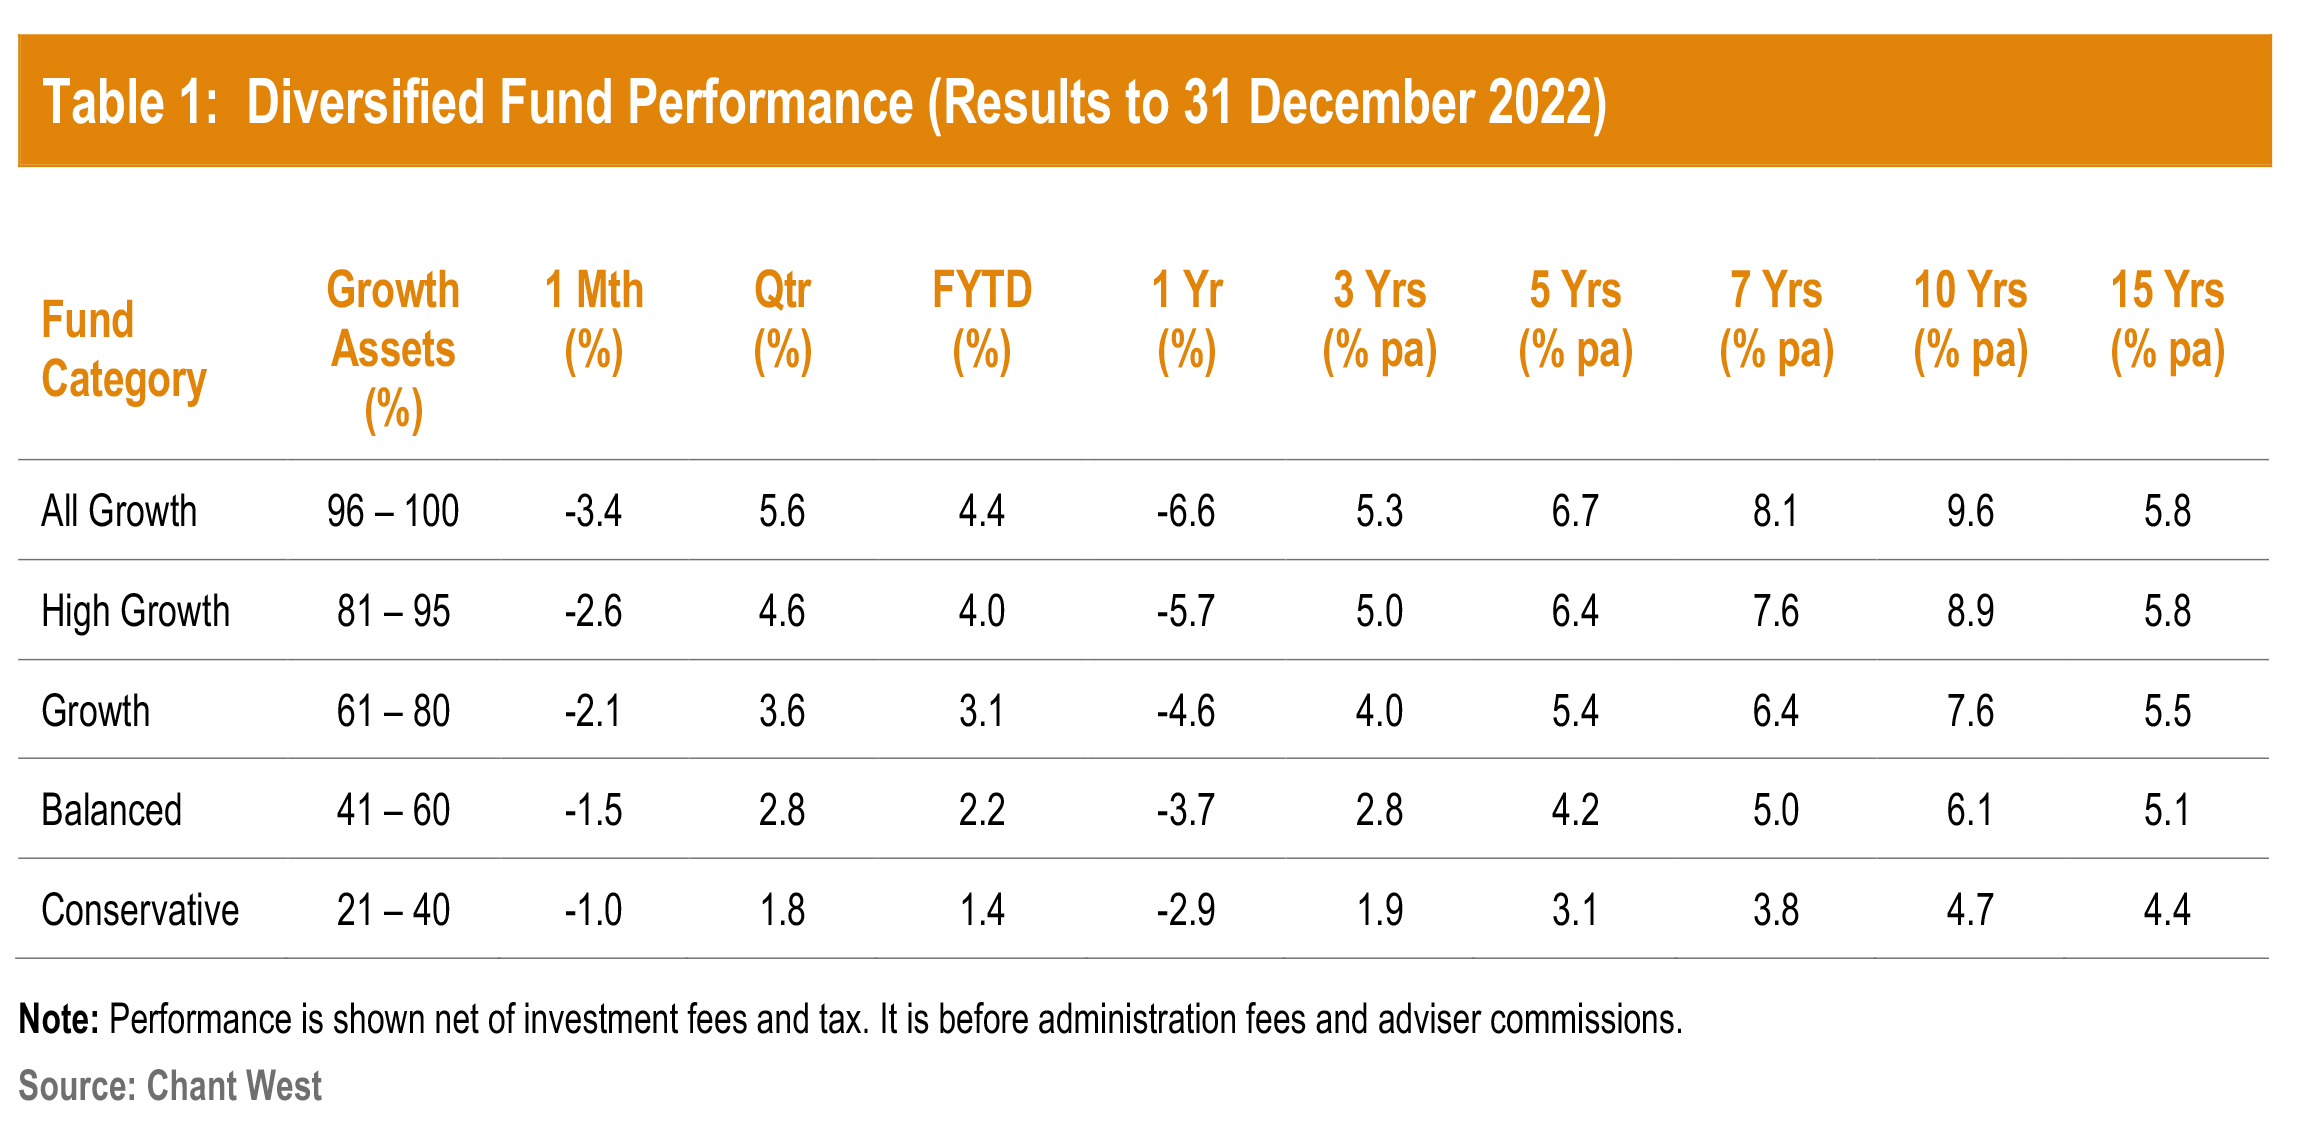
Table 1 compares the median performance for each of the traditional diversified risk categories in Chant West’s Multi-Manager Survey, ranging from All Growth to Conservative. All risk categories have generally met their typical long-term return objectives, which range from CPI + 1.75% for Conservative funds to CPI + 4.25% for All Growth.
Funds still delivering on long-term targets
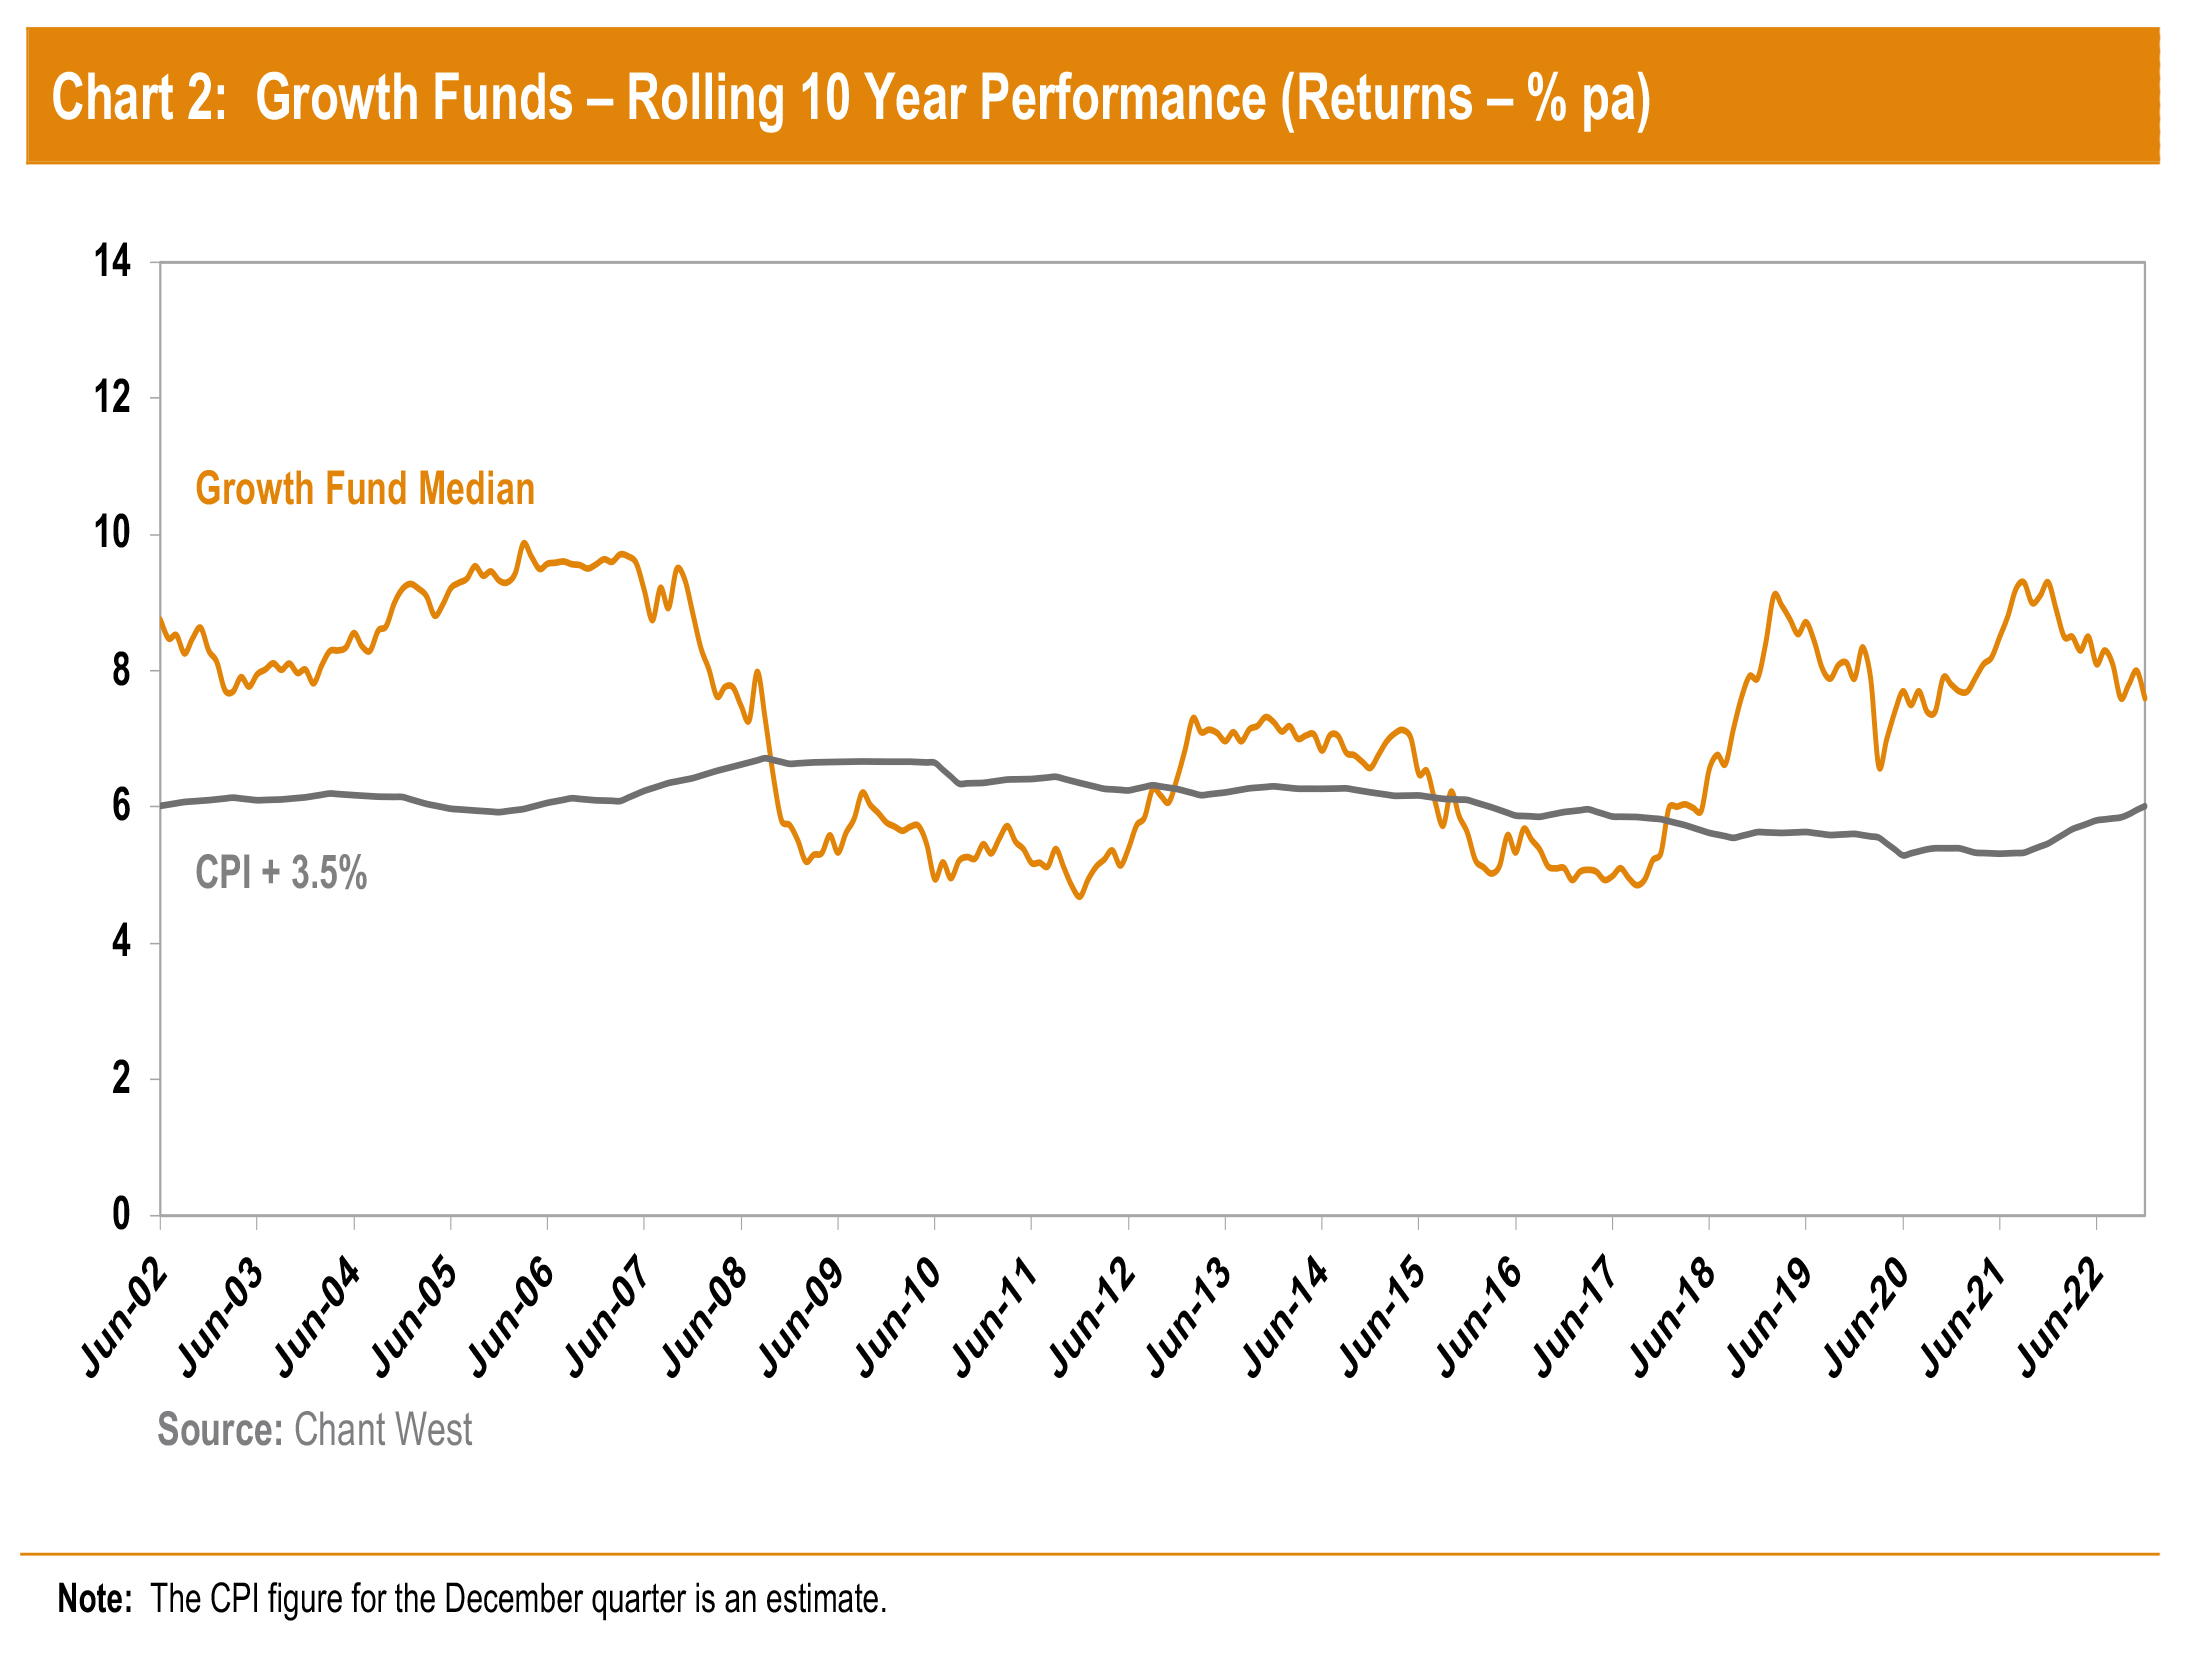
As mentioned earlier, over the 30½ years since the introduction of compulsory super in July 1992, the median growth fund has delivered an annualised return of 7.8%, which is 1.7% p.a. ahead of the typical return objective of CPI +3.5% p.a.. Even looking at the past 20 years, which includes four major share market downturns – the ‘tech wreck’ in 2002-2003, the GFC in 2007-2009, COVID-19 in 2020, and the downturn in 2022 driven by high inflation and rising interest rates to combat it – super funds have returned 7.2% p.a., which is still comfortably ahead of the objective.
Chart 2 shows that, for the majority of the time, the median growth fund has exceeded its return objective over rolling 10-year periods, which is a commonly used timeframe consistent with the long-term focus of super. The exceptions are two periods between mid-2008 and late-2017, when it fell behind. This is because of the devastating impact of the 16-month GFC period (end-October 2007 to end-February 2009) during which growth funds lost about 26% on average.
Top 10 performers over one and ten years
Chart 3 shows the top 10 performing growth options over the 2022 calendar year, together with the survey median.
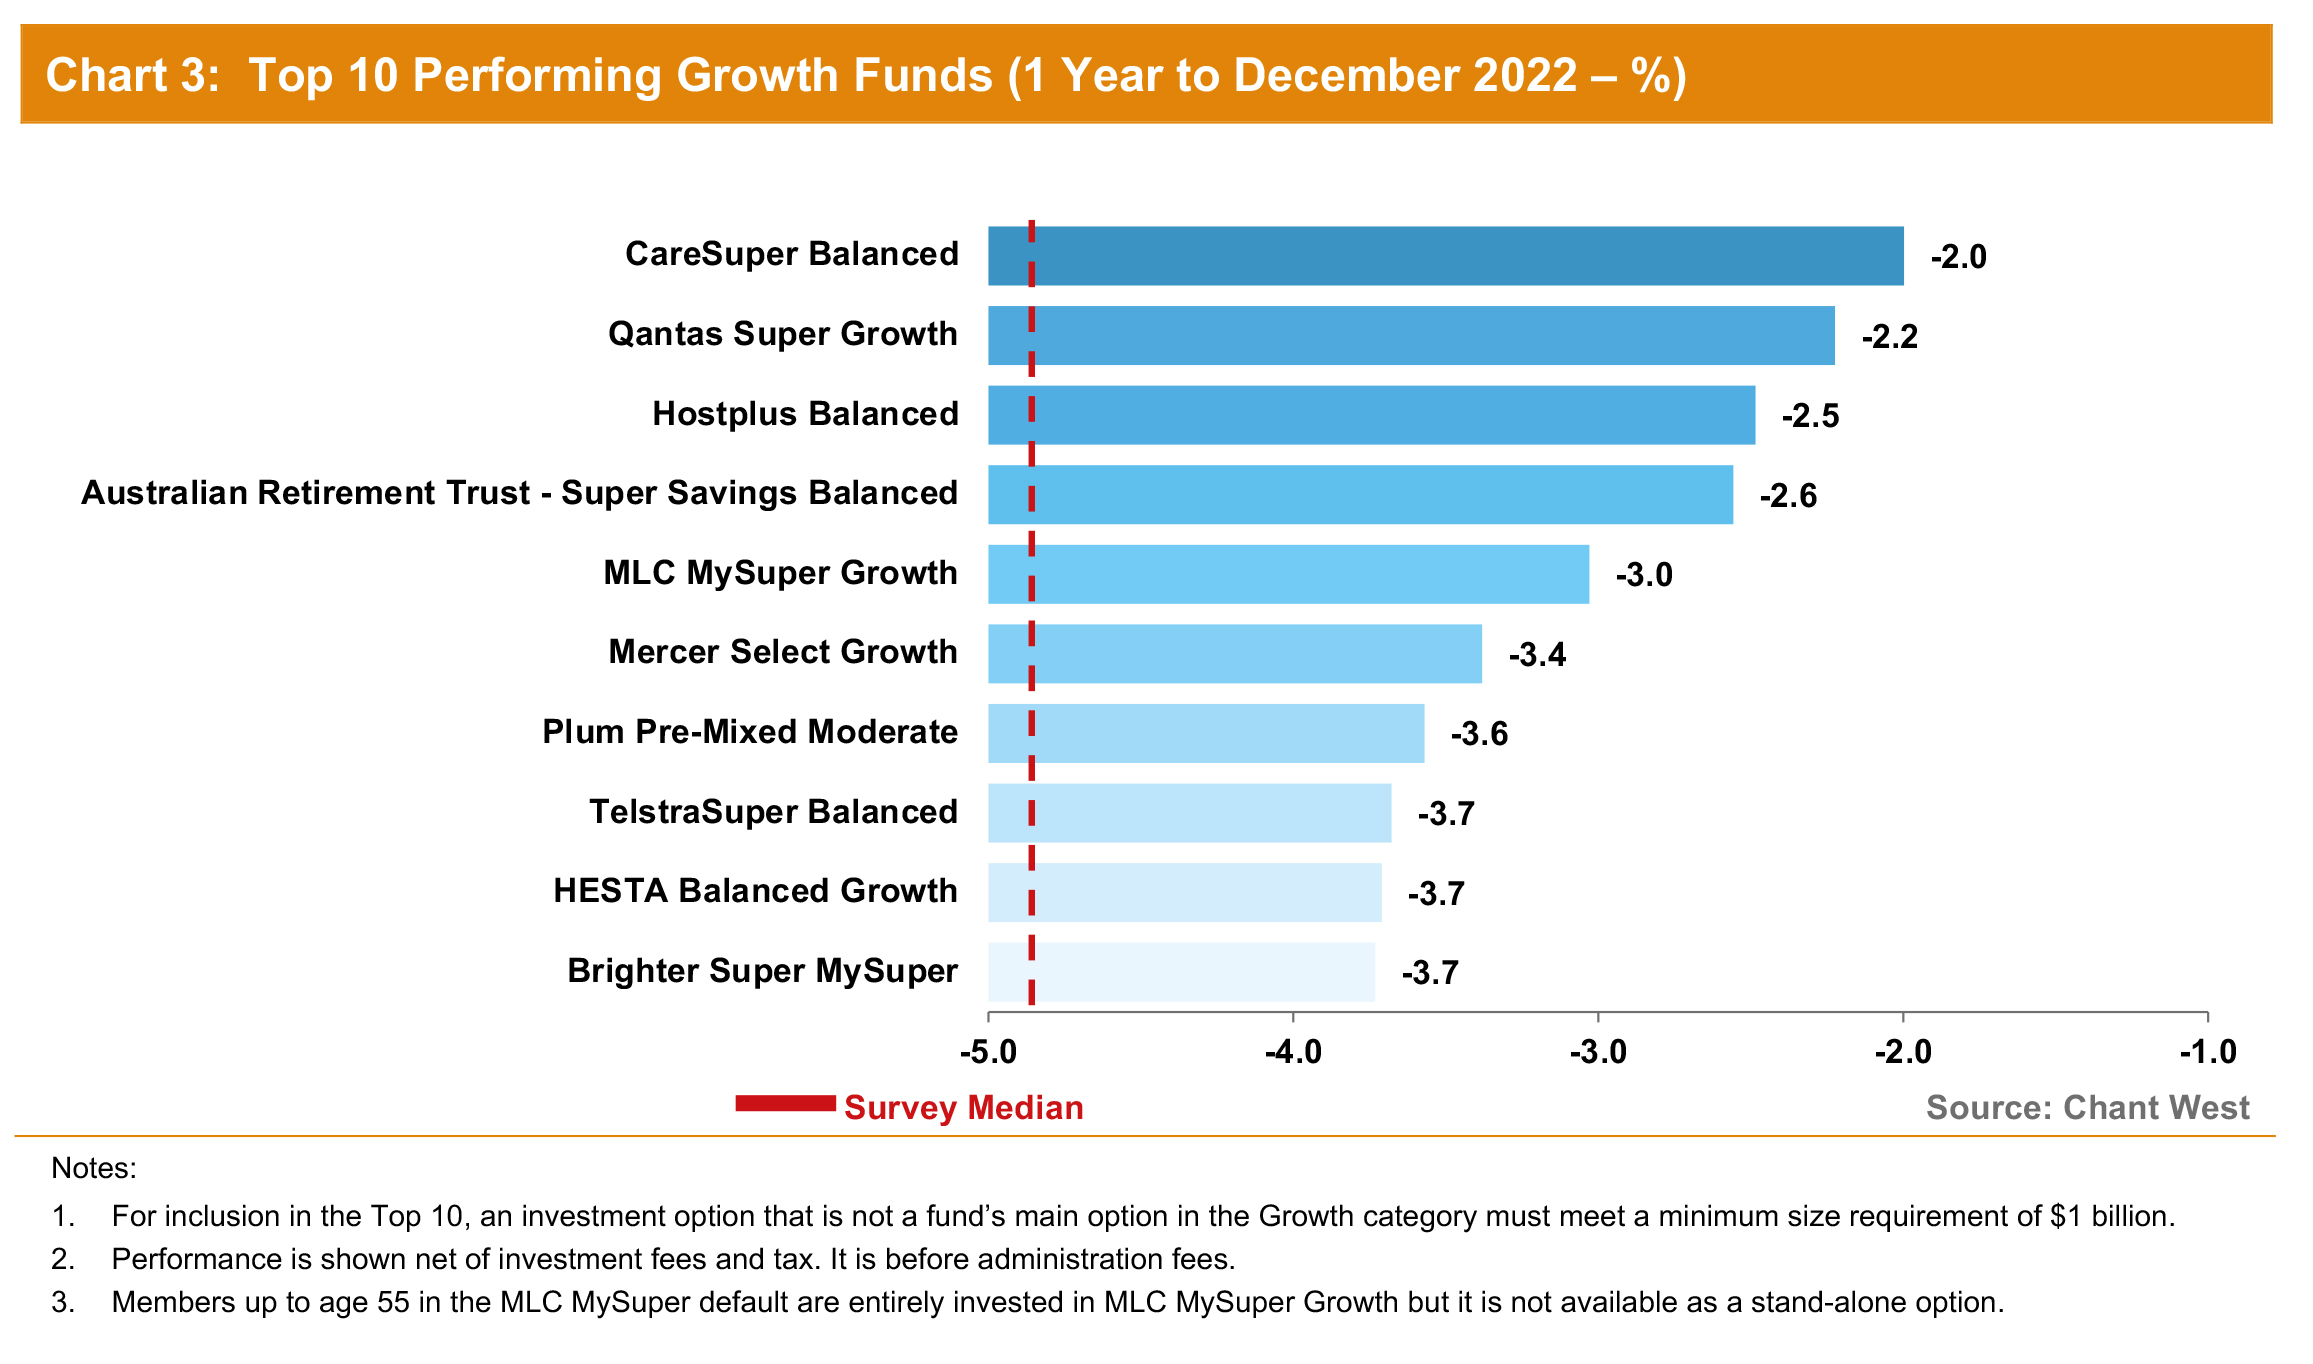
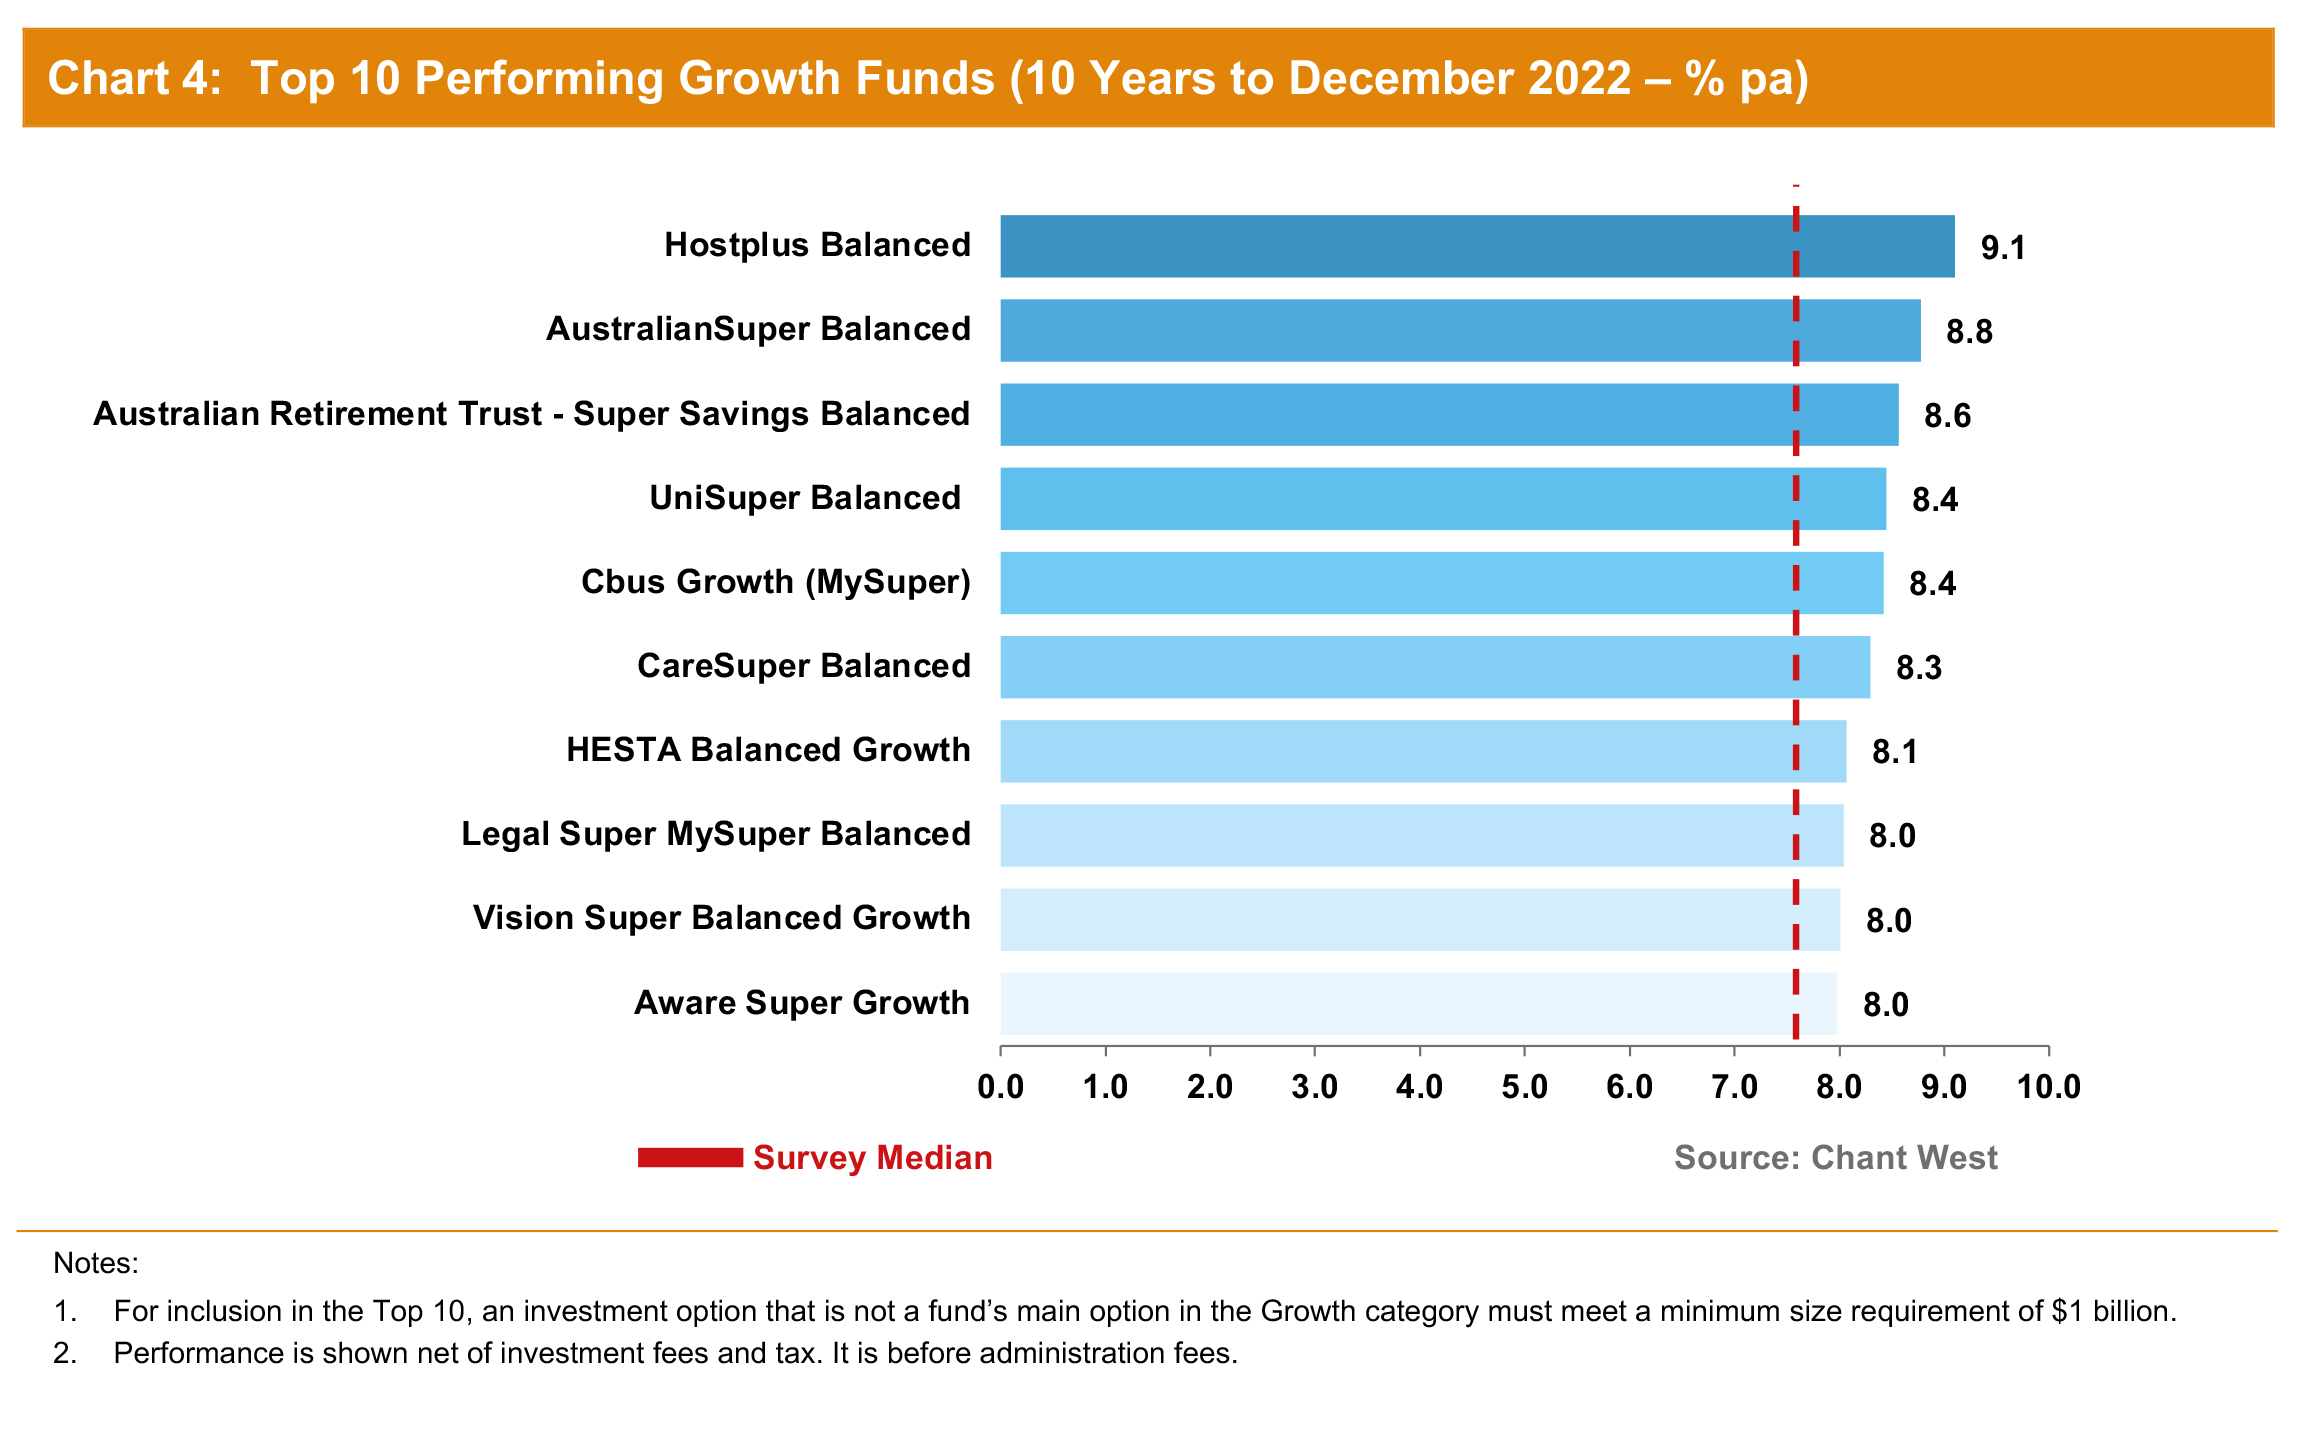
Chart 4 shows the top 10 performing growth options over 10 years to December 2022, together with the survey median.
Lifecycle products behaving as expected
Mohankumar says that while the Growth category is still where most people have their super invested, a meaningful number are now in so-called ‘lifecycle’ products. “Most retail funds have adopted a lifecycle design for their MySuper defaults where members are allocated to an age-based option that’s progressively de-risked as that cohort gets older.
“It’s difficult to make direct comparisons of the performance of these age-based options with the traditional options that are based on a single risk category, and for that reason we report them separately. Table 2 shows the median performance for each of the retail age cohorts, together with their current median allocation to growth assets. For comparison purposes it also includes a row for traditional MySuper Growth options – nearly all of which are not-for-profit funds. Care should be taken when comparing the performance of the retail lifecycle cohorts with the median MySuper Growth option, however, as they’re managed differently so their level of risk varies over time.”
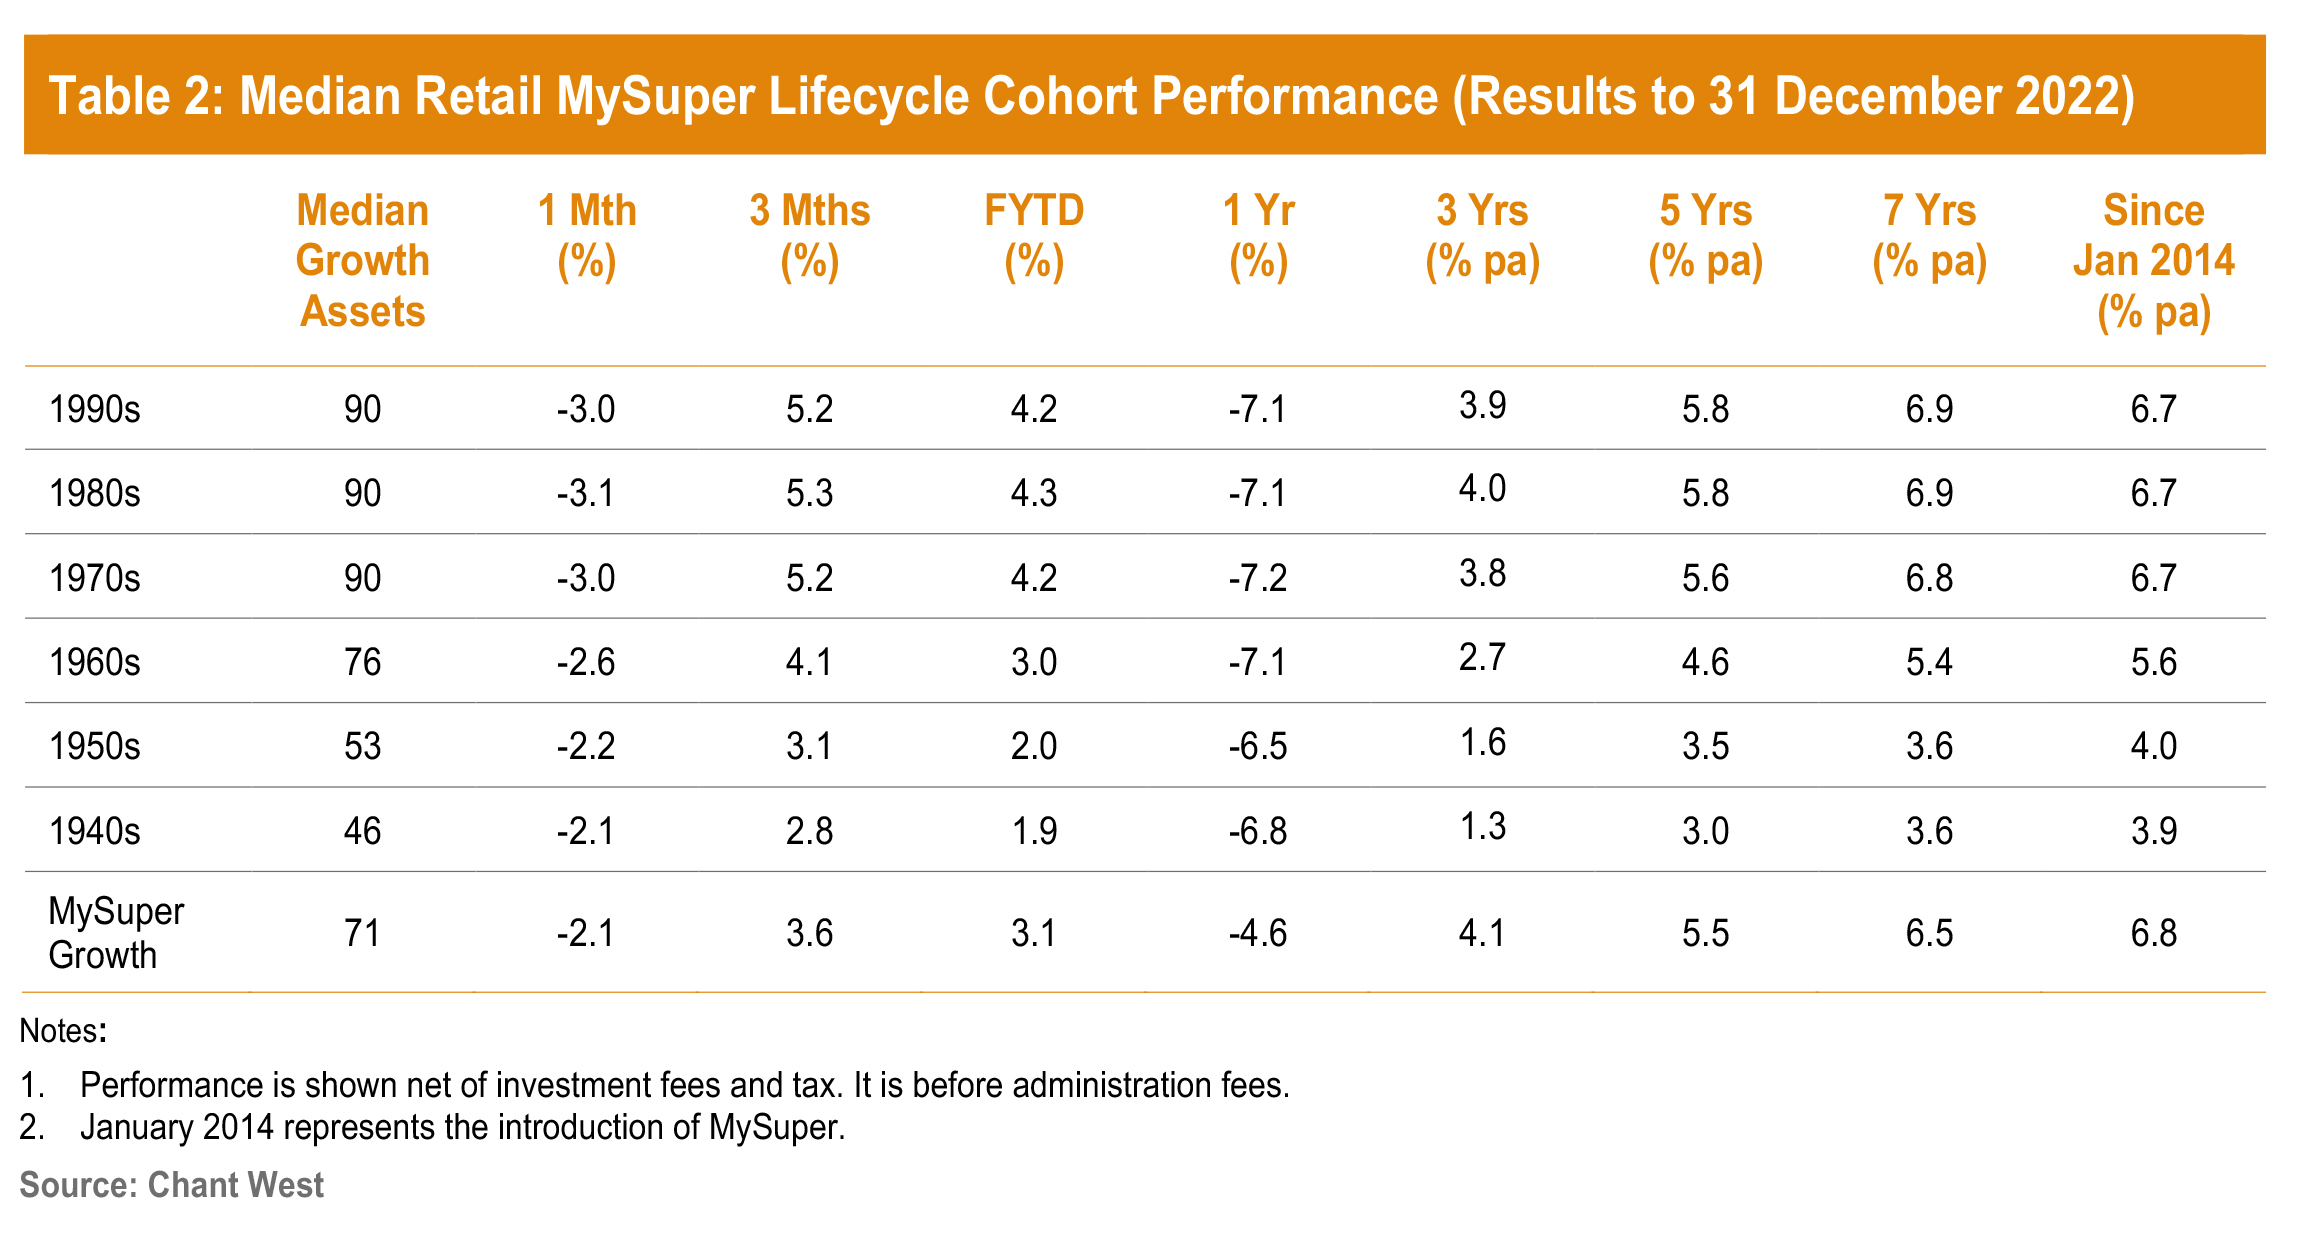
Options that have higher allocations to growth assets have done better over most periods shown. Despite significant underperformance relative to the MySuper Growth median in calendar 2022, younger members of retail lifecycle products – those born in the 1970s, 1980s and 1990s – have generally held their own over three years and longer. However, it’s important to note that they take on significantly more share market risk. On average, these younger cohorts have at least 20% more invested in listed shares and listed real assets than the typical MySuper Growth option.
The 1960s cohort has generally underperformed the median MySuper Growth option. This is partly due to a lower allocation to growth assets up until recently, when lifecycle product providers revised their glide paths to delay the de-risking process until older ages. Another reason for this underperformance is a lower allocation to unlisted assets, which have performed well, and a higher allocation to traditional defensive asset sectors, such as bonds and cash, which have been the weakest performing sectors since the introduction of MySuper.
The oldest cohorts (those born in the 1950s or earlier) are relatively less exposed to growth assets so you would expect them to underperform the MySuper Growth median over longer periods. Capital preservation is more important at those ages, so while they miss out on the full benefit in rising markets, older members in retail lifecycle options are generally better protected in the event of market weakness. However, even these older cohorts underperformed the MySuper Growth median over the 2022 calendar year due to their higher allocation to traditional bonds and lower allocation to unlisted assets.
By Mano Mohankumar, Senior Investment Research Manager and Ian Fryer, General Manager


