
National property listings ease in June while annual supply continues to strengthen
Key points
- Asking prices stalled nationally, but five of the eight capital cities — including Sydney, Melbourne, Brisbane, Perth and Adelaide — recorded monthly declines.
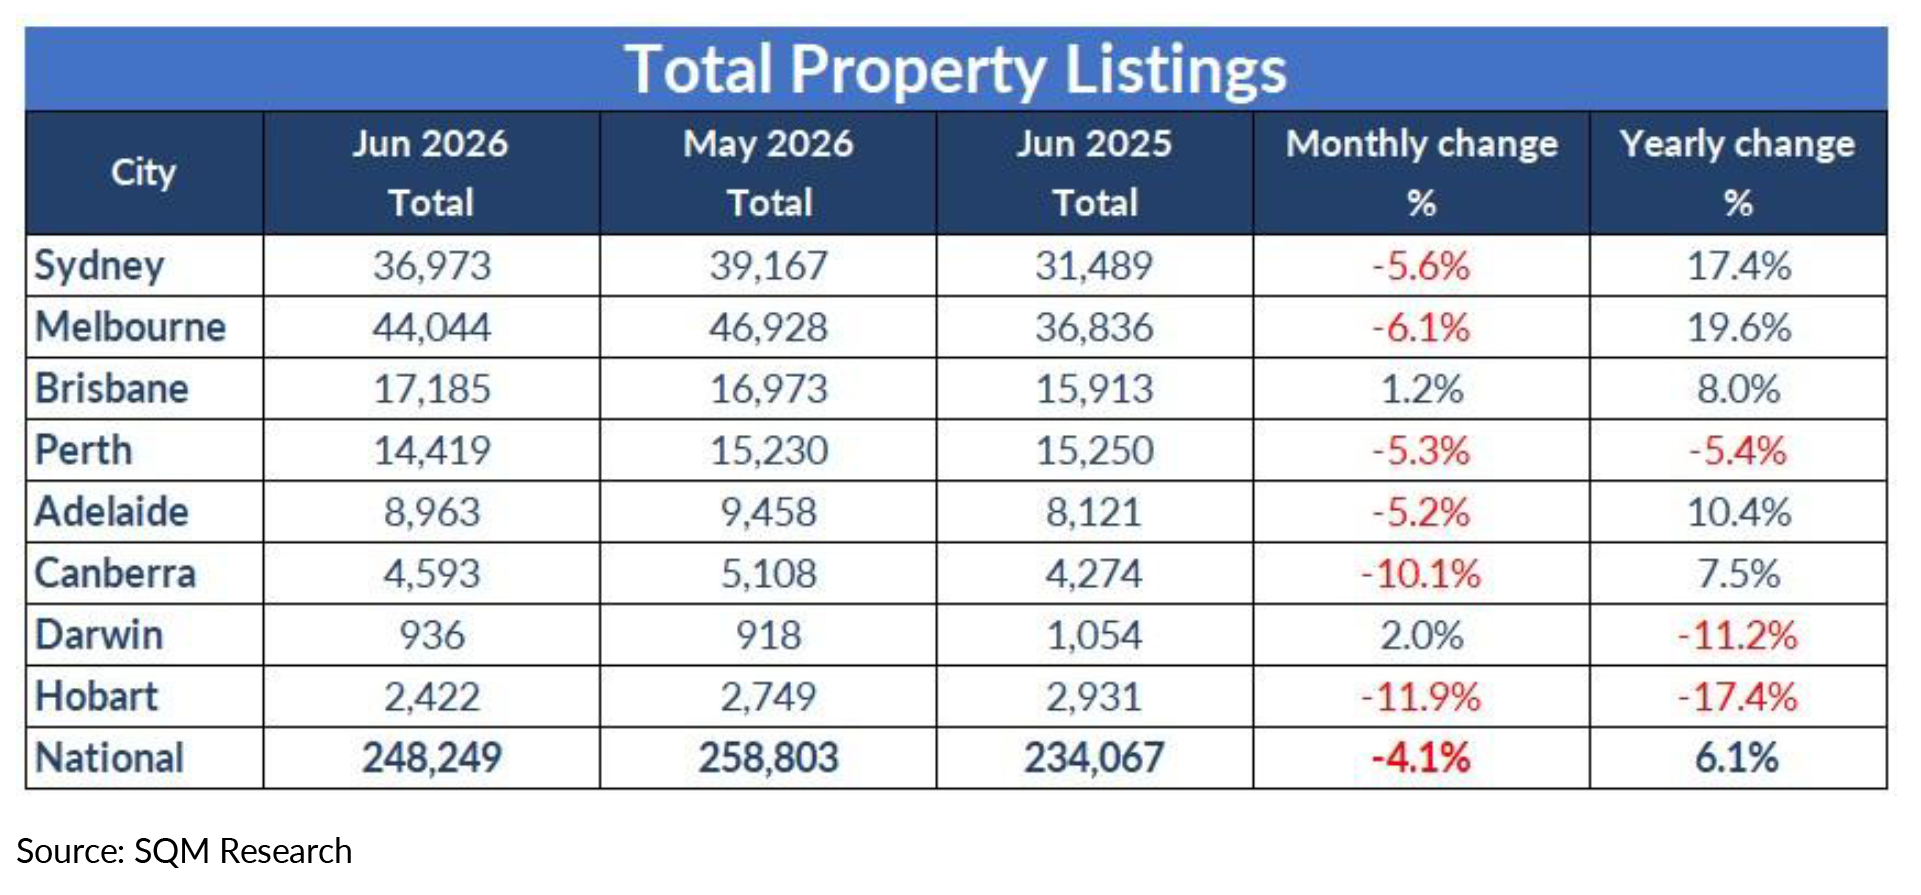
- National property listings declined 4.1% month-on-month in June to 248,249 dwellings, reflecting the typical seasonal slowdown at the start of winter.
- Despite the monthly decline, total listings remain 6.1% higher than June 2025.
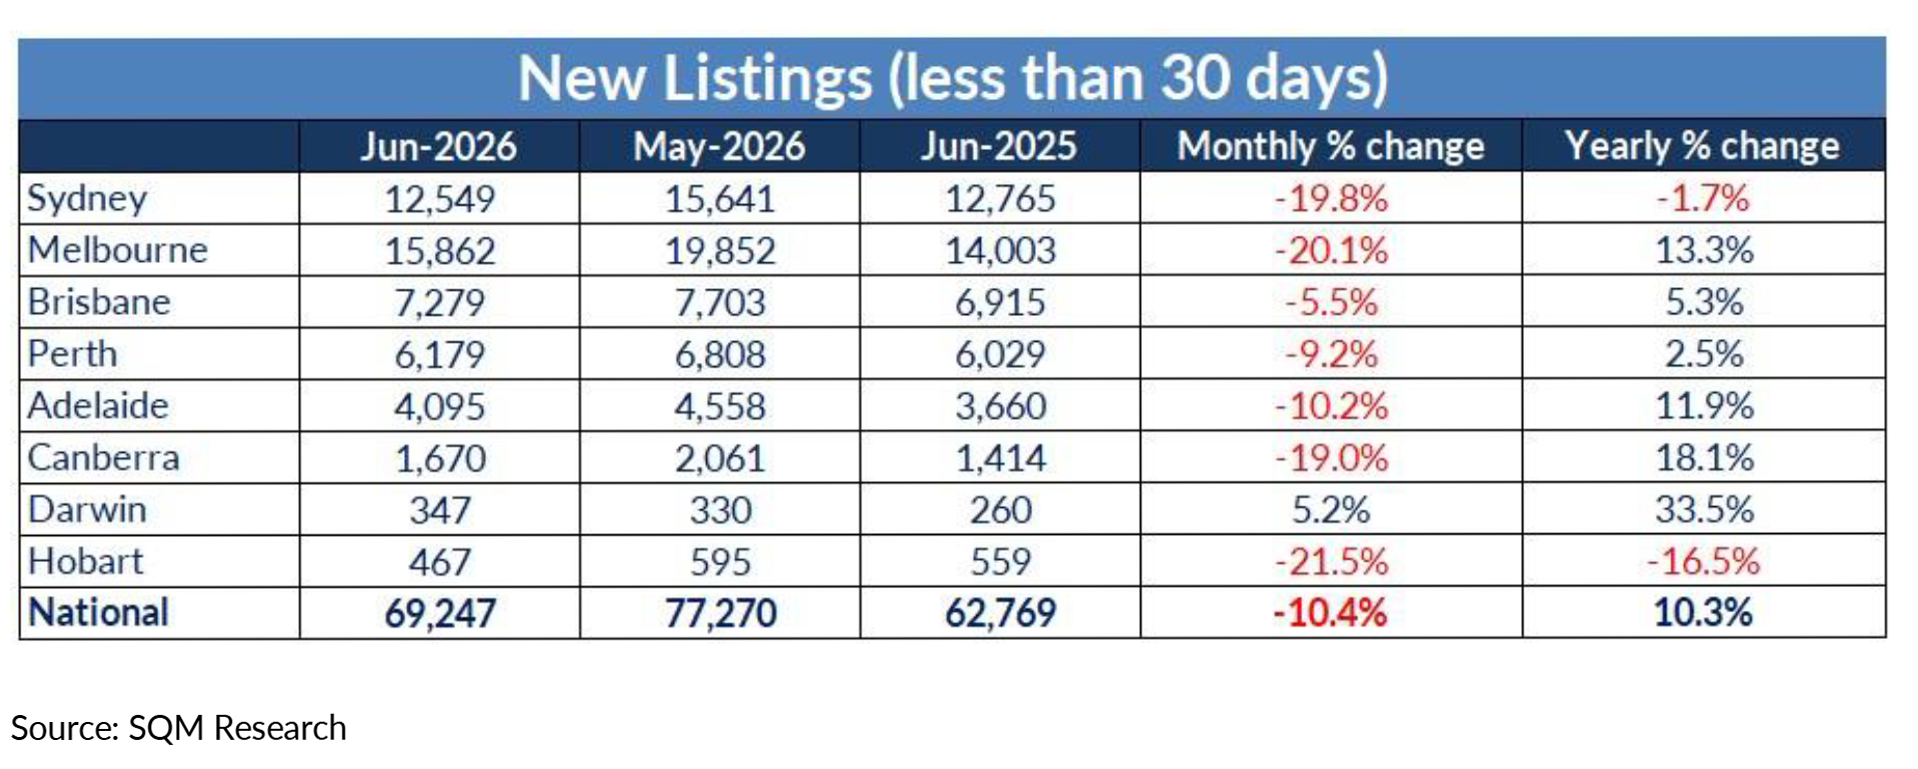
- New listings fell 10.4% nationally, though remain 10.3% higher year-on-year.
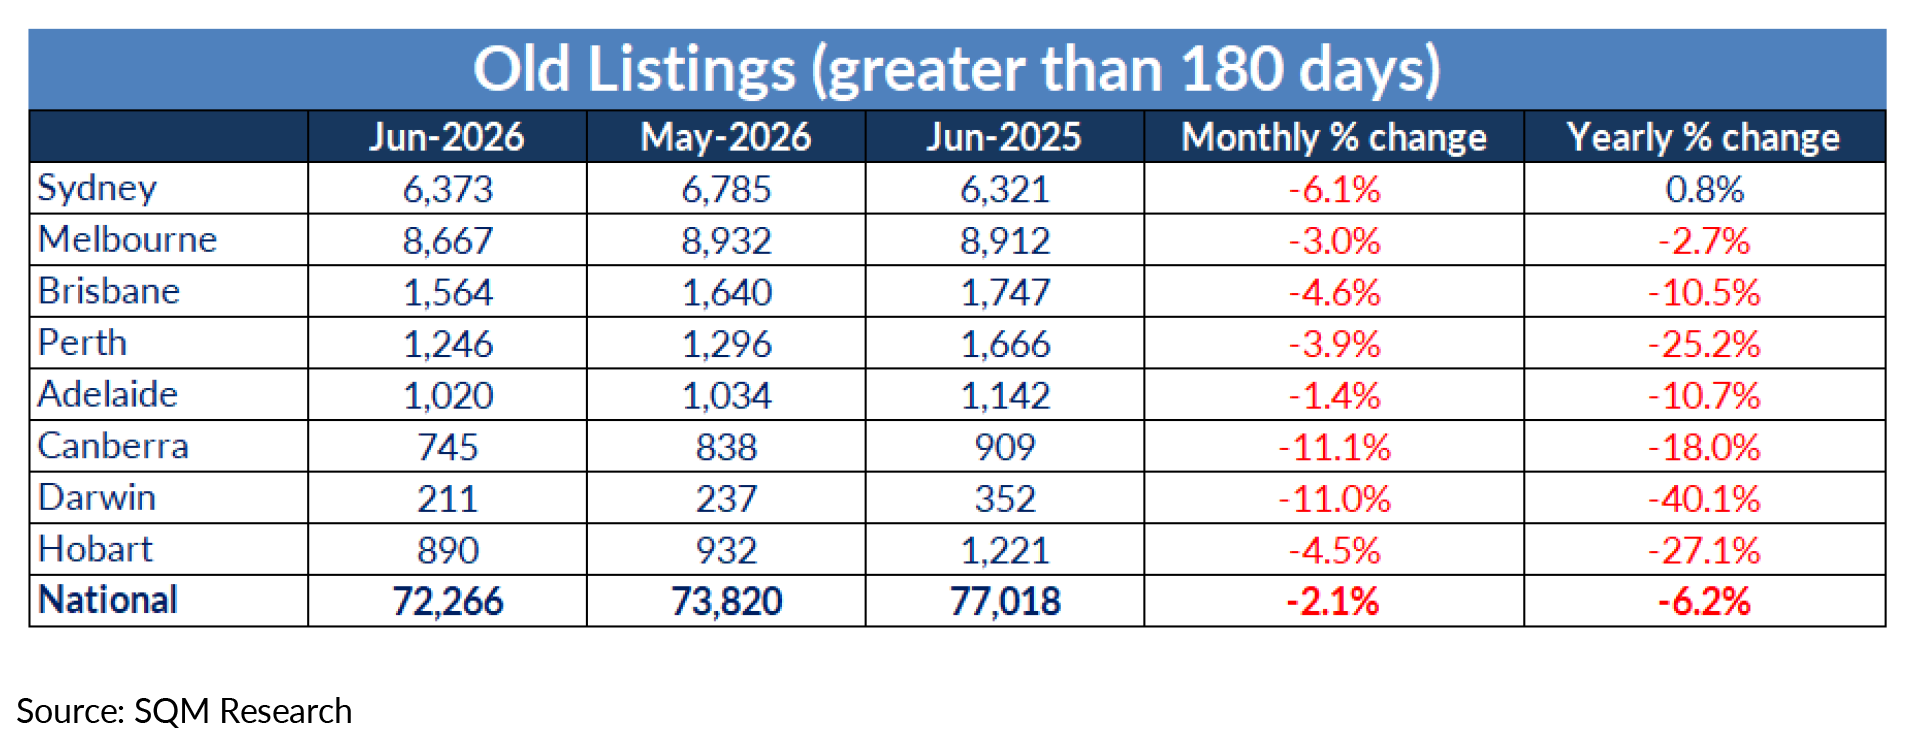
- Old listings declined 2.1%, indicating fewer long-standing properties on the market.
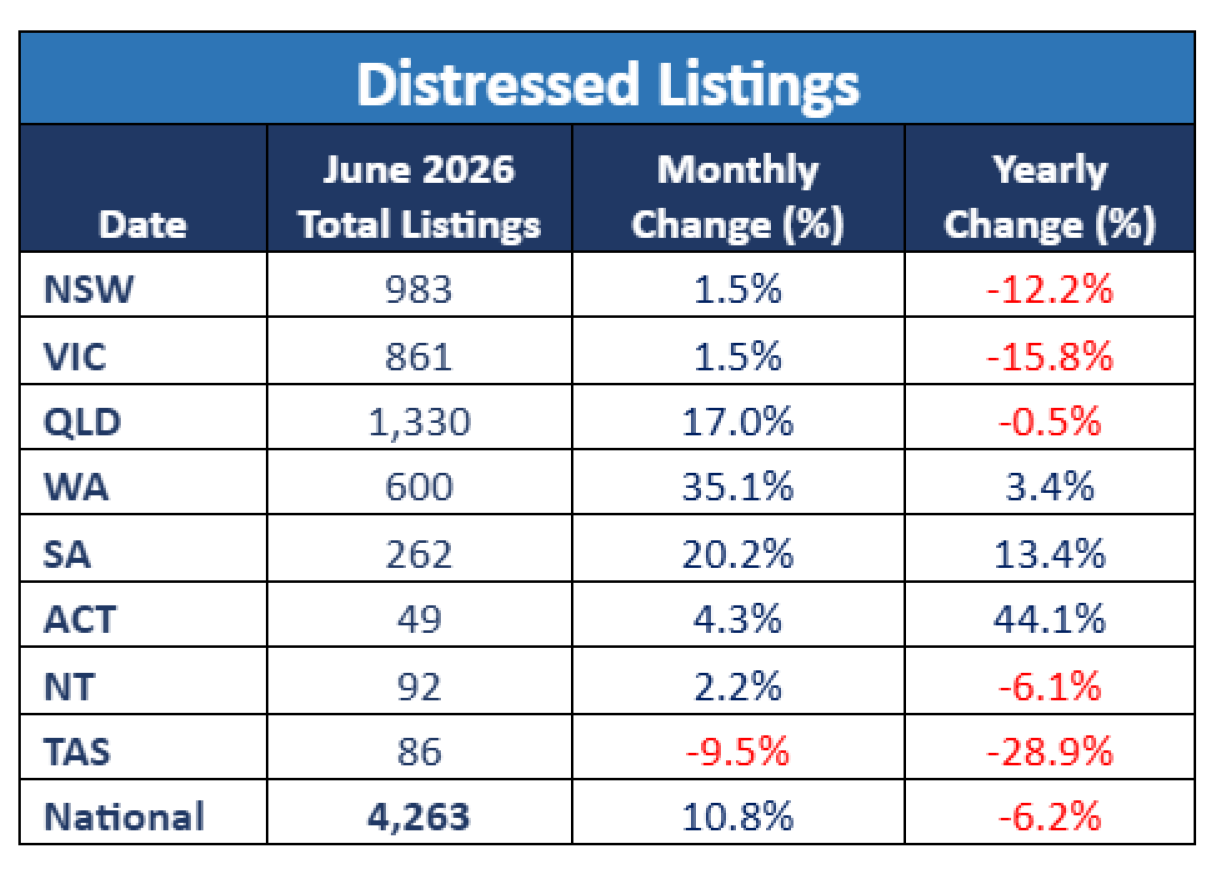
- Distressed listings increased 10.8% nationally, although they remain 6.2% below June 2025 levels.
- National asking prices softened over the month but continue to record annual growth.
Total listings
Australia’s residential property market cooled in June following the strong increase in listings recorded during May, with national listings declining 4.1% to 248,249 dwellings. While the monthly fall reflects a typical winter slowdown, overall supply remains healthier than a year ago, with national listings now 6.1% higher annually.
Sydney (-5.6%) and Melbourne (-6.1%) recorded the largest monthly declines among the major capitals, though both cities continue to report significantly higher stock levels than a year ago, up 17.4% and 19.6% respectively.
Brisbane was one of the few major capitals to continue building supply, with listings rising 1.2% over the month and 8.0% year-on-year.
Following three consecutive months of strong growth, Perth experienced a modest pullback, with total listings easing 5.3% during June. Even so, listing levels remain broadly consistent with long-term trends despite sitting 5.4% below June 2025.
Adelaide declined 5.2% for the month but remains 10.4% higher than a year ago. Canberra recorded the largest monthly decline nationally (-10.1%), while Darwin continued to edge higher (+2.0%). Hobart experienced the sharpest fall among the capitals (-11.9%), with listings now 17.4% below last year’s level.
New listings
New listings eased 10.4% nationally to 69,247 dwellings, reflecting the seasonal slowdown typically seen during winter.
Sydney (-19.8%) and Melbourne (-20.1%) recorded the largest declines in fresh listings following strong activity during May.
Brisbane (-5.5%), Perth (-9.2%) and Adelaide (-10.2%) also recorded lower levels of new stock entering the market.
Canberra declined 19.0%, while Hobart fell 21.5% after elevated activity in previous months.
Darwin was the only capital to record a notable increase, with new listings rising 5.2% for the month and 33.5% higher than a year ago.
Despite the monthly slowdown, national new listings remain 10.3% above June 2025 levels.
Old listings
Older stock declined 2.1% nationally to 72,266 dwellings, suggesting longer-dated listings continue to be gradually absorbed.
Sydney (-6.1%), Melbourne (-3.0%) and Brisbane (-4.6%) all recorded declines, while Perth (-3.9%) also saw a reduction in older listings.
Adelaide (-1.4%) and Canberra (-11.1%) continued to record falling levels of aged stock.
Darwin (-11.0%) and Hobart (-4.5%) also experienced declines, with Darwin remaining 40.1% below levels recorded a year ago.
National old listings remain 6.2% lower than June 2025.
Distressed listings
Distressed listings rose 10.8% nationally during June to 4,263 properties, representing the second consecutive monthly increase. However, distressed stock remains 6.2% lower than a year ago.
Queensland (+17.0%), Western Australia (+35.1%) and South Australia (+20.2%) recorded the strongest monthly increases, while New South Wales and Victoria each increased 1.5%.
The ACT continues to stand out, with distressed listings 44.1% higher than a year ago despite only a modest monthly increase (+4.3%).
Tasmania was the only state to record a decline during the month (-9.5%).
Asking prices
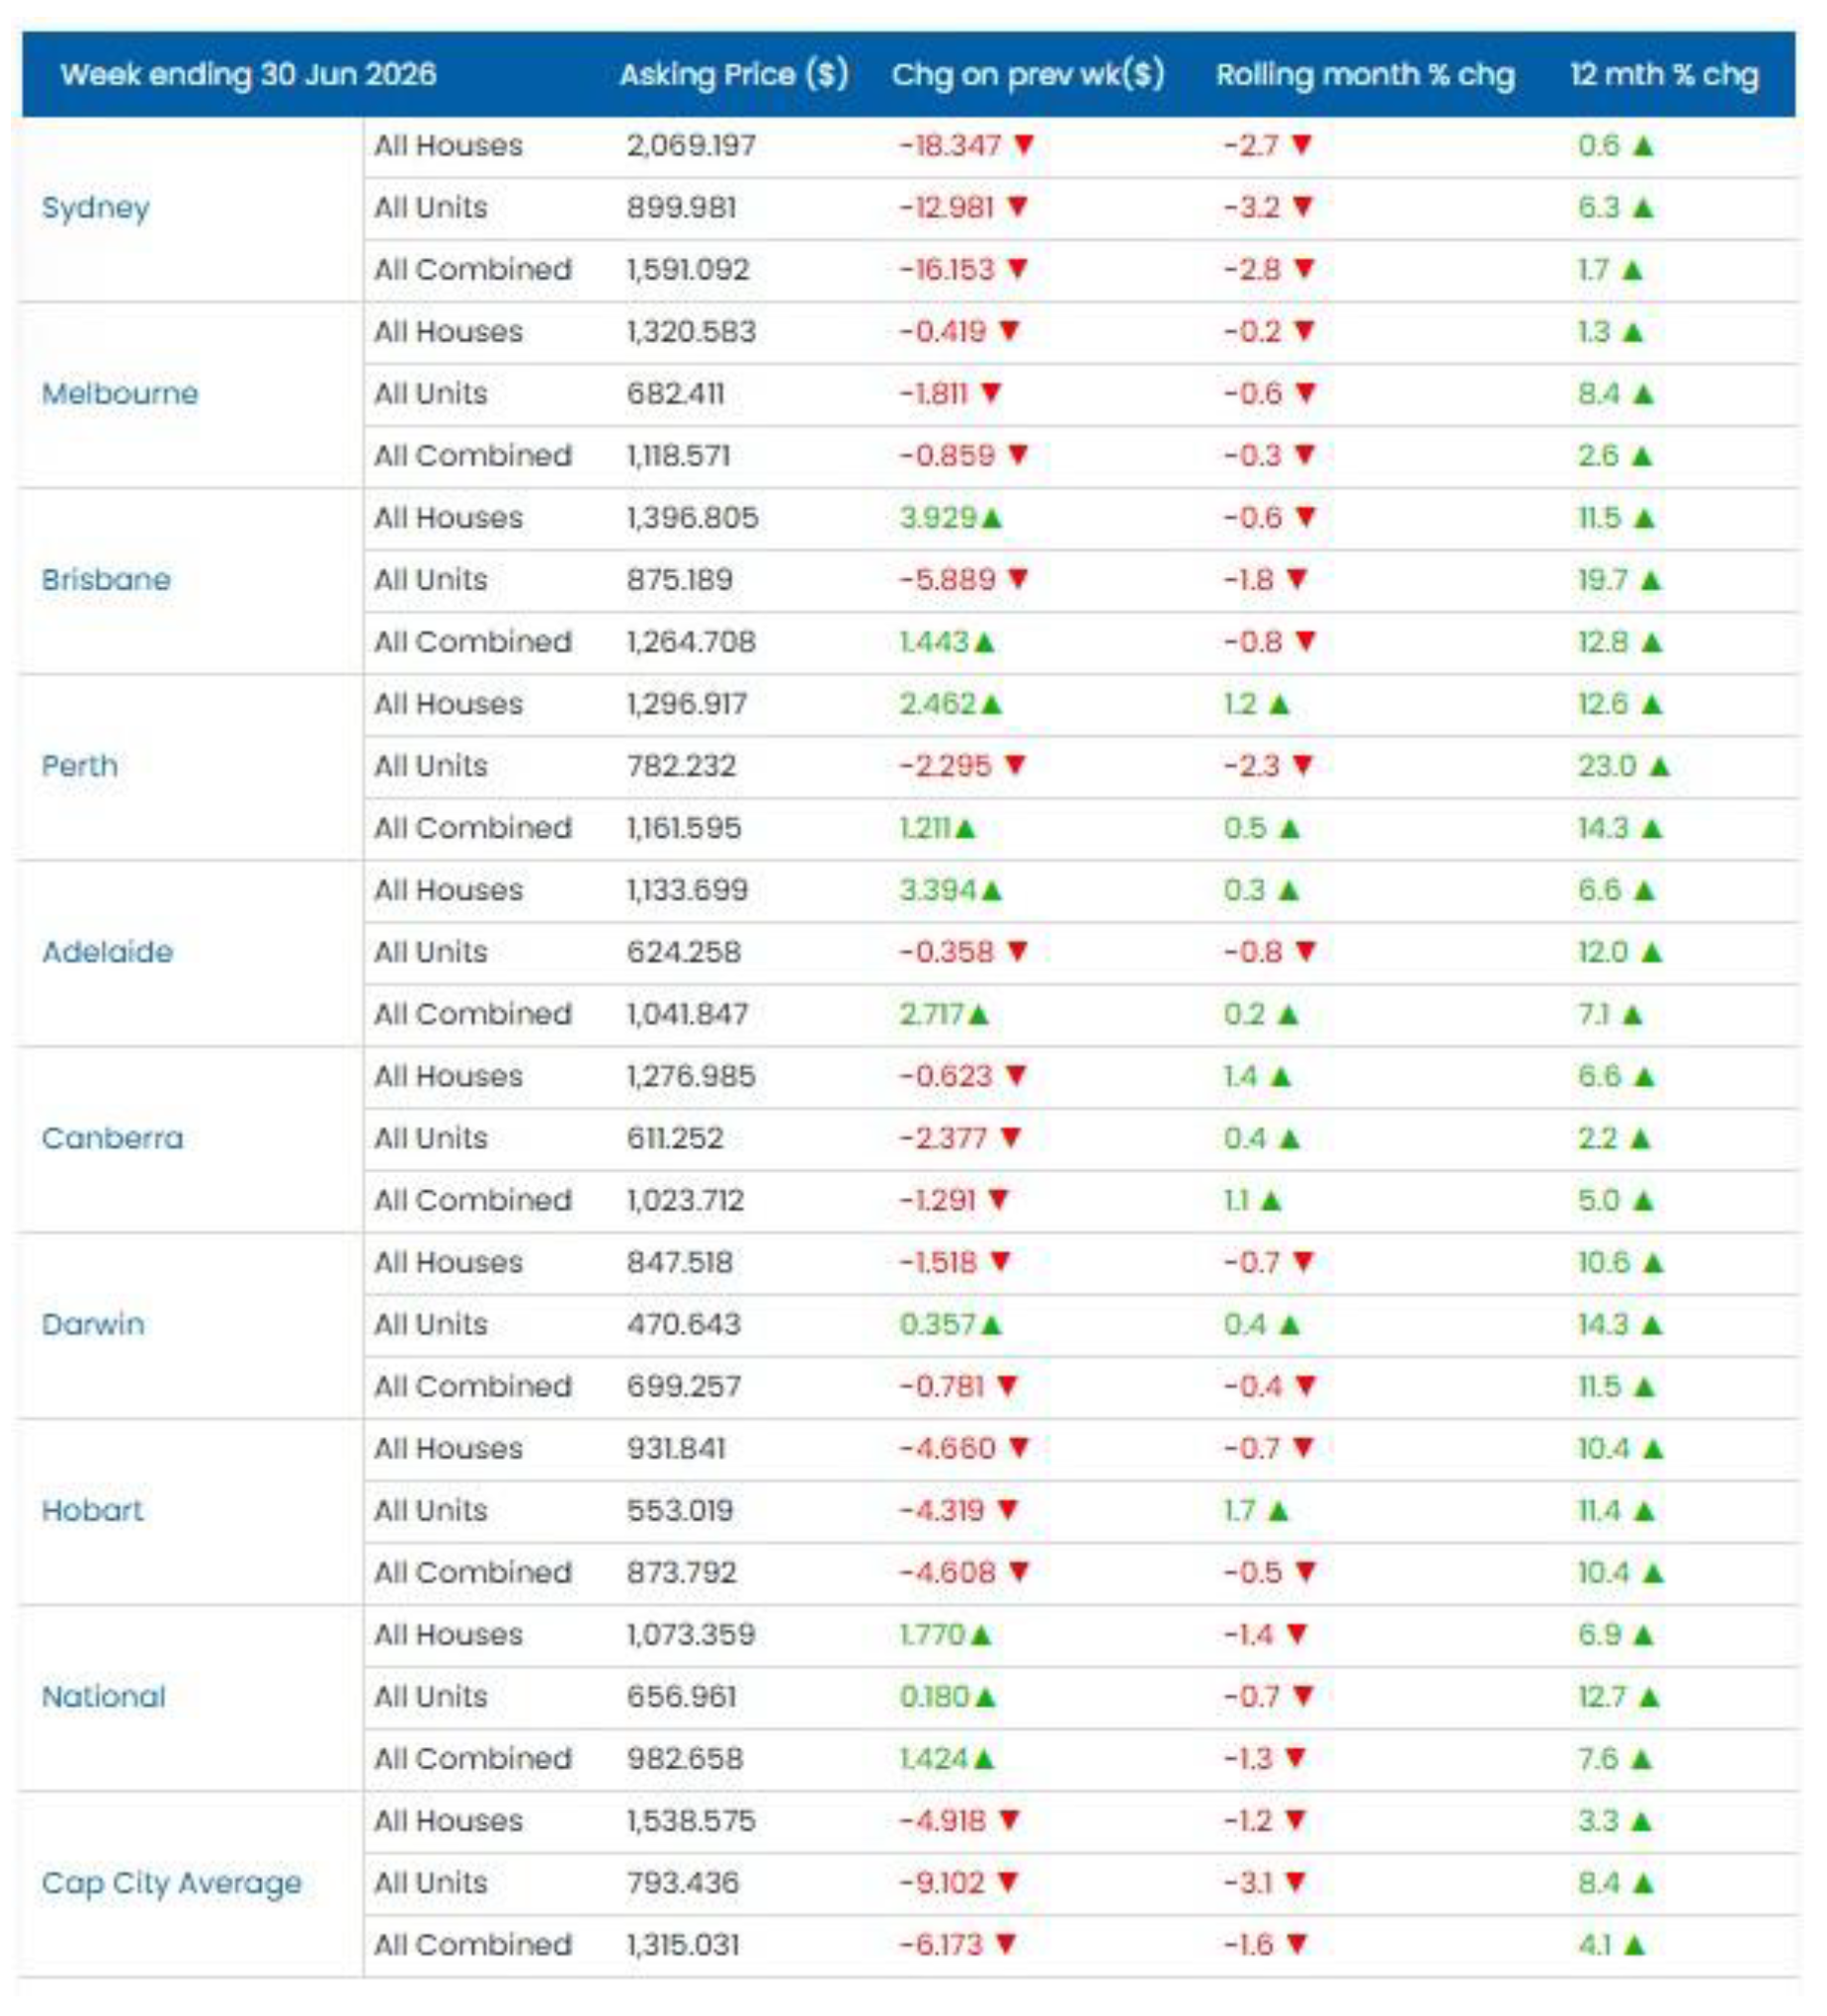
SQM Research’s Weekly Asking Prices Index for the week ending 30 June 2026 showed a softer month for asking prices across many capital cities, although annual price growth remains positive.
Nationally, asking prices declined 1.4% for houses and 0.7% for units, with combined dwelling asking prices down 1.3% over the month, while remaining 7.6% higher year-on-year.
Sydney recorded the largest monthly decline in combined asking prices (-2.8%) but remains 1.7% higher than a year ago.
Melbourne (-0.3%) and Brisbane (-0.8%) also recorded modest monthly declines, while annual growth remains positive at 2.6% and 12.8% respectively.
Perth continued to outperform, with combined asking prices rising 0.5% over the month and 14.3% higher year-on-year, while Adelaide also recorded a modest monthly increase (+0.2%) and remains 7.1% higher annually.
Canberra recorded a 1.1% monthly increase and remains 5.0% higher year-on-year. Darwin recorded a slight monthly decline in combined asking prices (-0.4%) while remaining 11.5% higher year-on-year.
Hobart also recorded a modest monthly decline (-0.5%), though combined asking prices remain 10.4% higher than a year ago.
Commentary
Louis Christopher, Managing Director, SQM Research “The June figures reflect what we would normally expect to see at the beginning of winter, with new listings easing after a particularly strong May. While overall supply has pulled back over the month, the broader picture remains negative, with national listings above where they were this time last year, indicating stock is struggling to move.”
“Sydney and Melbourne continue to carry significantly more stock than a year ago, while Brisbane has continued to add listings despite the seasonal slowdown. Perth has also eased after three months of exceptionally strong growth, although supply remains relatively tight compared with historical levels.”
“One trend we’re watching closely is the continued increase in distressed listings. While they’re still below last year’s levels nationally, we’ve now seen two consecutive monthly increases, particularly across Queensland and Western Australia. It’s something we’ll continue to monitor over the coming months.”
“One other trend we are watching is the movement of people selling to private treaty compared to auction, which is not unsurprising during a housing downturn.”
“Overall, the market remains well supplied. Supply has improved compared to last year, asking prices continue to hold up reasonably well, and we’re not yet seeing evidence of widespread financial stress.”


