
Labour Price Index
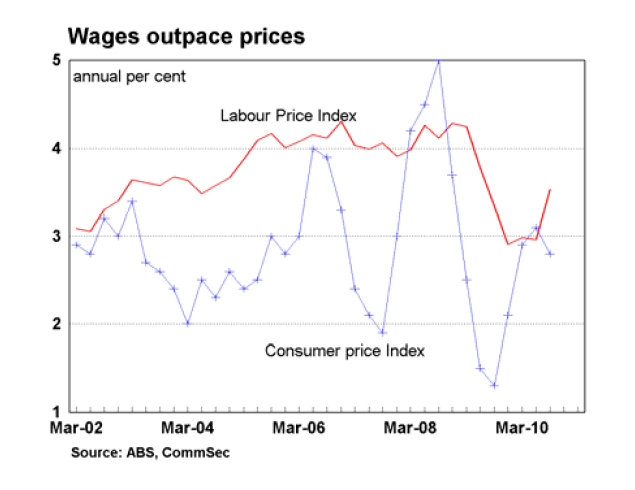
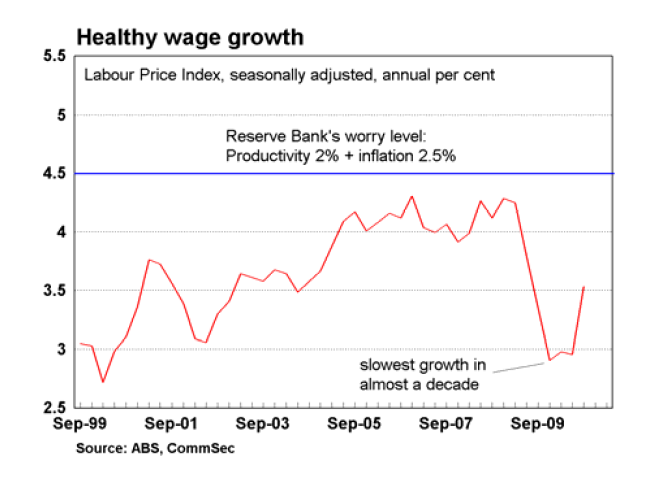
- Wages lift driven by the minimum wage increase. Wages rose by 1.1 per cent in the September quarter. In annual terms wages are up 3.5 per cent on a year ago.
- Public sector wages continued to outstrip wage gains in the private sector. Compared with a year earlier, private wages were up just 3.5 per cent while public sector wages lifted by 4.0 per cent.
What does it all mean?
- The latest wage data reflects the improving economic landscape. After bottoming out in the December quarter wage growth has recorded healthy gains in the September quarter. Annualised wage growth of 3.5 per cent is a win-win situation. For private sector companies wages growth is not excessive, serving to keep costs down in a period where discount is still adding margin pressure. But for employees, wages are once again growing at a faster rate than prices, boosting the purchasing power of consumers.
- In original terms wages rose by a sharper than expected 1.4 per cent in the September quarter. However the result was heavily influenced by the minimum wage decision, which took effect from July 1. Almost 1.5 million workers rely on the minimum wage and the recent rise effectively contributed around 0.5 per cent to the overall September quarter result. The smoother trend measure of wage growth was a more sedate 1.0 per cent, highlighting that in an underlying sense wages rises are still not excessive.
- The pickup in wage growth is unlikely to alarm the Reserve Bank at this stage. Rather healthy wage growth is just what the domestic economy needs to combat higher interest rates repayments on mortgages and the rise in utility charges like electricity, gas and water. The sustained pickup in employment and healthy growth in wages both point to firmer consumer spending in the mid-term.
- We take it for granted in Australia, but the real wage gains recorded over the past decade have been instrumental in underpinning household spending and overall economic growth. And had real wages not increased over the period it’s clear that the much debated argument on whether Australia faced a housing bubble would have more credibility. Essentially robust wage gains over the past decade have ensured that housing remains affordable.
- Importantly growth in wages across the private sector is still being outpaced by public sector – though the gap has narrowed. Public sector pay has continued to barrel along at a 4 per cent plus annual rate while private sector wages have all but recovered from the weak growth pace recoded through the global financial crisis. As the economy picks up momentum over the coming year, wage growth in the private sector is likely to match and eventually outpace the public sector – similar to what occurred in late 2007 and early 2008.
- At present wage inflation is well contained. The concern for the Reserve Bank is the expected fall in unemployment over the coming year and the likely impact on wages down the track. It is unlikely that the Reserve Bank will look at raising interest rates in the next couple of months. The last rate rise was a pre-emptive hike against future inflation, essentially giving the central bank flexibility at future meetings.
What do the figures show?
Wage price index
- The wage price index rose by 1.1 per cent in the September quarter after lifting by 0.8 per cent in the June quarter. Annual wage growth rose from 3 per cent to 3.5 per cent. Moving further away from the decade low of 2.9 per cent set in the December quarter.
- Private sector wages rose by 1.2 per cent while public sector wages rose by 0.9 per cent. Compared with a year earlier, private wages were up 3.5 per cent. Annual growth of public sector wages remained steady at 4.0 per cent.
- Including bonuses, wages rose by 1.6 per cent in original terms in the quarter with annual growth of ordinary time hourly rates rising from 3.2 per cent to 3.9 per cent in the September quarter.
- Industries with fastest annual wage growth: Electricity, gas, water & waste (up 4.4 per cent), Education & training (up 4.4 per cent), Financial and insurance services (up 4.2 per cent), Professional, scientific and technical services (up 4.1 per cent) and Mining (up 3.8 per cent).
- Industries with slowest annual wage growth: Information media and telecommunications (up 2.3 per cent), Wholesale trade (up 2.5 per cent), and Rental, hiring and real estate services (up 2.6 per cent).
- Annual wage growth across States & Territories: NSW, 3.5 per cent; Victoria, 3.5 per cent; Queensland, 3.9 per cent; South Australia, 3.3 per cent; Western Australia, 3.8 per cent; Tasmania, 3.2 per cent; Northern Territory, 3.9 per cent; and ACT, 3.8 per cent.
What is the importance of the economic data?
- The Labour Price Index has been compiled since September quarter 1997 and measures quarterly changes in wage and salary costs for employees. The index is based on a representative sample of employees, and includes measures of non-wage costs including superannuation, payroll tax, public holiday and workers compensation. The Labour Price Index is useful in measuring wage pressures in the economy. While strong growth in wages would boost domestic spending, it could also serve to lift employer costs and prices and add to economy-wide inflationary pressures. The labour price index is a measure of hourly pay rates (excluding bonuses).
What are the implications for interest rates and investors?
- The Reserve Bank doesn’t need to worry about excessive wage growth at present. However wage inflation is likely to be an issue over the later part of 2011 as the economy picks up momentum and unemployment continues to slide.
- The weakness in wage growth over the past year has been the main reason that consumer spending has been depressed. Especially given that households were confronted with sharply higher utility costs, council rates, rents and mortgages. The pickup in wages should continue to lift as the job market tightens, and that should lead to firmer consumer spending in 2011.

Produced by Commonwealth Research based on information available at the time of publishing. We believe that the information in this report is correct and any opinions, conclusions or recommendations are reasonably held or made as at the time of its compilation, but no warranty is made as to accuracy, reliability or completeness. To the extent permitted by law, neither Commonwealth Bank of Australia ABN 48 123 123 124 nor any of its subsidiaries accept liability to any person for loss or damage arising from the use of this report.
The report has been prepared without taking account of the objectives, financial situation or needs of any particular individual. For this reason, any individual should, before acting on the information in this report, consider the appropriateness of the information, having regard to the individual’s objectives, financial situation and needs and, if necessary, seek appropriate professional advice. In the case of certain securities Commonwealth Bank of Australia is or may be the only market maker.
This report is approved and distributed in Australia by Commonwealth Securities Limited ABN 60 067 254 399 a wholly owned but not guaranteed subsidiary of Commonwealth Bank of Australia. This report is approved and distributed in the UK by Commonwealth Bank of Australia incorporated in Australia with limited liability. Registered in England No. BR250 and regulated in the UK by the Financial Services Authority (FSA). This report does not purport to be a complete statement or summary. For the purpose of the FSA rules, this report and related services are not intended for private customers and are not available to them.
Commonwealth Bank of Australia and its subsidiaries have effected or may effect transactions for their own account in any investments or related investments referred to in this report.


