
How are Australia’s states and territories performing? Each quarter CommSec attempts to find out by analysing eight key indicators: economic growth; retail spending; equipment investment; unemployment, construction work done; population growth; housing finance and dwelling commencements.
Just as the Reserve Bank uses decade averages to determine the level of “normal” interest rates; we have done the same with the economic indicators. For each state and territory, latest readings for the key indicators were compared with decade averages – that is, against the “normal” performance.
In the last report in July 2011, Western Australia was judged the strongest economy from the ACT. And in the latest report Western Australia has tightened its grip on top spot. Western Australia leads the way in overall economic growth and equipment investment and is strong in retail spending, population growth and construction work.
What has become clear in the latest report is that the eight states and territories are effectively divided into three groups. Western Australia is in a group by itself. The next level comprises ACT, Victoria and South Australia. And then there is another gap to the next four states & territories: Tasmania, NSW, Northern Territory and Queensland.
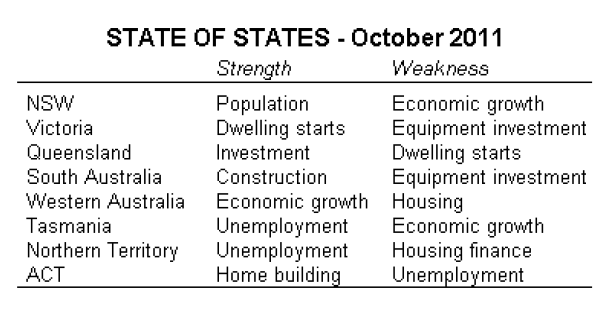
Looking ahead, Queensland should continue to benefit from rebuilding activity after the floods and cyclones in early 2011. The state has posted strong results in retail spending, construction and equipment investment over the past quarter.
Economies divided into three groups
Western Australia is clearly the nation’s strongest economy, underpinned by Asian demand for mining resources. Western Australia leads the way on economic growth and equipment investment while also possessing strong readings on retail spending, construction work and population growth. The main weakness is the residential sector with below-average dwelling starts and falling home prices.
Looking across the indicators, the ACT continues to lead the way on four of the eight indicators – population growth, commercial & engineering construction, housing finance and dwelling starts. But the ACT has the weakest performance of the states and territories on both unemployment and equipment investment. And the ACT is also under-performing on retail spending. While the ACT clearly has the second strongest economy, both Victoria and South Australia aren’t far away and it is probably best to view the three economies together.
Victoria is strongest in the housing sector – dwelling starts and housing finance – although home prices are softening after a period of out-performance. Victoria also out-performs in retail spending although other indicators are largely middle ranked.
The South Australian economy performs solidly on overall economic growth and building & construction work but is middle ranked on other indicators. The main area of under-performance is dwelling starts and housing finance.
There is little to separate Tasmania, NSW, Northern Territory and Queensland. Tasmania out-performs with a relatively low unemployment reading but somewhat surprisingly under-performs on retail spending.
NSW benefits from above-average population growth, firmer growth in housing finance and above-normal equipment investment. But dwelling starts are both below normal and below year ago levels.
Northern Territory continues to out-perform with low unemployment and solid growth of retail spending. But population growth, construction work and housing finance are below long-term averages and under-performing other states and territories.
The Queensland economy is beginning to see the benefits from rebuilding work from the floods and cyclone that occurred earlier this year. The state is also benefiting from strong demand for mining and energy resources in the Asian region. The main area of under-performance is housing – dwelling starts and housing finance – a situation not helped by weakness in population growth and unemployment. The economy should continue to lift over the coming year.
How was performance judged?
Each of the states and territory economies were assessed on eight key indicators: economic growth; retail spending; equipment investment; unemployment, construction work done; population growth; housing finance and dwelling commencements.
The aim was to find how each economy was performing compared with “normal”. And just like the Reserve Bank does with interest rates, we used decade-averages to judge the “normal” state of affairs. For each economy, the latest level of the indicator – such as retail spending or economic growth – was compared with the decade average.
While we also looked at the current pace of growth to look at economic momentum, that can yield perverse results to judge performance. For instance retail spending may be up sharply on a year ago but from depressed levels. Overall spending may still be well below “normal”. And clearly some states such as Queensland and Western Australia consistently have faster economic growth rates due to historically faster population growth. So the best way to assess economic performance is to look at each indicator in relation to what would be considered ‘normal’ for that state or territory.
For instance, the trend jobless rate of 4.0 per cent in the ACT is lower than in all but the Northern Territory. But compared with its ‘normal’ or decade-average rate of 3.5 per cent, the jobless rate is actually higher in percentage terms than any other economy, affecting activity in the retail sector.
Trend measures of the economic indicators were used to assess performance rather than more volatile seasonally adjusted or original estimates.
Economic growth
Ideally gross state product (GSP) would be used to assess broad economic growth. But the data isn’t available quarterly. Rather state final demand (household and business spending) is added to exports less imports to act as a proxy for GSP. Excluding the trade sector would provide an incorrect assessment of growth for economies such as Western Australia and Queensland.
Western Australia continues to lead the rankings on economic activity from the ACT and South Australia. In the June quarter, Western Australia’s economic output was just under 28 per cent higher than the state’s decade average level of output. ACT output was up 21 per cent on its long-term average, followed by South Australia (up 16.7 per cent).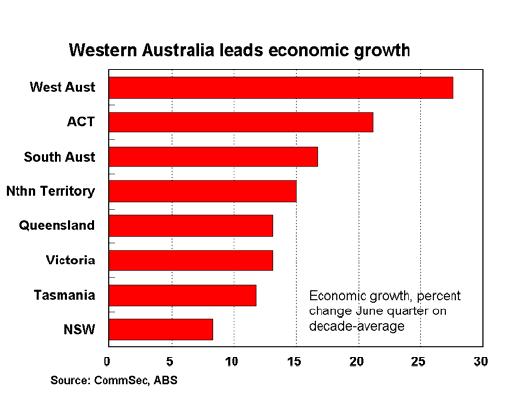
At the other end of the scale, economic activity in NSW in the June quarter was just over 8 per cent above its decade average while Tasmanian activity was up almost 12 per cent on its “normal” or average output over the past decade.
The ACT has the fastest annual economic growth rate in the nation at 5.9 per cent, ahead of South Australia with 4.7 per cent and Western Australia with 4.6 per cent.
The weakest trend economic growth rate was recorded in the Northern Territory (-1.4 per cent) from Queensland and NSW.
Retail trade
The measure used was real (inflation-adjusted) retail trade in trend terms with June quarter data the latest available. Monthly retail trade was also assessed (August data available) to provide further information on trends. There were no differences in the rankings despite the monthly data being two months advanced on the real, quarterly readings.
Still leading the retail rankings is Northern Territory with spending in the June quarter 22 per cent above decade average levels. Supporting spending is a strong job market and previous gains in home prices. But it’s worth noting that actual growth in spending in the “top end” is down 0.2 per cent on a year ago in real terms.
Western Australia was next strongest, courtesy of low unemployment, with spending 20 per cent above decade-average levels. Western Australia also has the strongest growth in retail spending, up a stunning 5.2 per cent on a year ago.
Victoria was next strongest, with spending 16 per cent above decade averages, followed by Queensland and South Australia. Tasmania remains at the bottom of the leader-board, with spending up just 9.3 per cent on the decade average. And real retail spending in Tasmania is 3.3 per cent lower than a year ago – the weakest performance of the states and territories.
Equipment investment
Compared with longer-term averages, Western Australia currently is head and shoulders above other states and territories on equipment investment with spending in the June quarter almost 70 per cent above “normal” – or decade-average levels. Next placed is Queensland (up 38 per cent), followed by Tasmania (up 31 per cent).
By contrast, equipment spending in the ACT was up just 2.5 per cent on its decade-average. Next weakest economy – Northern Territory – had business investment 4.3 per cent above its longer-term average in the June quarter.
On a shorter-run analysis, equipment investment was only lower than a year ago in just two of the state and territory economies – Northern Territory (down 29.2 per cent) and Victoria (down 1.1 per cent). Tasmania is leading annual growth rates on equipment investment (up 50.3 per cent) from the ACT (up 39.5 per cent) and Western Australia (up 35.7 per cent).
Unemployment
Tasmania arguably has the strongest job market in the nation, but the lowest jobless rates can be found in Northern Territory and the ACT.
The trend jobless rate in Tasmania stands at 5.0 per cent, well below the long-term average of 6.2 per cent. The jobless rate in the Northern Territory stands at 3.9 per cent, below the long-term average of 4.6 per cent.
While unemployment is low in the ACT at 4.0 per cent, it is actually higher than the decade average of 3.5 per cent.
Western Australia was next strongest to the Northern Territory with a jobless rate of 4.2 per cent, 7 per cent below the decade average of 4.6 per cent. Apart from the ACT, Queensland and NSW have unemployment rates above their respective decade averages.
Construction work
The measure used for analysis was the total amount of residential, commercial and engineering work actually completed in trend terms in the June quarter.
In all states/territories except the Northern Territory, construction work is substantially higher than decade averages. Construction peaked in the ‘top end’ in March quarter 2009 at record levels. The relatively small Northern Territory economy is affected to a greater extent by the ‘lumpiness’ of major construction projects. Construction work in the Northern Territory is down just over 37 per cent on the decade average.
By contrast, in the ACT construction work done in the June quarter was 67 per cent above the decade average. And construction work in the ACT is also up 20 per cent on a year ago – the fastest rate in the nation.
Next strongest was Western Australia with construction work 66 per cent higher than decade averages followed by South Australia, up 40 per cent, and Queensland, up 32.5 per cent.
Construction work is higher than a year ago in all states/territories except Northern Territory (down 8.0 per cent), Tasmania (down 4.8 per cent) and South Australia (down 3.9 per cent).
Population growth
To assess population performance we looked at the current annual growth rate and compared it with each economy’s decade-average growth pace. And after outperforming from 2007-2010, currently population growth is above ‘normal’ in only three states or territories.
Population growth is above average in the ACT (1.79 per cent) followed by Western Australia (2.23 per cent) and NSW (1.14 per cent). Western Australia and the ACT also have the fastest population growth rates in the land from Queensland (1.63 per cent). But while third fastest, Queensland’s population growth is actually the slowest rate for that state in 11 years.
At the other end of the leader-board is the Northern Territory with its 0.41 per cent annual population growth rate the slowest in 7½ years, and 74 per cent below its 1.6 per cent decade-average growth pace.
Housing finance
The measure used was the trend number of housing finance commitments and this was compared with the decade-average for each respective state and territory.
Housing finance is not just a lead indicator for real estate activity and housing construction but also is a useful indicator of activity in the financial sector. It would be good to also use figures on commercial, personal and lease finance, but unfortunately trend data is not available for states and territories.
Far away in top position for housing finance is the ACT. The number of housing finance commitments in the ACT is 18.5 per cent higher than the decade-average at a time when all other states and territories except Victoria are recording negative growth. The high level of activity is positive for financial institutions, real estate agents and builders in the territory.
And not only is housing lending in the ACT above longer-term averages, it is also growing, up 5.4 per cent over the year, although it is only fourth fastest behind Western Australia (up 17.2 per cent).
Victoria is in second spot for housing finance, with the number of commitments 6.2 per cent above the long-term average. And just like the ACT, home lending is also growing, up 7.3 per cent in trend terms compared with a year ago.
NSW was third on housing finance, albeit down 8 per cent on the decade average followed by Western Australia (down 11.4 per cent) and Tasmania (down 18.6 per cent).
The Northern Territory remains the weakest economy for housing finance with trend commitments 25.2 per cent lower than its decade average, although only slightly worse than Queensland (down 24.6 per cent on its decade average). However in trend terms, Northern Territory’s housing lending is up 0.6 per cent on a year ago whereas Queensland commitments are down 2.4 per cent.
Dwelling starts
The measure used was the trend number of dwelling commencements (starts) with the comparison made with the decade-average level of starts. Starts are driven in part by population growth and housing finance and can affect retail trade, unemployment and overall economic growth. However any over-building or under-building in previous years can affect the current level of starts.
The ACT is head and shoulders above other economies on dwelling starts, supported by strong population growth. In the June quarter the number of dwellings commenced stood at a record 1,341 in trend terms, up 82 per cent on the decade average and 18.3 per cent higher than a year ago.
In second spot was Victoria with dwelling starts in the June quarter 28 per cent higher than ‘normal’ or “decade average” levels while Tasmanian starts were almost 2 per cent above the decade average.
At the other end of the scale, Queensland dwelling starts were not only 30.5 per cent below decade averages but it was also 17.9 per cent down on a year ago.
In NSW, dwelling starts were 18.2 per cent below decade averages in the June quarter, with starts in the Northern Territory 9.9 per cent below decade averages while South Australian starts were 9.5 per cent below its “normal” rate of activity. While the ACT was the only economy to post stronger starts compared with a year ago, NSW starts were just 2.5 per cent down on a year earlier.
Other indicators
At face value it appears that real wages were flat to negative in NSW, Queensland, ACT and South Australia in the June quarter. But ‘one-off’ factors such as cyclones and floods in Queensland forced up food prices in the March and June quarters. The annual rate of headline inflation is tipped to ease in coming quarters to 2.5-3.0 per cent. In comparison, wages are likely to grow close to 4 per cent, pointing to higher real wages ahead.
Still, the lift in a raft of living costs has affected consumer confidence and retail spending over 2011. And falling home prices has exacerbated the pain for Aussie consumers.
Home prices are now falling modestly in all capital cities except Sydney. However the declines in prices follow solid growth in prices in 2009 and early 2010 in response to low interest rates and grants to first-home buyers. Over the past five years Darwin prices grew on average by 10.9 per cent a year with Melbourne prices up 9.5 per cent and Perth prices up 9.3 per cent. Sydney had the slowest lift in home prices – up 4.6 per cent a year.
Implications and outlook
The main change in the state rankings over the past three months has been the significant out-performance of the Western Australian economy and the separation of other economies into two groups. The ACT leads the second group from Victoria and South Australia. But there is little to separate Tasmania, NSW, Northern Territory and Queensland. The term ‘multi-speed’ is therefore very appropriate when considering economic performance.
Overall most states have recorded above decade-average readings for economic growth, real retail spending, equipment investment and construction work. But performances have proved much more mixed on the other four indicators.
The outlook for the Western Australian economy remains bright and in fact there are even signs of improvement identified for housing activity. Still, it is important to note that prospects remain significantly tied to the fortunes of Asia, in particular, China.
The ACT economy continues to be supported by above-average population growth, which is underpinning strong activity in residential, commercial and engineering construction. The upward trend in the jobless rate bears watching however, especially as retail spending is weaker than in most other economies.
The Victorian economy is being underpinned by the housing sector so the recent upward trend in housing finance is encouraging. However it should be noted that equipment investment is growing at a far slower annual pace than other economies.
Below-normal unemployment could prove a catalyst driving improvement in the Tasmanian economy in coming months. And the Queensland economy should continue to lift in line with rebuilding work and spending.
Other economies are struggling to define the ‘X-factors’ that will drive growth. NSW and Northern Territory will probably need to focus on home building and affordability issues while South Australia should get a boost from mining sector investment.


