
To get a closer insight into where SMSF trustees invest, Multiport regularly undertakes an analysis of our SMSF’s investments to look at the up to date asset allocation and investment trends which have or may be emerging.
The survey covers around 1,600 funds, a sample of the SMSF’s that we administer and the investments they held at 30 September 2011. Funds are administered on a daily basis which ensures that data is based on actual investments and is completely up to date. The assets of the funds’ surveyed represent approximately $1.3 billion.Increase to Cash, Short Term Deposits and Fixed Interest.
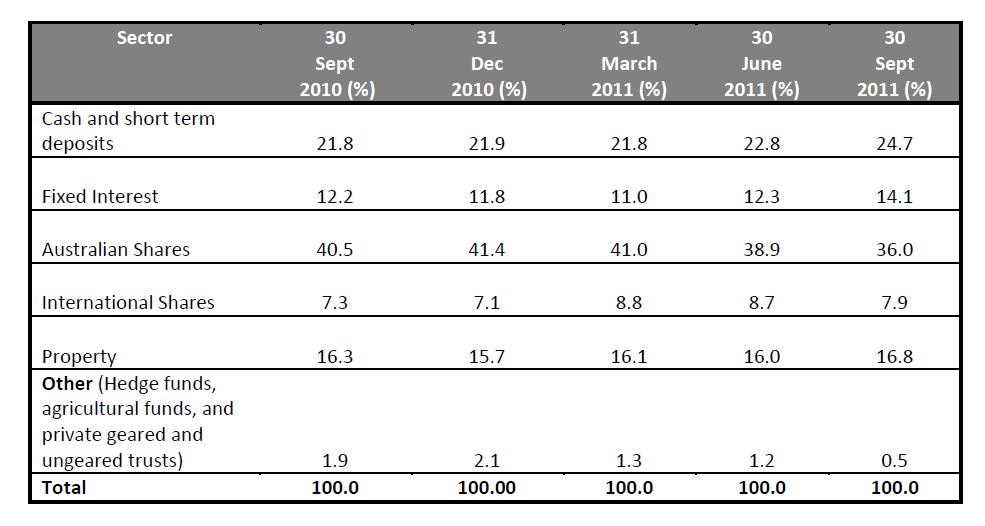
The September quarter saw cash holdings increase by nearly 2% and Fixed Interest assets increase around the same. Australian Shares exposure however fell quite drastically by nearly 3%. The change is a combination of:
- Dividends being paid out in this quarter contributing to the increase in cash holdings for September. Trustees seem to have not reinvested this money in the share market due to current uncertainty and have instead kept the cash in either short or longer term deposits.
- A drastic fall in the Australian share markets in the third quarter.
- International shares fell nearly 10% which is less than the market falls but this was counter balanced by the fall in the $AUD.
The overall asset allocation break-up as at 30 September 2011 was:
Cash holdings move up
Cash holdings have increased to 24.7% in September 2011, which is up 2% since the last quarter and is now at its highest level in 2 years. We have seen a minor sell off in assets as a result of current market uncertainty in the Australian Stock Exchange. Dividends were also paid out and investors seem to have either held on to the cash or placed their money into either short or longer term fixed interest investments.
The average contribution inflow for the quarter was up at $21,292 and the benefit payment outflows were significantly higher at $35,940 per fund. This affirms that the increase in cash is derived from the dividends received. Another reason for the benefit levels to have increased is due to the recalculation of member benefits and the impact of the reduced minimum pension payment discount which was effective 1 July (50 to 25%).
Australian equities exposure falls
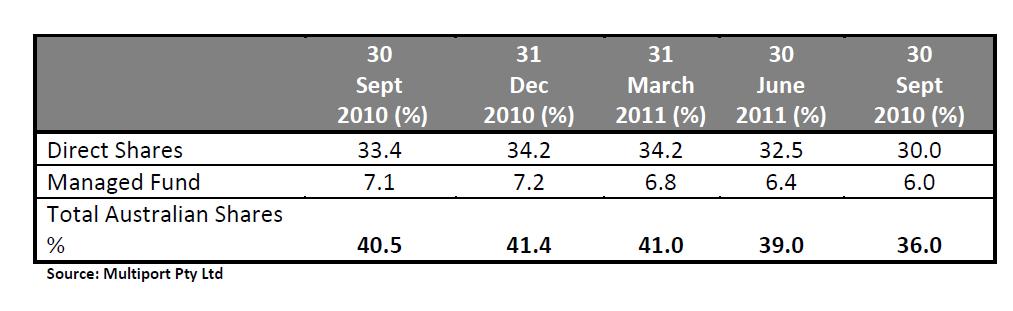
Where trustees are using managed funds in this asset class they display a bias to specialist funds including midcap and smaller company funds. These funds have taken a much greater hit than the Top 50 blue chip stocks in the recent market downturn.
Top 10 Australian shares
The September quarter saw Origin Energy drop out of the Top 10 ASX listed stocks held by our funds. Other stocks were virtually unchanged from the previous quarter with Investors continuing their preference for blue chip stocks.
Telstra did work its way back in to the top 10, being one of the few stocks that had a price increase over the quarter. Interestingly the Top 10 shares make up 15% of total assets held and this remained unchanged over the past two quarters. If trustees are selling shares, they are not selling these Top 10 company shares.
The most commonly held ($ invested) shares at 30 September 2011 were:
- BHP Billiton
- Commonwealth Bank
- Westpac
- ANZ
- National Australia Bank
- Wesfarmers
- Woolworths
- Woodside
- Telstra
- Rio Tinto
International holdings
The September quarter saw International holdings fall due to market conditions. Market falls were significantly worse than the domestic market fall but countering this was the depreciation in the Australian Dollar which curbed this loss.
The split between managed funds and direct investment continues to show investors comfort in using managed funds as a preferred method of investing in overseas markets.
Property allocation
Direct Property allocation increased in this quarter to 14.5%, its highest level since December 2008. This reflects the ongoing acquisitions in this asset class and use of gearing strategies. Managed funds however remained steady at 2.3%.
As gearing within SMSF’s continues to increase in appeal, perhaps exacerbated by current share market uncertainty, trustees are turning to property and gearing. Companies are developing products to make this process easier for trustees. Multiport released a property gearing package earlier this year and have seen an increase in investment in this area in the past quarter.
Fixed Interest
This quarter saw quite a significant increase in the fixed interest exposure as investors continue to choose the security of 30 to 60 day term deposits and other fixed interest investments as they try a more cautious strategy.
Exposure to Managed Funds
The survey has again reflected an 80/20 split of investments with the direct investment approach highly favoured. The major exception is still International Shares where primary exposure is via Managed Funds. We have not yet seen a significant take up of ETF’s as a replacement for managed funds.
SMSF Trustees start utilising limited recourse borrowing arrangements
Around 16% of the funds in the survey are currently utilising a borrowing arrangement. The graph below shows the split of borrowing arrangements across direct property and financial assets at 30 September 2011.
The average property loan amount remains at around $217k compared to $238k against financial assets. We have seen an increase in loan amounts for financial assets this quarter which is predominantly due to the use of protected equity products with higher gearing ratios than is currently available for direct property.


