
ASX: October trading activity slower than September
The value of ASX-listed stocks, as measured by the All Ordinaries Index, rebounded sharply during October 2011 to rise 7.1%, following a decline of 6.9% in September. This performance was in line with rises in other major markets including: the US up 10.8%, Hong Kong up 12.9%, the UK up 8.1%, Singapore up 6.8%, and Japan up 3.3%.
The movements in global markets continued to be driven by fluctuating views on the economic outlook for Europe and the stability of the European banking system. Volatility remained above average historical levels as investors reacted to changing perceptions of the ability of policy makers to address the underlying debt concerns.
Trading activity on ASX equity and derivative markets declined in October compared to September.
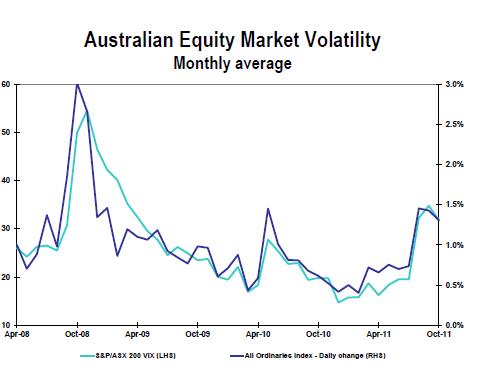
Measures of volatility in the Australian equity market remained above historical averages during October:
- Current volatility (as measured by the average daily movement in the All Ordinaries Index) was 1.3% in October, down marginally on the previous month (1.4%).
- Expected future volatility (as measured by the S&P/ASX 200 VIX) fell on average in October to 31.8 (compared to 34.8 in September).
Volatility in US markets (S&P 500 Index) remained high in October, with average daily movements of 1.6% (1.6% in September). Expectations of future volatility in the US also remained elevated during October.
Listings and capital raisings
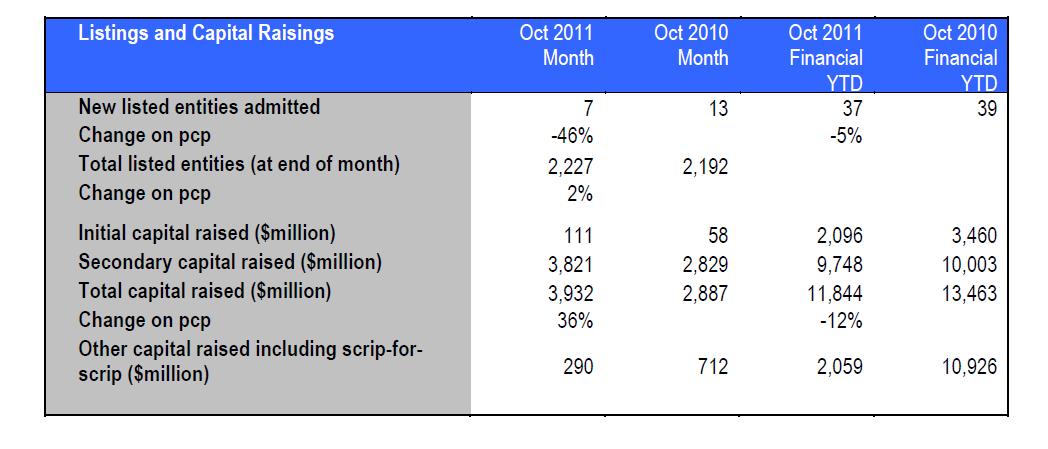
- In October 2011 there were 7 new listings, down 46% on the 13 in the previous corresponding period (pcp).
- Total listed entities at the end of October 2011 were 2,227, up 2% on the 2,192 of a year ago.
- There was $111 million of initial capital raised in October 2011, compared to $58 million in the pcp.
- Secondary capital raised in October 2011 totalled $3.8 billion compared to $2.8 billion in the pcp. There was also $290 million of other capital raised, including scrip-for-scrip, in October 2011.
- Total capital raised in October 2011 amounted to $3.9 billion, up 36% on the $2.9 billion raised in the pcp.
Trading – Cash markets (including equities, interest rates and warrants trades)
The All Ordinaries Index closed at 4,360.5 points at the end of October, a rise of 7.1% over the course of the month. The index has fallen 10.0% in the calendar year and is 7.9% lower than a year ago. Total cash market trades for October 2011 were 13.6 million, up 12% on the pcp.
- Average daily trades for October 2011 of 647,814 were also 12% higher than the pcp.
- Total cash market traded value was $99.5 billion in October 2011, down 11% on the pcp. The average daily value traded of $4.7 billion in October 2011 was also down 11% on the pcp.
- In October 2011 the average value per trade was $7,310, down 21% on the pcp of $9,207. The percentage of traded value crossed was 23% (27% pcp).
The cash market was halted from 10.05am until 2.00pm on 27 October due to an internal network connectivity issue with ASX Trade.


