The ‘Free Lunch’ Is Over – it’s time to get active in emerging markets
The reasons to invest in faster-growing emerging markets remain compelling. However, the drivers of emerging markets are changing, which has consequences for the approach investors take. Rebalancing in the global economy will create new winners and losers; new nations will come to the fore and acronyms such as BRICs will become increasingly outdated.
The last decade may offer little guide to the future given that investors in emerging markets benefited from a rare, synchronised upswing in 2003-8 where all markets were lifted by a rising tide – a free lunch was on offer. Where an indiscriminate or passive approach worked in the past, it is unlikely to fare so well in the future.
Emerging markets will still grow faster than developed markets and should remain a source of attractive returns. However, there is likely to be far greater differentiation between markets, sectors and stocks. Active management of investments will be vital as country and stock fundamentals reassert.
Looking forward, country, sector and stock selection are likely to be paramount as divergences reassert themselves. Previously, investors made strong returns by investing indiscriminately in global emerging markets. This ‘free lunch’ is now over.
The free lunch is over
The last decade was remarkable. So remarkable, it is unlikely to be repeated. Synchronised growth in emerging economies and stock markets from 2003-2008 was unprecedented in its strength and breadth. In fact, by 2007, only three countries in the world suffered negative economic growth as a rising tide lifted all boats. Global stock markets were driven much more by macroeconomic factors than previously. There were two key drivers behind this rare ‘Goldilocks’ phase:
- The global economy, especially emerging markets, benefited from a flood of debt-fuelled liquidity, or ‘easy money’.
- Double-digit Chinese growth provided a strong tailwind for emerging markets, supporting commodity demand, and painting a compelling narrative for investors.
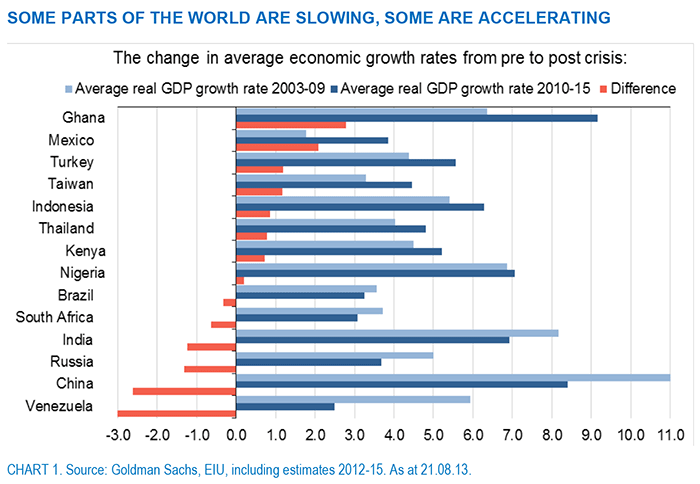
Without a continued supply of ‘easy money’, growth in emerging markets should ease back to historical averages and we can expect more volatility in business cycles. As growth rates diverge, investors must view emerging markets as individual stories, not one heterogeneous bloc. Selectivity within emerging markets will be crucial, requiring a more active approach.
The next decade is unlikely to be a continuation of the last
Investors have a habit of extrapolating the recent past into the future. But, history shows that economies and markets do not move in straight lines. The next decade is highly unlikely to offer a continuation of what worked in the last. The implications of China’s economic rebalancing will create winners and losers across emerging markets. In addition, unanticipated political and technological developments are bound to have a bearing on global economic trends. At the start of the 1990s, forecasters would have taken little account of the impact of the internet or China.
Throughout history, the baton of emerging-market leadership has been passed among a diverse set of nations. Some grew quickly and offered promise before falling out of the MSCI Emerging Markets Index due to political regimes that applied controls to capital flows (e.g. Argentina and Venezuela). Economic convergence is not a given; it is hard earned. It is vital to differentiate between markets that will continue to emerge in a positive manner from those at risk of ‘submerging’ from previous highs, for example through eroded competitive positions or excessive populist policies.
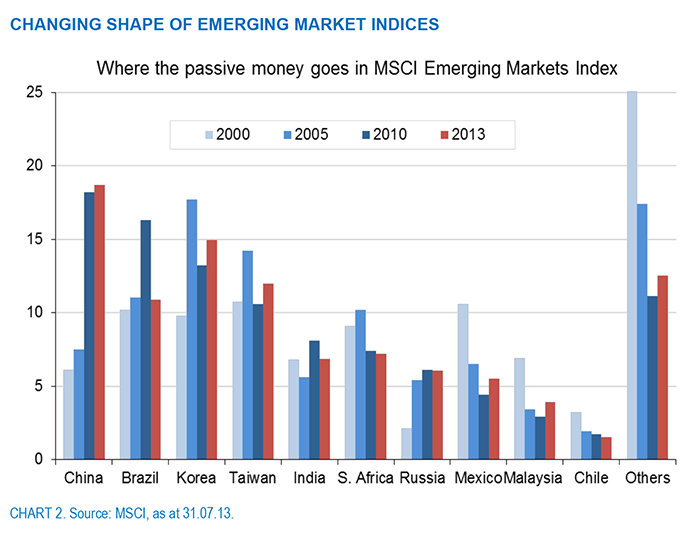
Indices: A better reflection of past success than future potential
As chart 2 shows, the composition of emerging markets has changed considerably over the last decade. The exceptional growth of certain large markets has resulted in a much greater degree of concentration in the MSCI EM Index than was present at the start of the decade. In 2000, investing in the index meant allocating across a broad spread of emerging countries with Brazil, Taiwan and Mexico accounting for just over 10 per cent each. Investors who bought the index in 2000 benefited from the double whammy of increasing exposure to strongly performing winners like China and Brazil.
Now, investing in the index means allocating large portions to China (18.7%) and Brazil (10.9%) – two of the best-performing countries of the boom period (2003-2008), whose rates of growth have slowed measurably since. The growing index weights of the ‘top 4’ have had the effect of squeezing down exposure to other emerging countries, such as Mexico, Malaysia and South Africa. This index concentration presents a much more serious challenge to passive investors than it does active investors, the latter of which can underweight and overweight exposure to countries, sectors and stocks based on fundamental research that takes account of market and stock specific factors.
Emerging markets: more than just faster growth
Investing successfully in emerging markets is about more than simple economic growth. Over the medium-to-longer term, there does appear to be a relationship between economic growth and stock market performance but it’s not straightforward. The highest economic growth rates do not automatically translate to the best stock market returns, particularly in the short term. A host of other factors such as company fundamentals, stock valuations, macroeconomic and regulatory conditions, corporate governance and investors’ expectations all play their part. This complexity demands a diversified, stock-picking approach to emerging markets that focuses on a range of bottom-up factors over a simple focus on growth rates.
The importance of good governance
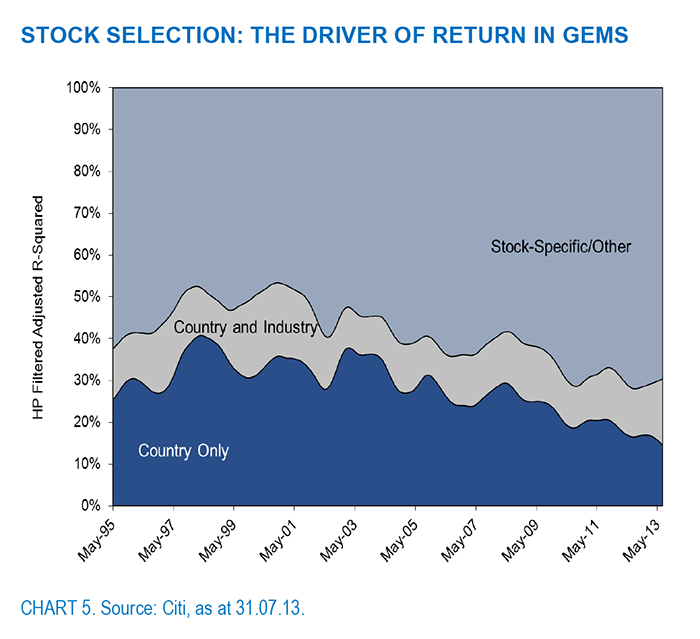
As the macroeconomic drivers that provided a tailwind to emerging economies in the last decade recede, the importance of fundamental stock drivers reasserts itself. Issues such as capital discipline, dividend policy, strategic management capability and corporate governance are becoming increasingly important for investors in emerging markets in the post-financial crisis world. As chart 5 shows, the dominant driver of returns is stock selection, although the contribution of country selection to returns is higher in emerging markets than it is in developed markets. This supports a focus on research-driven, bottom-up managers.
Active managers following a bottom-up approach seek to invest in businesses that achieve superior and sustainable returns on their assets, and who pass those returns onto their minority shareholders through capital appreciation or dividend payments. This ensures that the companies invested in are inherently profitable enough to fund their development without putting investors at risk of default or dilution.
How active is your manager?
Active management within emerging markets has been proven to add value over time, whereas the performance of the median passive manager (including transaction costs and fees), produces returns slightly lower than the index. Studies suggest that approximately 80 per cent of active strategies have outperformed the MSCI Emerging Markets Index over the last ten years; the top 25 per cent outperformed by more than 3 per cent per annum, comfortably covering their fees.
However, the key question is how to identify better than average active managers? Academic research by Martijn Cremers and Antti Petajisto suggests it is down to the level of activeness. Not only do truly active managers outperform (after fees) but they tend do so persistently. Critically, it is possible to identify these managers by looking at how active they are, how much they cost and how well they have performed in the past. A paper by Intersec Research that compensates for survivorship bias suggests the value of active management also builds over time (and across market cycles).
To ascertain how active a fund manager is we can look at how different they are from the benchmark index. This can be measured using ‘Active share’ (or ‘active money’), which is the sum of all of a manager’s overweight positions plus cash, expressed as a percentage of the portfolio’s net assets. It is a measure of how much the portfolio’s composition differs from that of the index (i.e. how active the fund is).
‘Active expense ratio’ takes the approach a step further and is a measure of how active a fund is relative to its cost. The measure provides a useful way for investors to compare active managers and identify those who are genuinely active and value for money on that basis.6 Skilled portfolio managers who operate with high active money combined with reasonable TERs (resulting in a low active expense ratio) have the best scope to outperform after fees (see table 2 below).
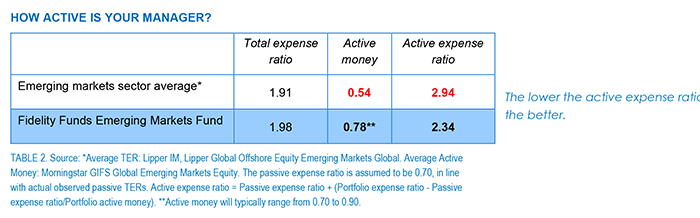
TABLE 2. Source: *Average TER: Lipper IM, Lipper Global Offshore Equity Emerging Markets Global. Average Active Money: Morningstar GIFS Global Emerging Markets Equity. The passive expense ratio is assumed to be 0.70, in line with actual observed passive TERs. Active expense ratio = Passive expense ratio + (Portfolio expense ratio – Passive expense ratio/Portfolio active money). **Active money will typically range from 0.70 to 0.90.The lower the active expense ratio, the better.
Conclusion
The emerging market story is becoming more diverse and layered, forcing investors to become more selective than before. The factors that supported the synchronised growth of emerging markets and their brief mistreatment as a ‘homogenous’ bloc are fading.
It is a mistake to believe that China’s rebalancing process will be a negative for emerging markets generally. It will simply create greater differentiation between winners and losers. The heterogeneity of emerging markets will once again come to the fore, rendering terms like BRICs outmoded for investors who want dynamic exposures to a range of markets. This is not time to take money off the table – in fact, emerging market valuations are now attractive relative to history and compared to developed markets (see appendix).
It is, however, time to change tack as to how money is invested. Investors must always try to look forward, and avoid the temptation to use recent history as a roadmap for the future. With emerging market indices exposed to material concentration risks in some of the areas most vulnerable to economic rebalancing, it is vital investors take an active and forward-looking approach.
Given the re-emergence of the business cycle and specific risks relating to corporate governance and other factors, investors should also pay particular attention to the investment style of their manager. Can they weather ‘down periods’? Do they focus on quality, well governed growth or growth at all costs? Those managers with a proven ability to take account of important qualitative and bottom-up factors such as corporate governance, ownership structure and management strategy should be well placed to serve their investors over the next decade.
Nick Armet, Investment Commentator at Fidelity
———————–


