State & territory economic performance report
- How are Australia’s states and territories performing? Each quarter CommSec attempts to find out by analysing eight key indicators: economic growth; retail spending; equipment investment; unemployment; construction work done; population growth; housing finance and dwelling commencements.
- Just as the Reserve Bank uses decade averages to determine the level of “normal” interest rates; we have done the same with the economic indicators. For each state and territory, latest readings for the key indicators were compared with decade averages – that is, against the “normal” performance.
- Western Australia remains the top-performing economy in the nation with no slippage in the ranking over the past three months. The Northern Territory has leapfrogged the ACT to become the second-best performing economy. But the big changes have been below with now little to separate the ACT and Queensland. NSW and Victoria follow and are closely grouped together. There is then a gap to South Australia and another gap to Tasmania with both states clearly under-performing other economies at present.
- Western Australia comes out on top on only one of the eight criteria – retail spending. Western Australia is now second on six of the eight indicators, and fourth on dwelling starts.
- The jump in the rankings of Northern Territory to second place is due to improvements in business investment, and unemployment. Queensland recorded solid strength in business investment and in housing finance propelling it into equal third with the ACT.
Western Australia still on top; NT moves up to second. ACT and Queensland now equal third.
- Western Australia remains Australia’s best performing economy, while the Northern Territory has jumped ahead of the ACT. NSW and Victoria, are now equal fifth.
- Western Australia leads the way on retail trade. It is second strongest on economic growth, business investment, construction work done, housing finance population growth and unemployment; and finished fourth on dwelling starts.
- The Northern Territory is now the second strongest economy with main strengths being economic growth, construction work, retail trade, dwelling starts and a huge improvement in unemployment. The Northern Territory is now third strongest in business investment. But it also in last place on housing finance.
- The ACT slipped down to third spot alongside Queensland. The ACT’s main weakness was a loss of momentum in terms of business investment. It also finished fifth on retail trade, unemployment and construction work.
- In contrast Queensland was the best performer when it comes to business investment, third strongest on economic growth, retail trade and construction work and a noted improvement over the quarter in housing finance (moving from sixth to fifth place). Queensland placed seventh strongest for population growth.
- There is still little separating NSW, and Victoria in terms of relative economic performance. NSW is third strongest on unemployment, population growth, housing finance and dwelling starts. Victoria is strongest on housing finance and fourth strongest on retail trade, business investment and population growth. But at the other end of the scale, NSW is seventh on economic growth while Victoria is seventh on construction work.
- There is then a gap in the rankings to South Australia. While the state is middle ranking on construction work, and fifth on business investment it is sixth or seventh on every other indicator.
Tasmania remains locked at the bottom of the Australian economic performance table. Tasmania lags all other economies on all of the indicators except for being sixth strongest on housing finance. The strength in housing finance may provide the state economy with a platform for improvement in coming quarters. Housing finance is up 20 per cent on a year ago, but still down 11 per cent on ‘normal’ or decade-average levels. But stagnant population growth is reducing activity across the economy, with added weakness in commercial, engineering construction and business investment.
How was performance judged?
- Each of the states and territory economies were assessed on eight key indicators: economic growth; retail spending; equipment investment; unemployment, construction work done; population growth; housing finance and dwelling commencements.
- The aim was to find how each economy was performing compared with “normal”. And just like the Reserve Bank does with interest rates, we used decade-averages to judge the “normal” state of affairs. For each economy, the latest level of the indicator – such as retail spending or economic growth – was compared with the decade average.
- While we also looked at the current pace of growth to look at economic momentum , it may yield perverse results to judge performance . For instance retail spending may be up sharply on a year ago but from depressed levels. Overall spending may still be well below “normal”. And clearly some states such as Queensland and Western Australia consistently have faster economic growth rates due to historically faster population growth. So the best way to assess economic performance is to look at each indicator in relation to what would be considered ‘normal’ for that state or territory.
- For instance, the trend jobless rate in the ACT of 4 per cent is lower than all economies. But compared with its ‘normal’ or decade-average rate of 3.4 per cent, the jobless rate is actually higher in percentage terms than four of the state and territory economies, thus restraining activity in the retail sector. Trend measures of the economic indicators were used to assess performance rather than more volatile seasonally adjusted or original estimates.
Economic growth
- Ideally gross state product (GSP) would be used to assess broad economic growth. But the data isn’t available quarterly. Rather state final demand (household and business spending) is added to exports less imports to act as a proxy for GSP. Exclusion of the trade sector would provide an incorrect assessment of growth for economies such as Western Australia and Queensland.
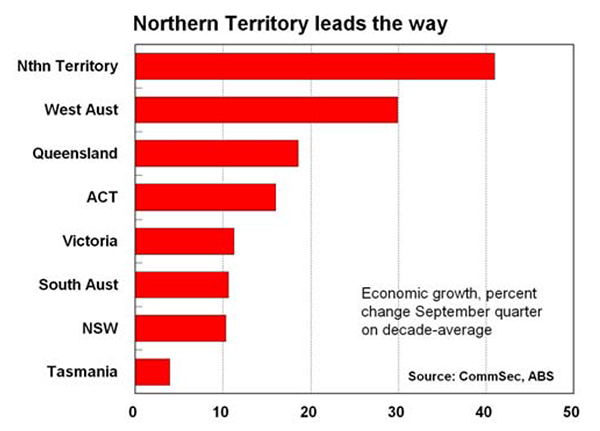
- The Northern Territory continues to lead the rankings on economic activity. Activity in the ‘top end’ is 41 per cent above its ‘normal’ or decade-average level of output.
- Next strongest is Western Australia, with output around 30 per cent higher than the decade average level of output. Then follows Queensland (up 18.6 per cent) from the ACT (up 16 per cent).
- At the other end of the scale, economic activity in Tasmania January 17 2014 3 Economic Insights: State of the States January 2014 in the September quarter was just 3.9 per cent above its decade average while NSW activity was up 10.3 per cent on its “normal” or average output over the past decade.
- There would be little change in the rankings if “final demand” was used instead. But Victoria would move from fifth to sixth spot and NSW would improve from seventh to fifth spot.
- Interestingly Queensland maintains the fastest annual economic growth rate in the nation, up by 4.2 per cent on a year ago, ahead of NSW with 2.2 per cent and South Australia (2.0 per cent).
- The weakest trend annual economic growth rate was recorded in Tasmania (-0.1 per cent) followed by ACT (1.1 per cent) and Victoria (1.4 per cent).
Retail trade
- The measure used was real (inflation-adjusted) retail trade in trend terms with September quarter data the latest available.
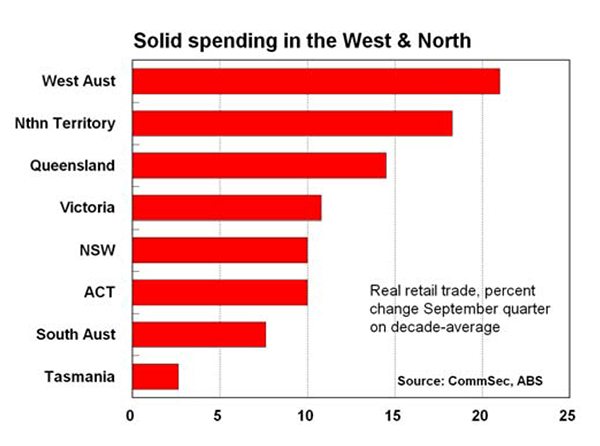
- Western Australia retains top spot on the retail rankings with spending in the September quarter, almost 22 per cent above decade average levels. Solid population growth, a lift in home purchases and firm wage growth underpin the relative strength in consumer spending.
- Northern Territory was next strongest, supported by a lift in dwelling construction, with spending 18.3 per cent above decade-average levels.
- Queensland was next strongest, with spending 14.5 per cent above decade averages, followed by Victoria (up 10.8 per cent).
- Tasmania has the weakest result on retail spending, up just 2.6 per cent on the decade average (up from 2 per cent in the June quarter), and below South Australia with growth of 7.6 per cent.
- If monthly retail trade was assessed instead (November data available), Tasmania would move to top spot, ahead of Northern Territory and NSW in the rankings. While the monthly results are more volatile it does seem to suggest that an improvement and turnaround in activity is seemingly taking place across the broader economy, with some of the weaker states starting to see a lift in activity levels.
- In terms of the monthly retail trade series, Tasmania is 5.8 per cent higher than a year ago, just in front of
- Northern Territory with 5.5 per cent growth, NSW with 4.6 per cent growth, Victoria with 4.5 per cent growth, Queensland up 4.3 per cent, followed by ACT up 4.2 per cent and South Australia up 4.1 per cent. At the other end of the scale, Western Australian spending is up 1.6 per cent.
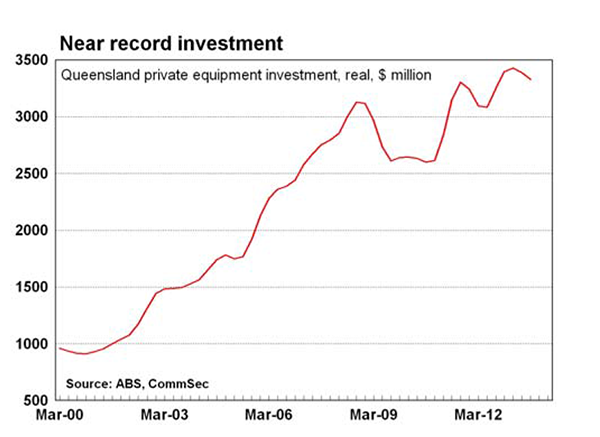
Equipment investment
- Queensland leads other states and territories when it comes to equipment investment. Spending in the September quarter was almost 27 per cent above “normal” – or decade-average levels. Mining investment still remained relatively strong across the resource states. Northern Territory was the biggest mover jumping from seventh to third spot. Equipment investment in Western Australia is now 24.6 per cent above decade-average levels followed by the Northern Territory (up 20.5 per cent), Victoria (up 8.8 per cent), South Australia (up 6.6 per cent) and NSW (up 6.3 per cent).
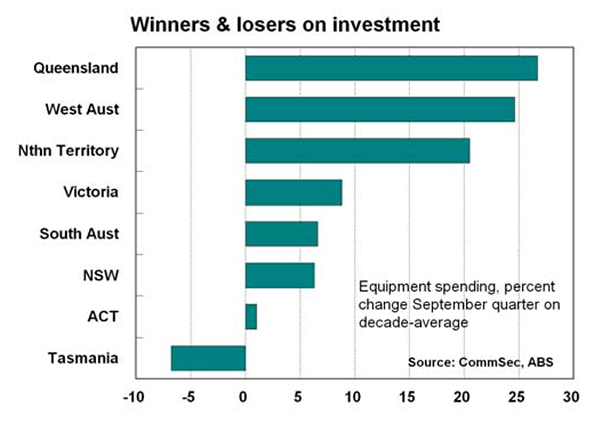
- By contrast, new equipment spending in Tasmania was 6.8 per cent below its longer-term average in the September quarter with the ACT up 1 per cent.
- On a shorter-run analysis, equipment investment in the September quarter was lower than a year ago in four of the state and territory economies. Currently equipment investment is down on a year ago in Western Australia (down 29.1 per cent), followed by the ACT (down 16.7 per cent), Tasmania (down 13.5 per cent), NSW (down 6.1 per cent). By contrast new equipment investment in, Victoria is up 6.6 per cent on a year earlier, followed by Northern Territory (up 4.8 per cent), South Australia (up 3.6 per cent) and Queensland (up 2.4 per cent).
Unemployment
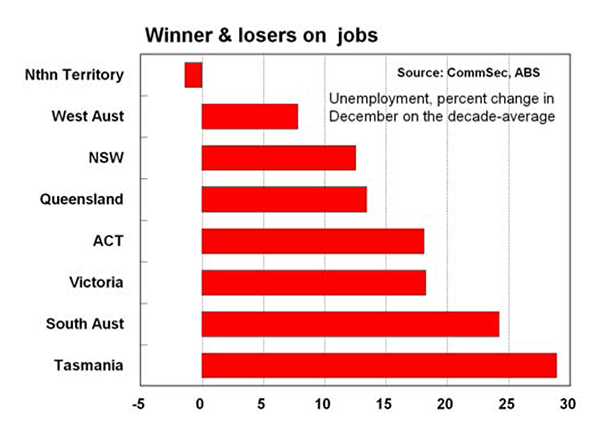
- Northern Territory and Western Australia have arguably the strongest job markets in the nation. Northern Territory has the second lowest trend unemployment rate in the nation at 4.2 per cent, while the jobless rate is actually 1.4 per cent below its “normal” or decade average level.
- Similarly in Western Australia, trend unemployment stands at 4.5 per cent and this is 7.8 per cent above its decade average rate of 4.2 per cent.
- In NSW, unemployment is higher at 5.8 per cent and this is 12.5 per cent above the “normal” or decade-average level of 5.2 per cent.
- At the other end of the scale, Tasmania’s 7.7 per cent jobless rate is the highest in the nation and up almost 29 per cent on the decade average. The South Australian job market is next weakest. In the past 12 months the jobless rate has lifted from 5.7 per cent to 6.7 per cent and it is now 24.2per cent above its decade average level of 5.4 per cent.
Construction work
- The measure used for analysis was the total amount of residential, commercial and engineering work actually completed in trend terms in the September quarter.
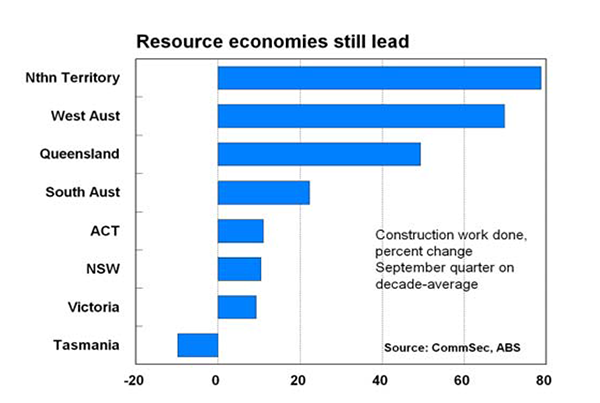
- In all states/territories except Tasmania construction work is higher than decade averages. And there remains a large gap between the strongest states (the resource states) and weakest states (Tasmania).
- In Tasmania, overall new construction work completed is 9.9 per cent below its decade average. By contrast construction work done in Northern Territory was almost 79 per cent above its decade average followed by Western Australia (up 69.9 per cent) and Queensland (up 49.3 per cent).
- Next weakest to Tasmania is Victoria where construction work is 9.3 per cent above decade averages, followed by NSW (up 10.4 per cent on the decade average).
- In terms of annual growth rates, Northern Territory construction work done in the September quarter was up 18.5 per cent on a year ago, followed by Queensland (up 6.8 per cent) and South Australia (up 2.4 per cent). In the ACT, construction work was 16.4 per cent below decade averages.
Population growth
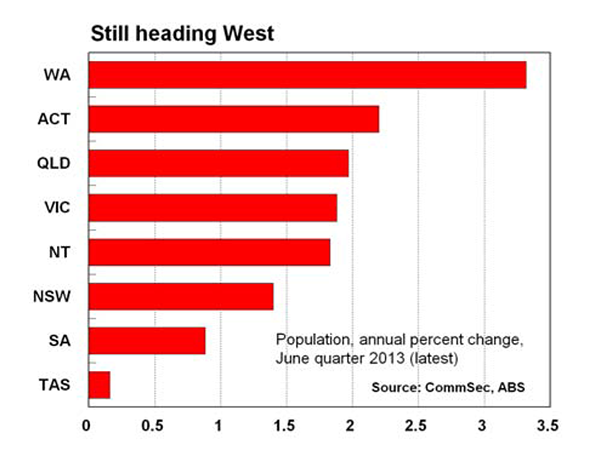
- To assess population performance we looked at the current annual growth rate and compared it with each January 17 2014 5 Economic Insights: State of the States January 2014 economy’s decade-average growth pace. And the good news is that population growth is above ‘normal’ in five states or territories with growth lifting in five jurisdictions over the past quarter.
- Western Australia is the clear leader in population growth. Not only is the annual growth rate of 3.32 per cent the strongest in the nation, it is also almost 33 per cent above the decade average. But the actual leader in the rankings is the ACT. Annual population growth of 2.2 per cent is 43 per cent above “normal’.
- In NSW current annual population growth of 1.4 per cent is 27.4 per cent above the decade average.
- At the other end of the leader-board is Tasmania where the annual population growth of 0.16 per cent was 78 per cent below the decade average rate of 0.73 per cent but growth did lift in the June quarter from 0.11 per cent.
Housing finance
- The measure used was the trend number of housing finance commitments and this was compared with the decade-average for each respective state and territory.
- Housing finance is not just a lead indicator for real estate activity and housing construction but also is a useful indicator of activity in the financial sector. It would be useful to compare figures on commercial, personal and lease finance, but unfortunately trend data is not available for states and territories.
- In four of the states and territories – the Victoria, Western Australia, NSW and the ACT – trend housing finance commitments are above decade averages. Even more encouragingly commitments in November were above year-ago levels in all states and territories, except for the Northern Territory.
- The ACT was the biggest mover when it comes to housing finance commitments, dropping from top spot to fourth. In the strongest economy Victoria, the number of housing finance commitments was 9.8 per cent above the decade-average level and commitments in November were 12.6 per cent higher than a year ago.
- Western Australia was in second spot for housing finance, with the number of commitments 8.3 per cent above the long-term average.
- NSW has moved up to third spot on housing finance, up 5.4 per cent on the decade average followed by the ACT (up 4.7 per cent). And importantly the NSW market has momentum with home lending 20.4 per cent higher than a year ago in trend terms.
- Northern Territory is the weakest economy for housing finance with trend commitments 19.2 per cent lower than its decade average. Next weakest was the Tasmania with trend commitments down 20.4 per cent on the decade average, but encouragingly commitments were up 20.2 on a year ago.
Dwelling starts
- The measure used was the trend number of dwelling commencements (starts) with the comparison made to the decade-average level of starts. Starts are driven in part by population growth and housing finance and can affect retail trade, unemployment and overall economic growth. However any over-building or under-building in previous years can affect the current level of starts.
- The outlook for housing construction has improved, underpinned by state government grants for new construction and low interest rates. Dwelling starts are above decade averages in four of the states and territories and starts in five states and territories are above levels of a year ago.
- The ACT is in the strongest position for new housing construction, with starts almost 57 per cent above decade averages. In addition in the September quarter the number of dwellings started was 27.4 per cent higher than a year earlier, the strongest annual gain in two years.
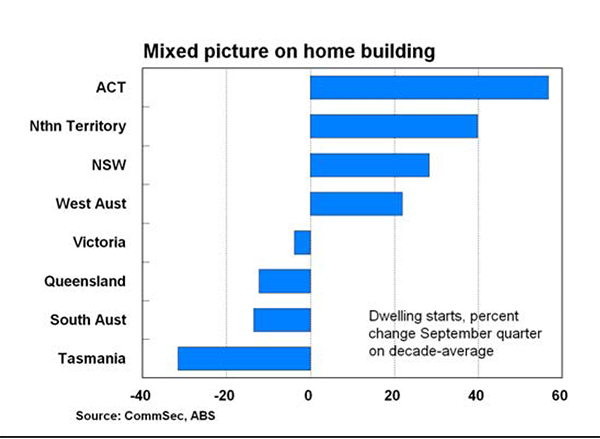
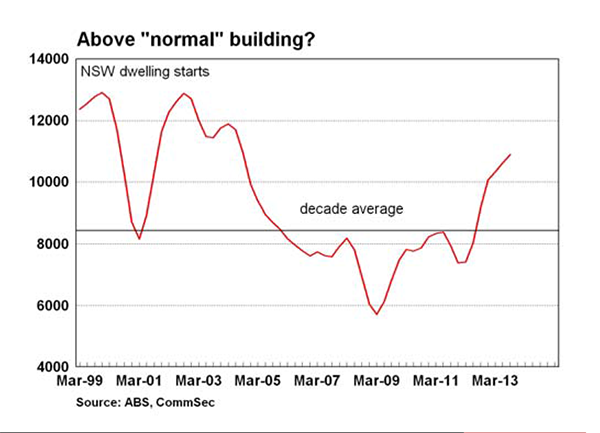
- In second spot was Northern Territory, with starts almost 40 per cent above decade averages. But momentum is January 17 2014 6 Economic Insights: State of the States January 2014 lagging with starts in the quarter 11 per cent lower than a year ago, down from 67.9 per cent growth in the March quarter. In NSW, dwelling starts in the September quarter were up 28.3 per cent on the ‘normal’ or “decade average” level with starts in Western Australia up almost 22 per cent on decade averages.
- At the other end of the scale, Tasmanian dwelling starts were 31.6 per cent below decade averages, while starts in the September quarter were 5.5 per cent down on a year earlier. Next weakest was South Australia (down 13.5 per cent), Queensland (down 12.3 per cent) and Victoria (down 3.9 per cent). However encouragingly Queensland starts were 8.8 per cent higher.
Other indicators
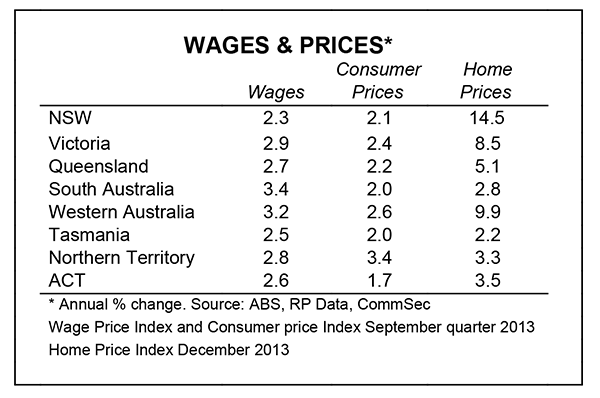
- Real wages were positive in all economies in the September quarter except for the Northern Territory. Strongest growth occurred South Australia at 1.4 percentage points, followed by the ACT (0.9 percentage points) and Western Australia (0.6 percentage points).
- Even using “underlying” inflation than “headline” inflation, real wages are growing on average by around 0.5-1.0 percentage points.
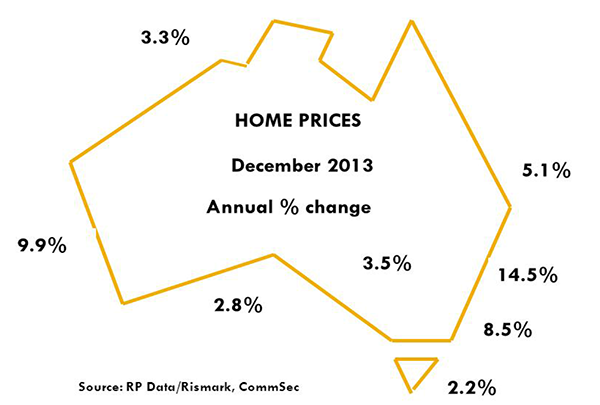
- Home prices are now higher than a year ago in all capital cities across Australia. Strongest growth in home prices was in Sydney (up 14.5 per cent) followed by Perth (up 9.9 per cent) and Melbourne (up 8.5 per cent). Interestingly growth rates of home prices are still below decade averages in all the rest of the capital cities. The decade average growth in Sydney is 2.7 per cent, well below other capital cities of between 4.7-10.2 per cent.
Implications and outlook
- State and territory economies continued to grow in the September quarter, but below the more “normal” growth rates over the past 5 years or 10 years. Western Australia continues to lead other economies in a relative sense with little slippage over the past three months.
- The Northern Territory has leapfrogged the ACT to become the second-best performing economy.
- But the big changes have been below with now little to separate the ACT and Queensland. NSW and Victoria follow and are closely grouped together. There is then a gap to South Australia and another gap to Tasmania with both states clearly under-performing other economies at present
- All economies should lift now that consumers and businesses are showing a sustained level of optimism. The low interest rate environment is boosting housing construction, while rising wealth levels is supporting confidence and in turn spending.
- The slowdown in mining investment will continue to affect some regions, however this should be offset by a lift in residential building. NSW, Western Australia, Queensland and ACT are expected to benefit most from a lift in home building. In addition the lower Australian dollar should provide a boost to exports in coming months and help to alleviate the risks surrounding the rebalancing of the economy.
- Firm real wages and improved housing affordability are being reflected in a lift in retail spending in Tasmania. If this leads to increased employment then there will be potential for stronger economic momentum in coming months.
Savanth Sebastian, Economist, CommSec


