Arguably, 2013 was the best year for Australian equities since the global financial crisis (GFC).
The general improvement was largely underpinned by a gradual but persistent recovery in fundamentals throughout the year.
While some may argue it is fully priced, we believe it is entirely possible the Australian stock market is in the early stages of a bull run that started in the middle of last year, and is set to continue in 2014 and beyond.
Right now, our view is that the market is primed to reward investors that focus on quality and growth; two of Platypuses core competencies.
This outlook is similar to our market view back in 2004 and there are numerous fundamental and technical indicators supporting our bull market thesis.
Fundamental indicators
Leading fundamental indicators are supportive of Australian equities, including low interest rates and an improving property market—both of which have a positive wealth effect.
Low interest rates are unambiguously positive for the Australian equity market. Accommodative rates are expected to remain for some time, with the Reserve Bank of Australia (RBA) looking for the interest-rate sensitive segments of the market to take up the slack from the end of the mining investment boom.
While the RBA may move its rhetoric from an easing bias to a neutral bias over 2014, it is unlikely to start raising rates until there is a substantial pick-up in employment or a significant inflation pulse threatens the broad economy. In general, we expect rates will remain below normal long run levels for some time. At present values, the cash rate represents poor value compared to the dividend that equities provide.
The weakening currency is also providing a tail wind to the economy, as a weaker Australian dollar acts as a quasi-easing monetary policy. A sustained lift in global growth, especially driven out of the US, will continue to put downward pressure on the Australian dollar, significantly boosting domestic competitiveness and export earnings.
The initial benefits of a low cash rate and lending costs are also starting to be observed in the housing market. An improvement in the housing market is often the first stage of a recovery process. Although investors have primarily driven recent price movements, Chart 1 shows building approvals are up, which will improve supply. All in all, we believe the risks of property prices dropping substantially in the short term are low, mitigating the negative flow-on effects to equities.

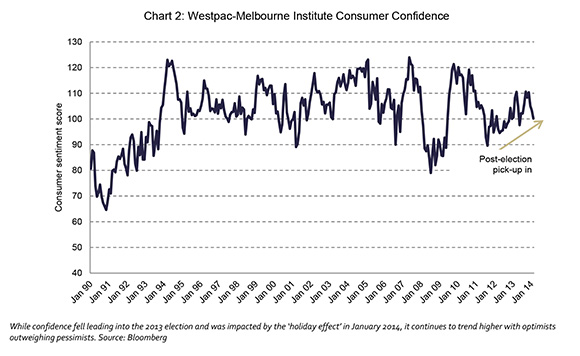
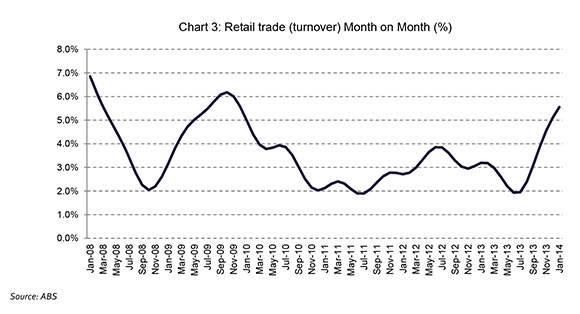
Consumer confidence is another leading indicator for equity market performance. As shown in Chart 2, consumer confidence has continued to trend upwards and personal balance sheets have been meaningfully repaired since the GFC. Growth in retail turnover improved over the last half of the calendar year (Chart 3), and the January 2014 retail sales number confirmed the continuation of this trend, rising by 1.2 percent.
Technical indicators
There are several technical indicators that also support our bull market thesis. The most obvious is the recent flurry of Initial Public Offerings (IPOs).
A total of 49 companies listed on the ASX in 2013, compared to 46 in 2012. While the number of additional IPOs was slight, and even down on 2011, the amount raised from these new listings was just over $8.5 billion, compared to an average of $2.3 billion for the past five years1. The issuance was also diverse by sector, suggesting broader market strength.
Firms prefer to issue new equity during bull markets, as there is a greater chance of being successful and valuations tend to be higher. 2014 has started with a strong pipeline of IPOs which is expected to continue throughout the year.
An increase in IPO activity is often a precursor to merger and acquisition (M&A) activity. Early M&A signs were present in 2013, including the examples of Wesfarmers’ sale of its insurance business to IAG and Westpac’s purchase of Lloyds’ Australian operations. As the bull market gains momentum, we expect M&A activity to pick up.
As Chart 4 shows, until six months ago the market had been caught in a four-year technical trading range. The recent break-out is positive, but will need to be supported by increased volume and improved earnings expectations to be the start of something bigger.
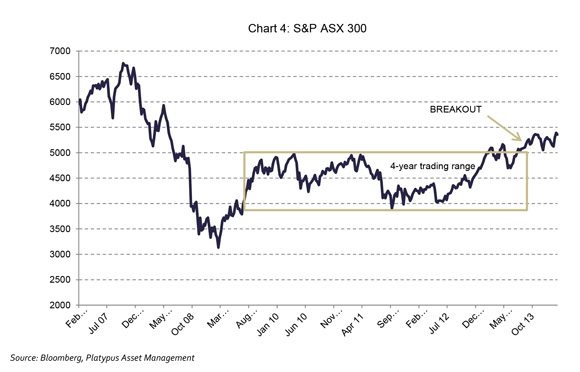
While volumes are still modest, there is mounting evidence the market is beginning to pay for earnings growth.
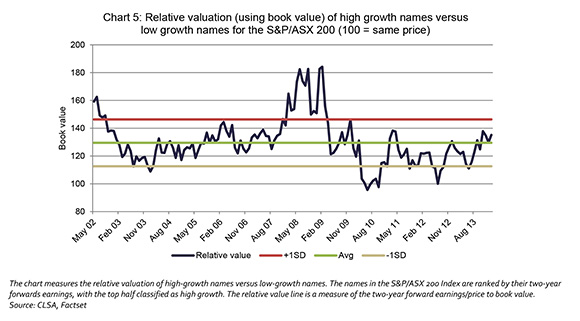
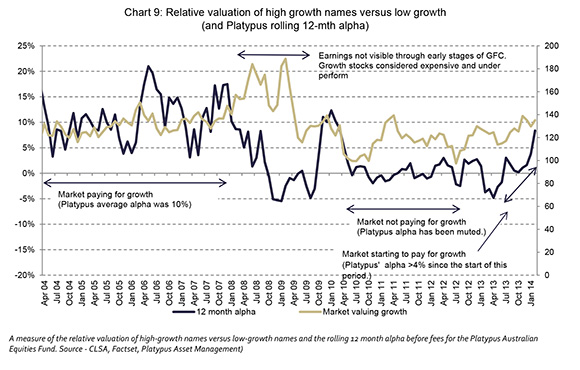
Chart 5 shows the relative value of high growth names versus low growth names. Since mid-2013, the market has begun to pay more for high growth names. Given the strong fundamental outlook, we expect the market will continue to pay for growth—however, this growth will need to be supported by robust earnings so it will be important to be positioned in high-quality, growth names.
Return expectations
The strong return from the Australian equities market over the past year leads to the question: if the improved fundamentals of low interest rates, a low currency, and an improved building cycle will support Australian equities in 2014, how much is already priced in?
Two data points lead us to believe Australian equities present good value for investors. The first is the market yield compared to the cash rate (Chart 6), and the second is the improvement in company earnings.
Yield stocks have done very well in 2013, but indiscriminately owning the market as a whole still gives investors a better yield than cash. From a long-term perspective, an investor is being paid to hold equities at these levels.
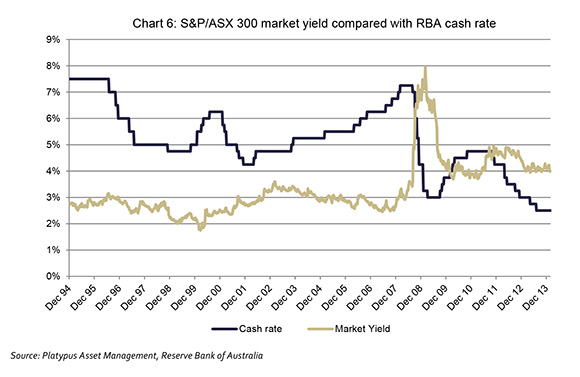
With market yields continuing to be attractive when compared to the prevailing cash rate, we believe the yield trade still has some time to run, particularly thanks to the additional benefit of franking imputation credits.
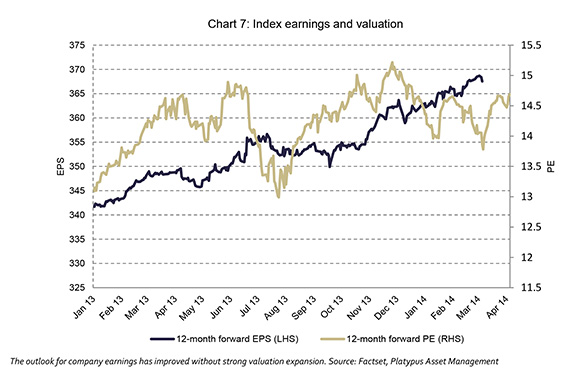
In addition, company earnings are steadily improving without large valuation expansion.
The average forward price-to-earnings ratio (P/E) of the market since the early 1990s is 14.4 times, and at 28 February 2014 the market was trading on 14.5 times. This is not expensive by any means, especially in context of the current expected earnings environment. As shown in Chart 7, company earnings have been improving without strong valuation expansion.
The recent reporting season saw the market move from a little over 5100 to just over 5400 in a three-week period, taking many bears by surprise.
While pauses, such as that experienced in January 2014, are a part of any healthy bull market, the structure of the pullback was still supportive of our thesis. The correction was led by larger capitalisation stocks, with sentiment holding up for smaller capitalisation names. This implies investors were happy to hold smaller stocks in the lead-up to reporting season, demonstrating some comfort in expectations.
Chart 8 shows, following the recent reporting season, forward earnings estimates for the market have continued to grind higher. While the improvement in earnings expectations still appears modest in absolute terms, the relative turnaround in expectations shows a marked improvement.
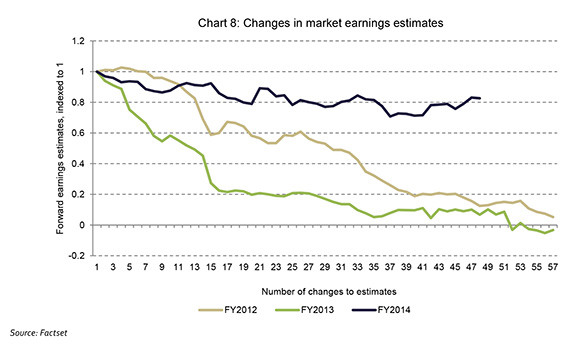
Our view is that forward earnings conditions are improving and the market will likely grow earnings by low double digits in FY2014. This is a reflection of the positive macro environment for company earnings, particularly the double impact of a lower currency and low interest rates.
We have been here before
The long-term investment capability of Platypus Asset Management has been proven across varying market conditions. However, the purple patch for our process is during quality-led bull markets.
 It is our strong belief that the current market environment is primed to reward investors that focus on quality and growth, two of Platypus’ core competencies. Our portfolio is well positioned to take advantage of a bull market, and importantly, we have a proven capability of delivering in these market conditions.
By Donald Williams, Chief Investment Officer, Platypus Asset Management
—————————
1 PO Watch, The market for emerging companies, January 2014, HLB Mann Judd Australasian Associates.
2 As at 27 February 2014. Flagship portfolio is the Platypus Australian Equities Fund. Returns are calculated before fees and expenses. Past performance is not a reliable indicator of future performance. Alpha/outperformance is a measure of performance on a risk-adjusted basis. Alpha/outperformance takes the volatility (price risk) of a fund and compares its risk-adjusted performance to a benchmark index. The excess return of the fund relative to the return of the benchmark index is a fund’s alpha/outperformance.


