
In this article we explore why a protective overlay is important to your equities portfolio, and in particular why the type of overlay is also a significant factor.
After enduring the Global Financial Crisis (GFC), investors around the world reflected on the lessons learnt and started asking how they could better protect their portfolio should such a catastrophic event reoccur.
It is commonly accepted that any time out of the market will likely reduce portfolio returns. This is partly true as the market tends to go up in the long run, and an allocation to cash erodes the portfolio performance in a rising market. The age-old adage of “time in” versus “timing” the market still rings true today. But avoiding downturns and preserving capital will always create a better long term investment outcome, due to the effects of compounding.
The rising need for both portfolio protection and maintaining market participation has prompted investors to look at different types of protective portfolio overlays. Here, we compare two main types of overlays – futures or options based. We look at how they perform in different market scenarios, and which one suits investors’ needs best.
Why the type of overlay is important: Options or Futures?
Futures definition: Agreement to buy or sell a specified asset, at a future date, at an agreed price. Futures are a type of derivative.
Options definition: A contract which gives the buyer the right, but not the obligation, to buy or sell an underlying asset at a specified price on or before a specified date. Options are a type of derivative.
The goals for both futures and options overlay strategies are often similar:
- To maximise the return of your portfolio in all market scenarios;
- To limit portfolio losses in falling markets; and
- To reduce the volatility of the overall portfolio.
Before selecting a particular overlay strategy, investors must understand the pay off profile of the overlay, and how the overlay performs under different market scenarios. Options and futures overlays differ significantly in terms of the extent of protection, as well as the flexibility of protection.
Cost is another major differentiating factor when selecting between options-based and futures-based overlay. An option has an initial cost, whilst a futures contract has an opportunity cost.
What is an options overlay?
Specifically, a protective options overlay is a dynamic strategy that aims to reduce the impact of market falls on portfolio value. Strategies that utilise options act much like an insurance policy. The purchaser pays a premium to protect against a potential loss. A portfolio manager can employ different combinations of options to construct a bespoke protective overlay that suits each investment fund’s risk profile.
A put option pay off profile is asymmetric. This is the key difference between options and futures; protecting the downside and preserving the upside at the same time. Below is a simple put option payoff diagram.
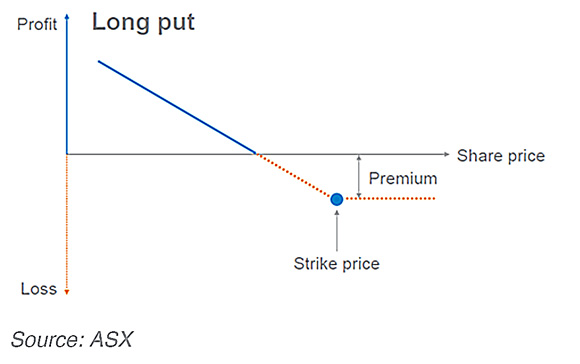
In constructing an option portfolio, using either index or single stock options, a portfolio manager can create a payoff profile to suit an investors’ desire for upside participation and downside protection.
What is a futures overlay?
A futures overlay is a protection strategy that aims to reduce the impact of market drawdowns on investor capital.
The most important attribute of a futures strategy is that it has a symmetric payoff profile, as demonstrated in the diagram below.
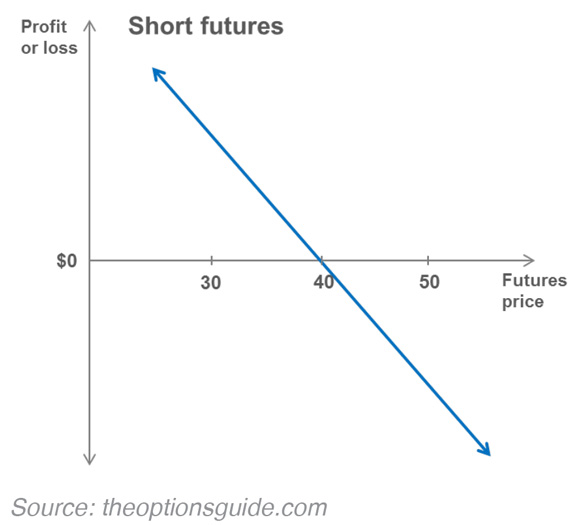
Being symmetric in nature, it means that futures only offer investors a binary outcome i.e. equal amount of upside and downside risk. This is in contrast to a long options position, where downside risk is limited to the option premium paid, like an insurance policy.
It can be argued that a futures overlay is essentially an asset allocation tool. A futures overlay is managed in either a “risk-on” or “risk off” fashion, where the manager will move away from the risky asset and effectively increase cash exposure by selling futures.
One type of futures overlay acts as a volatility-targeting strategy. In a volatility-targeting strategy, as market volatility rises to around its long run average level, the futures overlay algorithm signals this as stress building in the system and decreases exposure to the market by selling futures. This sell decision will end up being either correct, or incorrect; i.e. if markets fall, the protection decision is correct. However if markets continue to rise, this decision is incorrect and costs any additional portfolio performance that would have been gained.
What is the difference between the overlays?
A futures overlay is a market timing device, while an option overlay is a risk management tool.
There are times where both options and futures overlays work similarly. In falling markets, both strategies will limit the effect of a falling market to varying degrees.
However, the main difference is that options have convexity (i.e. gamma) whereas futures do not. As markets fall, options increase in their effectiveness of cushioning downturns, whereas a futures exposure will remain constant. In a rising market, a put option will become less impactful on a portfolio exposure, such that the portfolio can increasingly participate; a futures contract will retain the effective short weighting. An options overlay will not penalise investors to the same extent for misjudging the market direction. The most investors can lose is the option premium.
Further, a futures overlay should not be treated as a hedge. While the strategy can provide an offset in dislocated markets, on the whole they are non-correlated. A futures overlay also requires a certain amount of time to sell futures. This makes them vulnerable to rapid reversals or the sudden onset of volatility. An options overlay is strongly negatively correlated to the underlying asset. It does not rely on market timing, thereby providing constant, definable protection. It is therefore a better hedge.
Effective exposure
The effective exposure of a portfolio is the amount of the portfolio exposed to the risky asset (in this example the ASX 200).
Below is an example of the differences between the effective exposure of a futures and options overlay strategy between 2008 and 2014. The ASX 200 is the green line and indicates its total return over this time period. The red line shows the option overlay’s effective exposure and the blue line the futures overlay effective exposure with a volatility target.
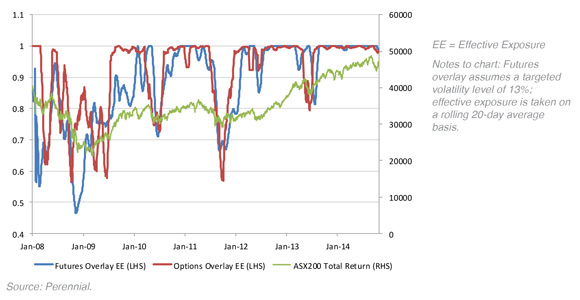
Negative market: e.g. January 2008 – March 2009: The ASX 200 is falling rapidly. Both futures and options overlay strategies are decreasing their effective exposure as the market falls. The key here is that the effective exposure change of the options is happening organically. That is to say, the delta of the put options is increasing as the market falls. The futures overlay effective exposure is decreasing because the strategy is selling futures. Most of the time the futures strategy is selling low when volatility spikes, and buying high as volatility subsides. Intuitively, this is not the ideal way to enhance portfolio return.
Positive market: e.g. March 2009 – March 2010: The ASX 200 line is moving upwards throughout this period. We can see a volatility targeted futures overlay (blue line) is not as quick to increase its effective exposure.
Flat/Sideways market: e.g. March 2010 – December 2012. The ASX 200 is flat but relatively volatile over the time period. Futures effective exposure (blue line) is more volatile than that of the options overlay (red line). The options strategy is adding more value as the overshoots are less frequent and effective exposure is changing without the buying or selling of assets.
Expected return profile
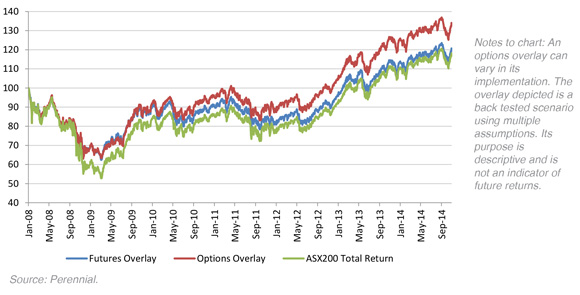
The chart below outlines the differences between the futures and options strategies against market returns. You can see what the volatility in the futures strategy (blue line) can do to a portfolio’s returns over time – by design it does not participate fully in market rallies. This erodes any positive performance during market declines and tends to limit your portfolio to a market like return over the long run.
In contrast, the options overlay (red line) provides a more stable return on your portfolio, enabling you to lock in the gains achieved in down markets and utilise these in a compounding effect when markets are positive.
Risk adjusted return
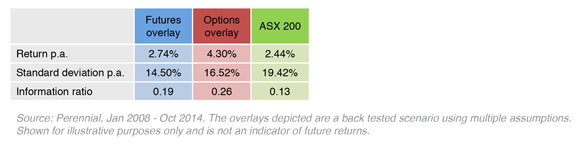
The table below shows the options overlay has the highest risk-adjusted return (i.e. information ratio), compared to the futures overlay and ASX 200 with no overlay.
The overall portfolio volatility of the options overlay is slightly higher than the futures overlay, however the return per annum is more than 1.5 times as much, therefore the information ratio is significantly higher than the futures overlay, and is twice that of the ASX 200.

Conclusion
The goal of both options and futures overlay strategies is to protect a portfolio in a falling market. This can be achieved using both approaches. However, we have found that a futures overlay pays for this protection by sacrificing participation in a rally, and long term returns tend to revert to market returns. Further, the futures overlay strategy is not correlated to the market, so its protection is uncertain and cannot safely be considered a hedge.
On the other hand, due to its asymmetric payoff profile and convexity, an options overlay strategy gives investors the ability to add value through active and dynamic hedging. The risk profile over time is improved significantly by reducing the downside volatility, and the upside returns can be preserved.
In conclusion, we believe constructing a protective overlay using liquid, exchange-traded options is the safer and more efficient way to manage portfolio risk.
Dan Bosscher, Portfolio Manager, Perennial Value Management
———-


