
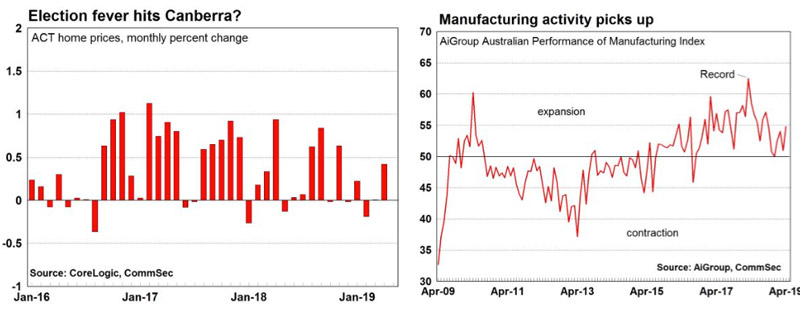
Election fever boosts Canberra property? Manufacturing activity hits 8-month high
02
May
2019
From CommSec Research
Home prices; Manufacturing
- Home prices: The CoreLogic Home Value Index of national home prices fell by 0.49 per cent in April – the smallest decline since September – to be down 7.2 per cent over the year. Prices fell in all capital cities except Canberra (up by 0.4 per cent). Regional prices fell by 0.3 per cent.
- Shares outperform residential property: Total returns on national dwellings fell by 3.6 per cent in the year to April with houses down by 4.2 per cent on a year earlier and units were down by 1.9 per cent. In contrast, the S&P/ASX All Ordinaries Accumulation Index lifted by 10.2 per cent over the year to April.
- Manufacturing sector: The Australian Industry Group Australian Performance of Manufacturing Index rose by 3.8 points to 8-month highs of 54.8 points in April. The ‘final’ CBA Manufacturing Purchasing Managers’ Index (PMI) declined by 1.1 points to 50.9 points. Any reading over 50 indicates expansion.
Home price data is important for retailers, especially those focussed on consumer durables. The manufacturing data provides guidance for companies in the Industrials sector.
What does it all mean?
- National home prices continued to decline in April, albeit at the slowest rate since September last year. The property downturn in Sydney and Melbourne appears to be easing. That said, housing activity may have been distorted by the extended school, Easter and Anzac Day holiday period.
- With federal election fever gripping the country perhaps shrewd property buyers see the nation’s capital as a potential beneficiary of change in government, or in fact a bigger government? Canberra saw a decent 0.4 per cent gain in home prices in April and previous monthly price movements have been relatively stable when compared to other larger capital cities. The 2018 OECD Regional Well-being Study ranked the ACT as the world’s most liveable region. Public sector job creation has been solid.
- The ACT economy is in good shape at the moment. Economic growth, as measured by State Final Demand, grew by 5 per cent over the year to December, supported by solid population growth near 2 per cent per annum. The annual growth rate in retail spending was up by a healthy 4.3 per cent in March. And the jobless rate is the lowest in the nation at 3.6 per cent.
- And home building and the purchase of homes is nation- leading when compared to the decade average. The ACT government is investing almost $3 billion in infrastructure projects over the next four years.
- With the Aussie sharemarket hitting 11-year highs in April, total returns for shares continue to exceed returns on residential property, which are near decade lows. If you include dividends, the S&P/ASX All Ordinaries Accumulation Index increased by 10.2 per cent over the year to April, outperforming total returns for national dwellings, which were down by 3.6 per cent.
- While there will be some anxiety around the possible impact of slowing home prices on household spending and the ‘wealth effect’, the rebound in sharemarkets so far in 2019 could potentially support consumer sentiment together with tax cuts.
- The rebound in global manufacturing activity is welcome after a ‘soft patch’ in late 2018. The AiGroup’s measure of Aussie factory activity was the strongest since September. Pleasingly, six of the seven underlying activity indexes, including production, new orders, deliveries, exports, sales and employment, all expanded in April. Importantly, the CBA survey said that “business confidence remained positive in April”, potentially signalling a further improvement in conditions.
What do the figures show?
Home prices
- The CoreLogic Home Value Index of national home prices fell by 0.49 per cent in April – the smallest decline since September – to be down 7.2 per cent over the year. Prices fell in all capital cities except Canberra (up by 0.4 per cent). Regional prices fell by 0.3 per cent (down 2.6 per cent on the year).
- In capital cities, prices fell by 0.5 per cent to be down 8.4 per cent over the year to April. House prices fell by 0.6 per cent and apartment prices fell by 0.5 per cent. House prices were down 9.1 per cent on a year ago and apartments were down by 6.6 per cent.
- In regional areas, house prices fell by 0.3 per cent and apartment prices fell 0.5 per cent in April to be down 2.8 per cent and 2.2 per cent respectively on the year.
- The average Australian capital city house price (median price) was $628,587 and the average unit price was $526,813 in April.
- Dwelling prices fell in seven of the eight capital cities in April. Home prices fell in Darwin (down 1.2 per cent), Hobart (down 0.9 per cent), Sydney (down 0.7 per cent), Melbourne (down 0.6 per cent), Brisbane and Perth (both down 0.4 per cent), and Adelaide (down 0.1 per cent). But prices rose in Canberra by 0.4 per cent.
- Home prices were lower than a year ago in five of the eight capital cities in April. Prices fell by the most in Sydney (down 10.9 per cent); Melbourne (down 10.0 per cent); Perth (down 8.3 per cent); Darwin (down by 7.1 per cent) and Brisbane (down 1.9 per cent). But prices are still positive in Hobart (up 3.8 per cent), Canberra (up 2.5 per cent) and Adelaide (up 0.3 per cent).
- Total returns on national dwellings fell by 3.6 per cent in the year to April with houses down by 4.2 per cent on a year earlier and units were down by 1.9 per cent. In contrast, the S&P/ASX All Ordinaries Accumulation Index lifted by 10.2 per cent over the year to April.
Manufacturing Purchasing Managers’ Indexes
- The Australian Industry Group (AiGroup) Australian Performance of Manufacturing Index rose by 3.8 points to 8-month highs of 54.8 points in April. The ‘final’ CBA Manufacturing Purchasing Managers’ Index (PMI) declined by 1.1 points to 50.9 points. Any reading over 50 indicates expansion.
- According to AiGroup, “Manufacturers in the food and beverages sector reported higher than usual demand for this time of year (June quarter is typically slower for this sector), although their input prices did rise in April. The current range for the Australian dollar is supporting export orders. Infrastructure projects, particularly in NSW and Victoria, are supporting demand for machinery and equipment and metals products, but overall activity levels in these sectors remains relatively weak.”
- According to CBA/Markit, “The slowdown in Australia’s manufacturing sector gained momentum at the start of the second quarter. The headline index sank to its lowest level in the three-year survey history, dragged down by lower output and markedly slower order book growth. Employment was stagnant, while firms cut back on purchasing activity for the first time since the series inception. Cost pressures intensified and business confidence was the second-lowest on record.”
What is the importance of the economic data?
- The CoreLogic Hedonic Australian Home Value Index is based on Australia’s biggest property database. Unlike the ABS Index, which excludes terraces, semi-detached homes and apartments, the CoreLogic Hedonic Index includes all properties. Home prices are an important driver of wealth and spending.
- The AiGroup and CBA Purchasing Manager indexes (PMIs) for services and manufacturing are released each month. The Australian PMIs are the local equivalents of similar indexes released for other countries. The PMIs are amongst timeliest economic indicators released in Australia. The PMIs are useful not just in showing how the sectors are performing but in providing some sense about where they are heading. The key ‘forward looking’ components are orders and employment.
What are the implications for interest rates and investors?
- The housing market continues to gradually rebalance. Home prices declined in April, but the rate of deceleration in prices was the slowest in eight months. In fact, the three-month rolling average Sydney median house price lifted by $35,000 to $870,000 in April. That said, the decline in prices has spilled over into more regional cities, towns and suburbs. Further modest falls in home prices are expected.
- Tighter lending standards – specifically the availability of credit – are weighing on demand for home loans. Investor demand is also waning due to falling property prices and increased stamp duty for foreign buyers. Listings of homes for sale have increased.
- Prospective buyers may also be dissuaded from purchasing properties due to political uncertainty around the Labor Party’s proposed negative gearing policy and the upcoming Federal election. On the flip side, Canberra’s desirable quality of life and solid jobs market, supported by public infrastructure spending and broader government activity, are attracting more people to the nation’s capital, supporting the property market.
- First home buyers and renters are the ‘winners’ from the property downturn. Capital city rents are up by just 0.4 per cent over the year to April, led by falls in Sydney (down 3.1 per cent).
- With household disposable incomes under pressure and mortgage debt still elevated, Reserve Bank policymakers will hope that the upturn in sharemarkets continues, ‘cushioning the blow’ from the negative wealth effect of falling home prices.
- Consumer spending, proposed Federal Budget tax cuts and the strength of the labour market will determine the future direction of interest rates.
- All eyes will be on the Reserve Bank’s monetary policy statement on Tuesday to see whether an explicit easing bias is inserted into the commentary.
- CommSec doesn’t expect a change in the official cash rate in the foreseeable future, but the risks are still tilted to rate cuts.
Ryan Felsman, Senior Economist


