Figures released by SQM Research reveal national residential property listings increased in January by 2.2% from 288,966 in December 2019 to 295,295. Compared to 12 months ago, listings were down by 10.0%.
All capital cities experienced increases in property listings over the month with the largest increase in Sydney of 5.1%, followed closely by Hobart with 4.9% increase. Canberra had the smallest increase of 0.6% listings.
Year-on-year listings show declines for all capital cities with Sydney recording a significant decline of 24.8% and Darwin a 24.7% decline this time last year. However new listings (listings less than 30 days old) recorded a surge for the month and are higher than same levels recorded in January 2019.
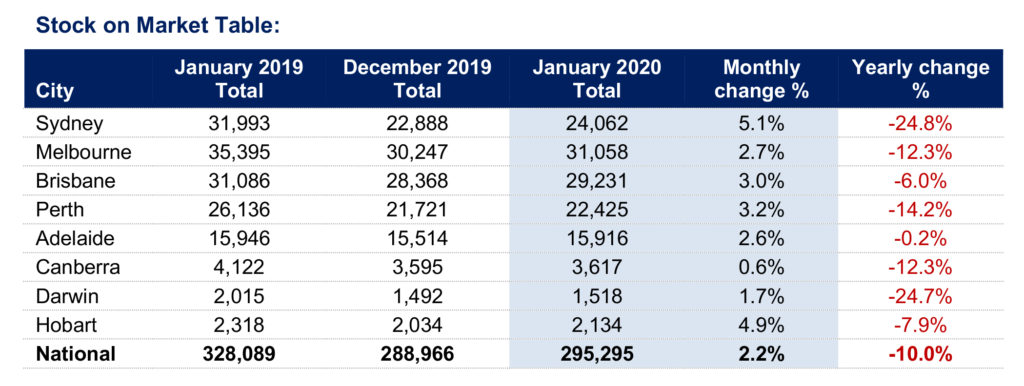
Louis Christopher, Managing Director of SQM Research said, “the month of January traditionally records small falls in properties listed for sale as the market is still in a summer holiday mode however, the positive start in new listings shows vendors are now keen to sell and we could see further increases in the coming months.”
Asking prices
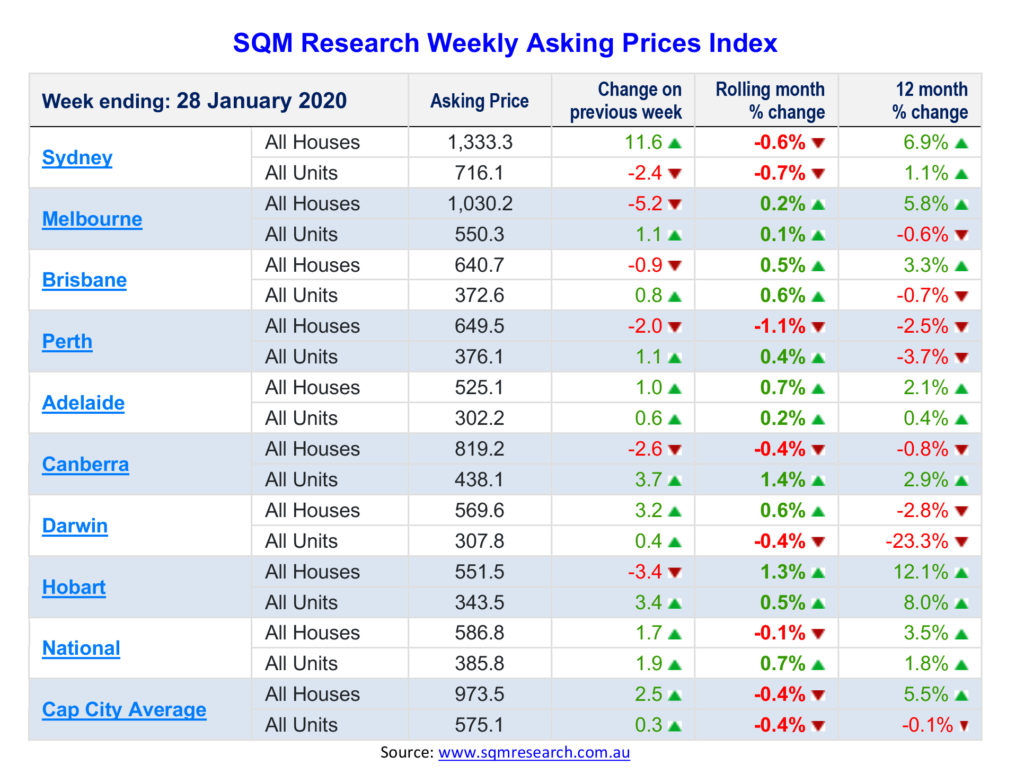
Capital City asking prices decreased by 0.4% for both houses and units, over the month to 28th January 2020. The year commenced with unit asking prices at $575,100 and houses $973,500.
Compared to a year ago, the capital city asking prices posted increases of 5.5% for houses but a 0.1% decline for units.
Over the month, Melbourne, Brisbane, Adelaide and Hobart recorded increases in both house and unit prices. Sydney was the only city to post declines in both, houses and units, 0.6% for houses and 0.7% for unit prices. Perth and Canberra recorded minor decreases in house prices of 1.1% for Perth and 0.4% for Canberra houses. Darwin house market has made a turnaround with increase of 0.6% in house prices however unit prices declined 0.4%.
Canberra had the strongest growth of 1.4% in the unit market whilst Hobart’s house prices had the strongest growth of 1.3%.
Key points
- National residential property listings increased in January by 2.2% from 288,966 in December 2019 to 295,295. Compared to 12 months ago, listings were down by 10.0%.
- All capital cities experienced increases in property sales listings over the month with the largest increase in Sydney of 5.1%, followed closely by Hobart with 4.9% increase.
- Capital City asking prices decreased by 0.4% for both houses and units, over the month to 28th January 2020. Unit asking prices are now $575,100 and houses $973,500.
- Compared to a year ago, the capital city asking prices posted increases of 5.5% for houses but a 0.1% decrease for units.


