Key points
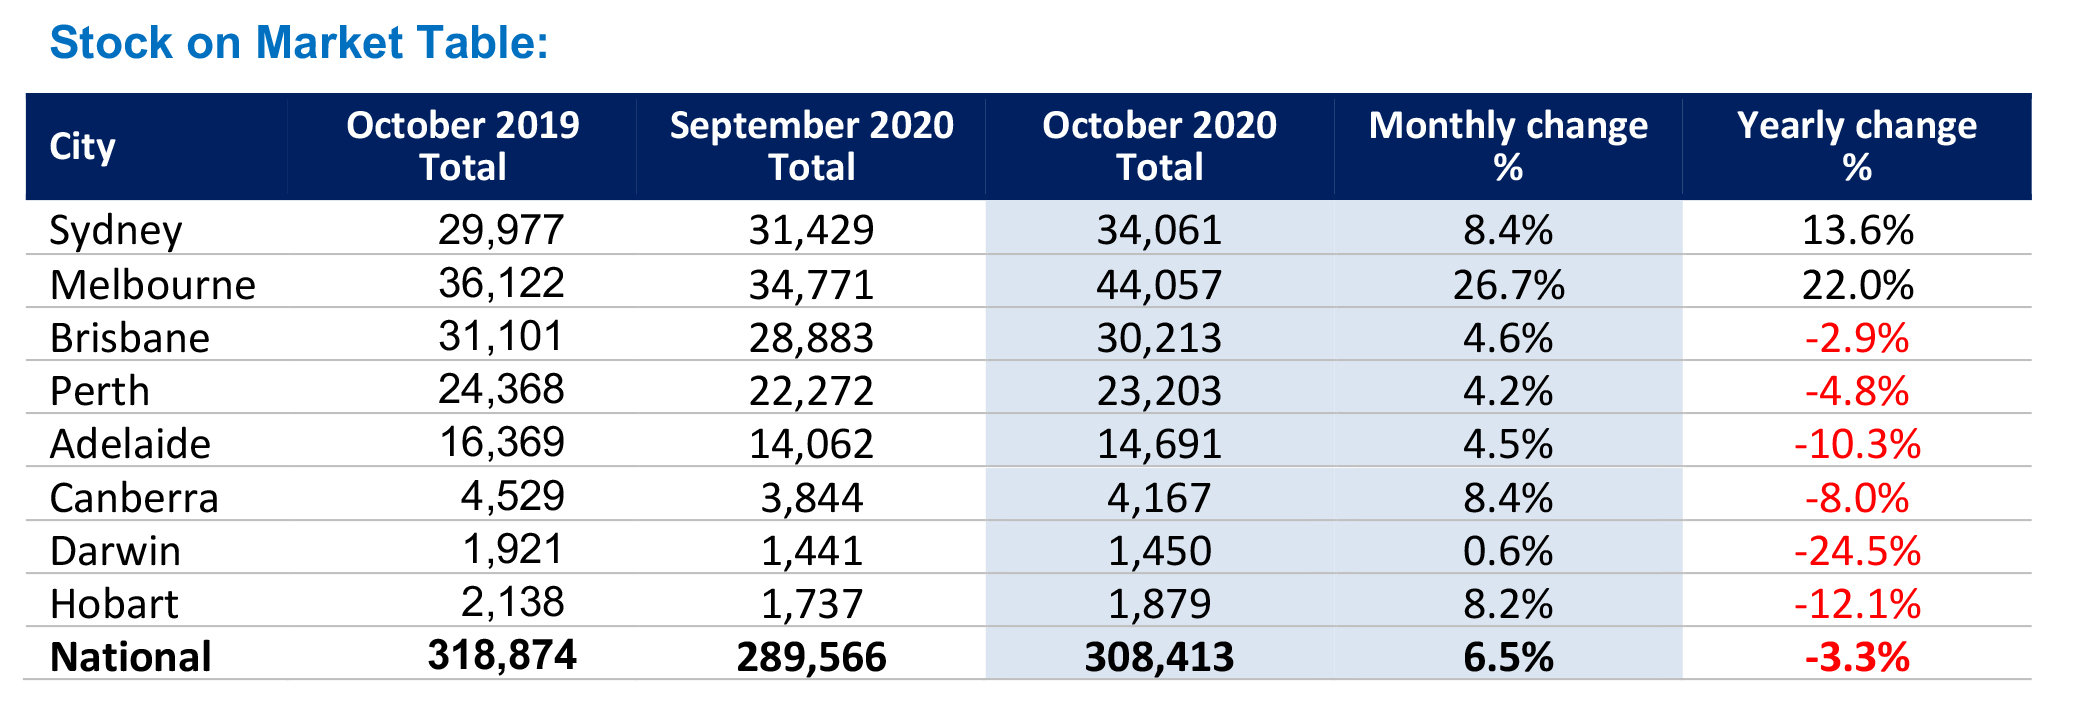
- National residential property listings increased in October by 6.5% from 289,566 listings in September 2020 to 308,413. Compared to 12 months ago, listings were down by 3.3%.
- All capital cities recorded increases in property listings over the month with Melbourne posting the highest increase of 26.7%.
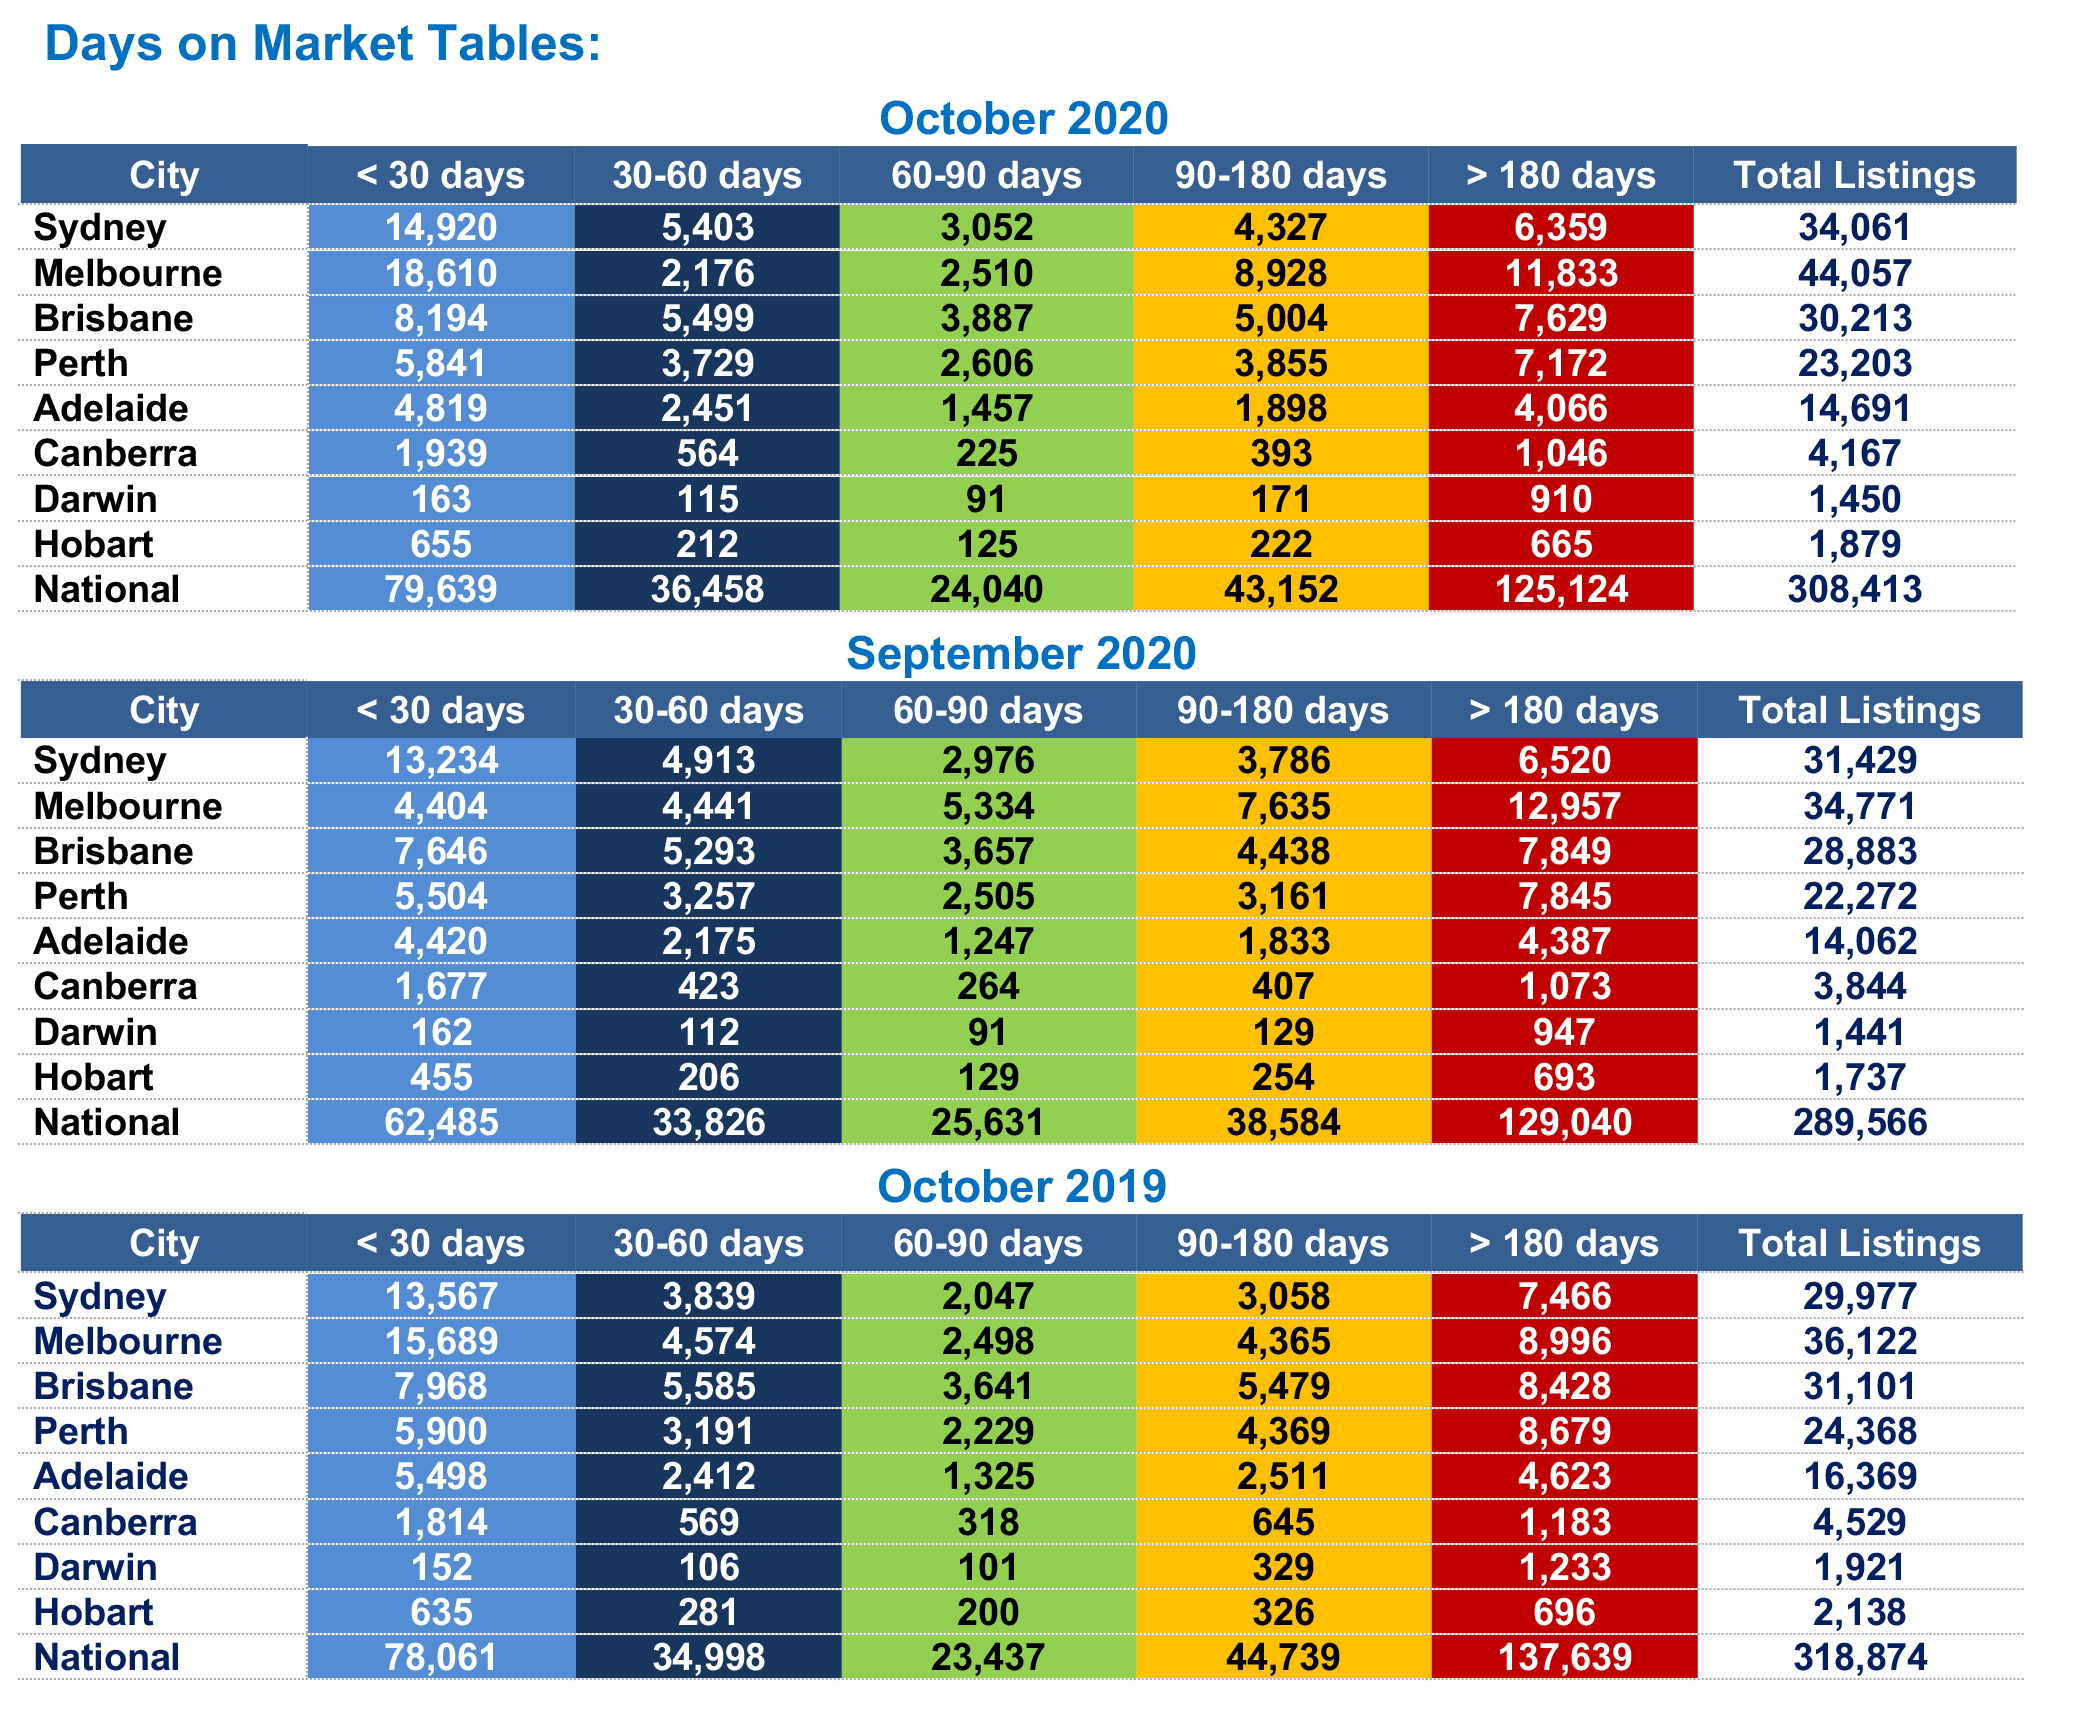
- Nationally New listings surged by a significant 27.45% in October with 17,154 more new properties listed for sale in the market.
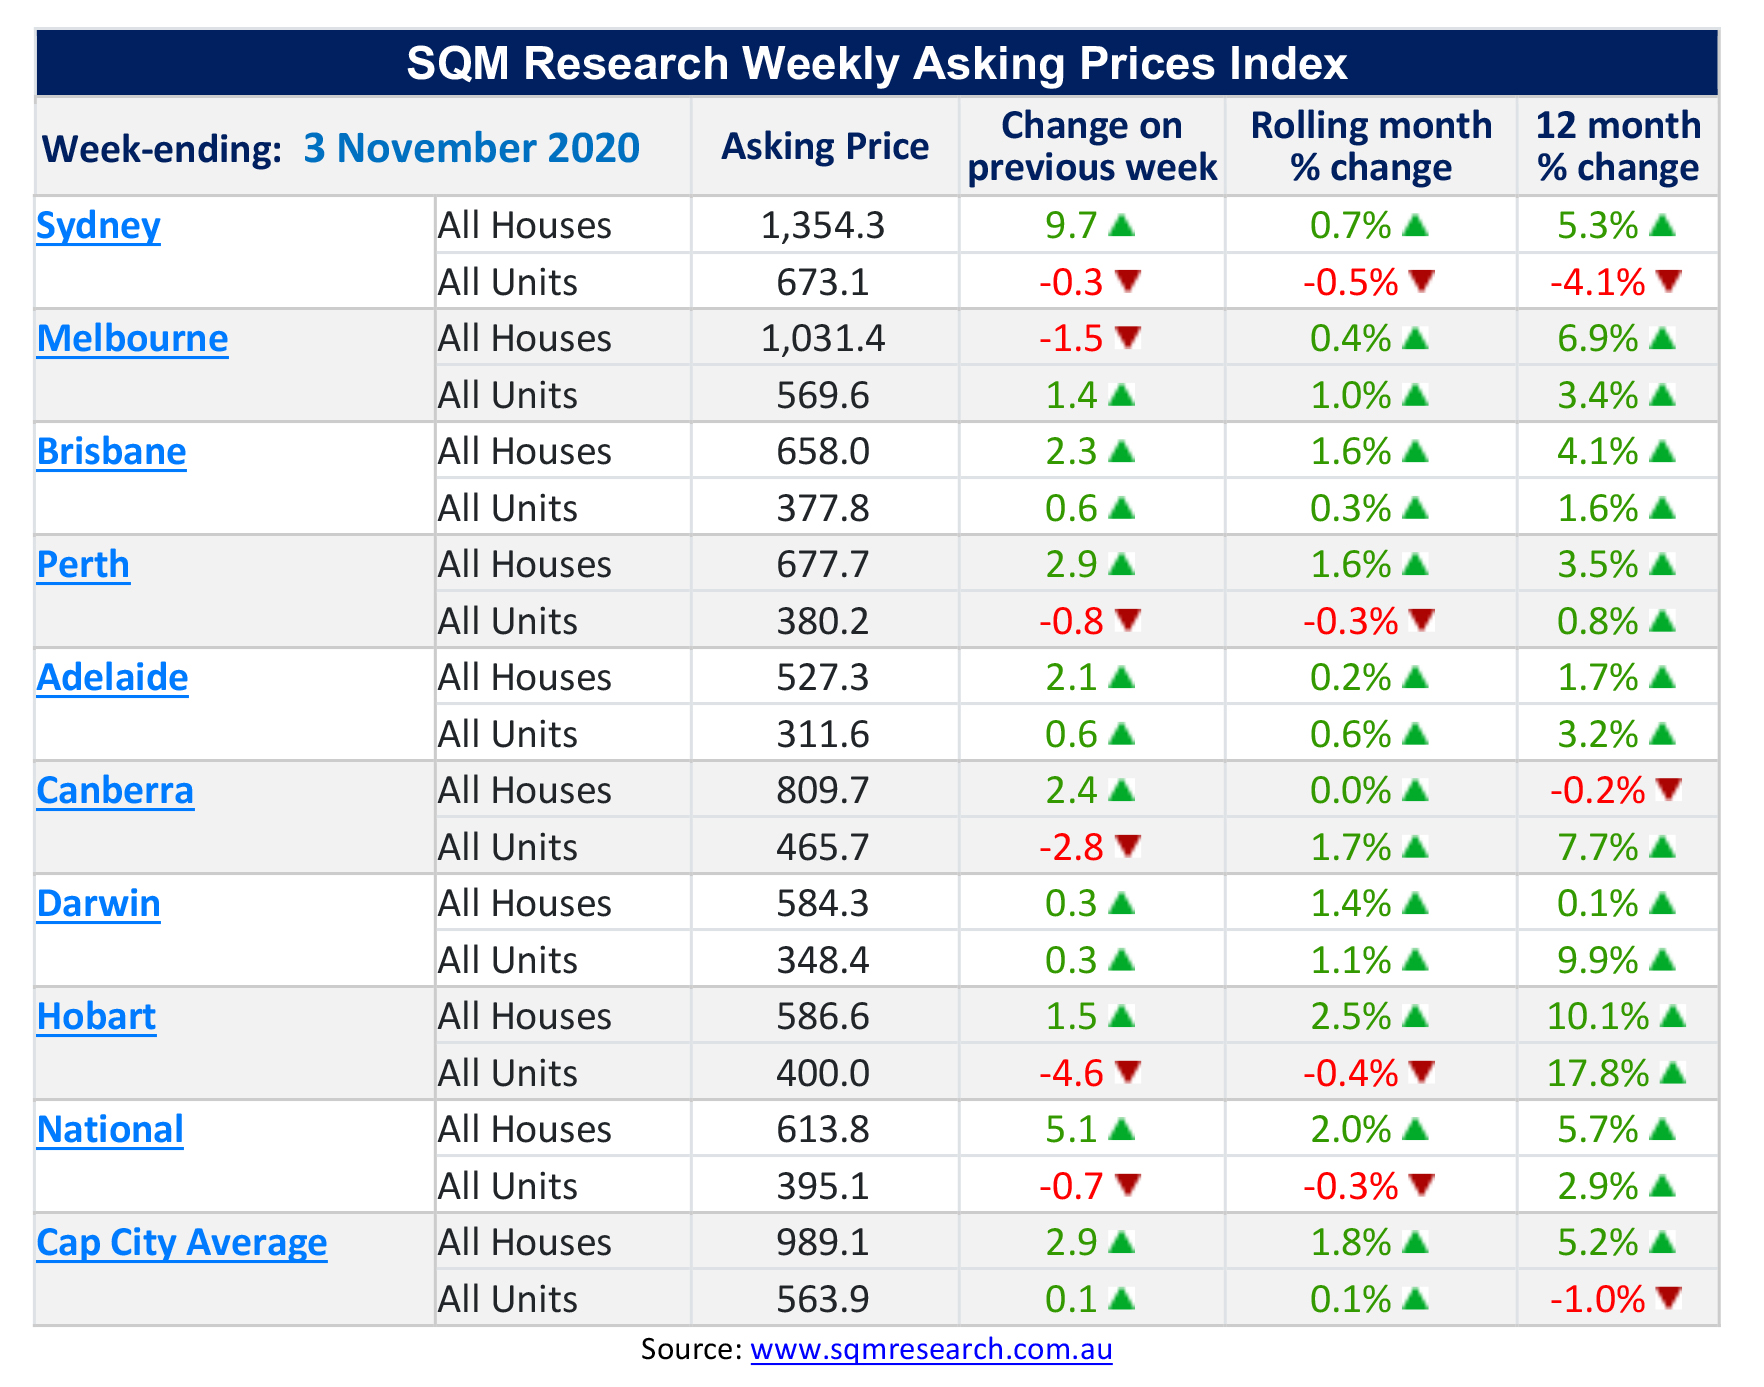
- Capital City Average asking prices increased 1.8% for houses and 0.1% for units over the month to 4 November. Average asking prices are now $563,900 for units and $989,100 for houses.
- Compared to a year ago, the capital city asking prices posted an increase of 5.2% for houses but declined by 1.0% for units.
Figures released yesterday by SQM Research reveal national residential property listings significantly increased in October by 6.5% from 289,566 listings in September 2020 to 308,413. Compared to 12 months ago, listings were also down by 3.3%.
All capital cities recorded increases in property listings over the month with Melbourne recording a huge increase of 26.7% – 9,286 more properties listed than September. Both Sydney and Canberra also posted large increases of 8.4% each and Hobart posted 8.2% increase.
Brisbane recorded a 4.6% increase, Adelaide 4.5% and Perth 4.2%. Darwin recorded the smallest increase of 0.6%.
National year-on-year listings reveal a decrease of 3.3% with significant decreases in Darwin (24.5%) and Hobart (12.1%). Melbourne however, recorded a large increase of 22.0% and Sydney a 13.6% increase. All other capital cities recorded declines over the 12 months.
New listings (30 days)
Nationally, new listings (30 days) increased by a significant 27.45% over the course of October with 17,154 more properties on the market. Melbourne posted a huge increase in new listings of 322.6%. Hobart posted a 44.0% increase, Canberra a 15.6% increase and Sydney a 12.7% increase in new listings.
Commentary
Louis Christopher, Managing Director of SQM Research said, “It seems like we are moving back to the usual spring selling season with all capital city listings rising in October. Melbourne in particular, has bounced back in a big way after the relaxing of Stage 4 restrictions. In fact, we are expecting another big rise in listings during the month of November for Melbourne.”
Asking prices
Capital City Average asking prices increased 1.8% for houses and 0.1% units over the month to 3rd November. Average unit asking prices are now $563,900 and houses $989,100.
Compared to a year ago, the capital city asking prices posted an increase of 5.2% for houses but declined by 1.0% for units.
Over the month, most capital cities recorded marginal asking price increases in houses and units. Sydney continues to record a decline in unit asking prices of 0.5% but recorded an increase of 0.7% for houses. Perth and Hobart also recorded declines in unit prices of 0.3% and 0.4%, respectively. Hobart however, posted the largest gain in house prices of 2.5%.
Melbourne, after the lifting of Covid-19 restrictions, is rebounding posting increases in both house asking prices of 0.4% and a 1.0% increase in units.
Canberra house asking prices remained stable and unit asking prices increased by 1.7%.
Year on year, most capital cities recorded increases in house and unit asking prices with a significant increase of 17.8% in Hobart’s unit asking price and 10.1% in house asking prices.
Sydney’s unit prices declined 4.1% over the 12 months but house prices increased 5.3%.