

Mano Mohankumar and Ian Fryer
Super funds had a strong October on the back of rallying global share markets. The median growth fund (61 to 80% in growth assets) made an impressive gain of 3% over the month, recouping September’s losses. The equities rebound has continued into November, and we estimate that the median growth fund is up a further 1.1% so far this month. Looking at the four-and-a-half months of the financial year to date, the cumulative gain is sitting at about 3.5%, which effectively erases the entire loss from last financial year.
Chant West Senior Investment Research Manager, Mano Mohankumar, says that while super funds’ investment portfolios are well-diversified, listed shares remain the main contributors to growth fund performance and that is what drove the strong returns in October. “Over the month, Australian shares surged 6% while international developed markets were even stronger, advancing 7.2% and 7.8% in hedged and unhedged terms, respectively. Emerging markets shares were a detractor, however, losing 2.6%. Bond markets were mixed, with Australian bonds up 0.9% but international bonds down 0.4%.
“Despite the challenging geopolitical and economic backdrop, if we take into account November to date, the median growth fund is more than 11% ahead of the pre-COVID high that was reached at the end of January 2020. This should be comforting for fund members. More importantly, funds are continuing to meet their long-term return and risk objectives.”
“In October, despite the US Federal Reserve reiterating that tight monetary policy is needed to fight inflation (subsequently raising interest rates by 0.75% in early November), the US share market rose. This was largely on the back of a strong company earnings reporting season and indications that global supply chain issues were easing. Subsequently, CPI data released in November suggests that US inflation may be cooling faster than expected, which has pushed markets higher so far this month.
“In the Eurozone, the European Central Bank raised rates aggressively by 0.75% as year-on-year inflation hit a record high. To combat the deepening energy crisis, the European Commission proposed new emergency regulations which include a cap on energy prices and joint gas purchasing by member states to negotiate better prices. In the UK, meanwhile, markets reacted positively to the appointment of Rishi Sunak as the new Prime Minister.
“Chinese equities fell sharply in October with Premier Xi Jinping being appointed leader for an historic third term. China’s continuing zero-COVID policy and ongoing property crisis also continued to weigh on market sentiment. Back home, the RBA increased the official cash rate by a lower than expected 0.25% as it attempts to control inflation while looking to avoid a hard landing.”
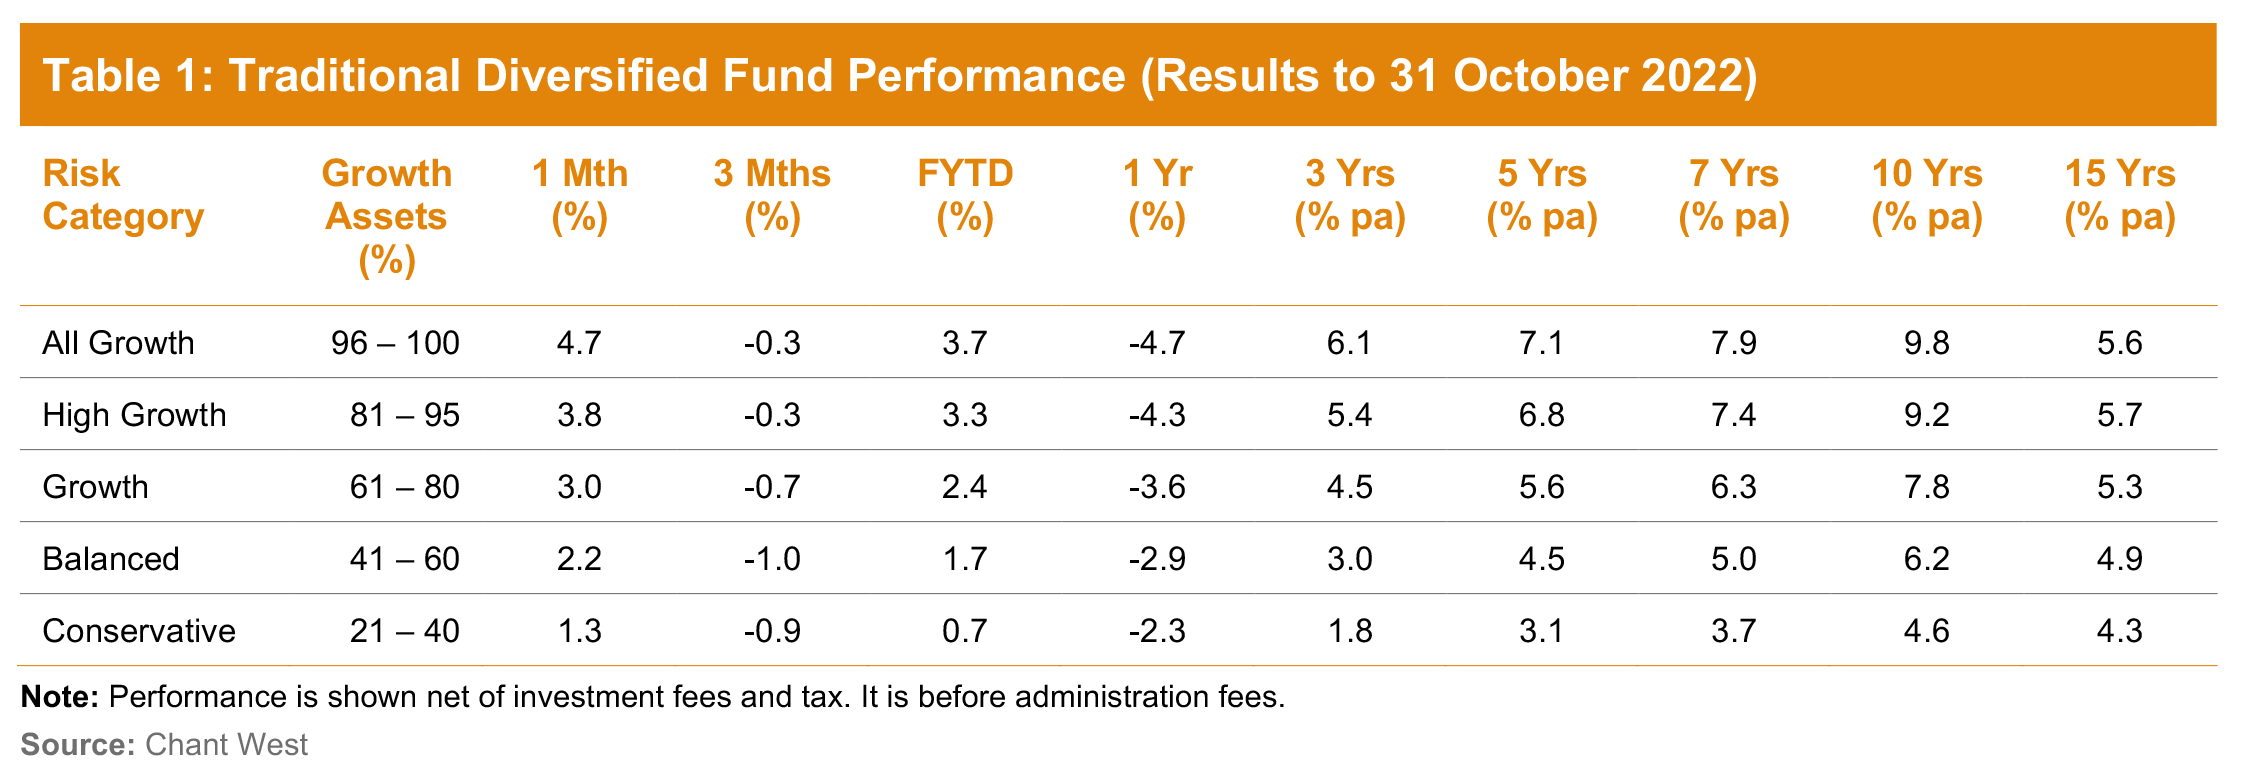
Table 1 compares the median performance to the end of October 2022 for each of the traditional diversified risk categories in Chant West’s Multi-Manager Survey, ranging from All Growth to Conservative. All risk categories have generally met their typical long-term return objectives, which range from CPI + 1.75% for Conservative funds to CPI + 4.25% for All Growth.
Lifecycle products behaving as expected
Mohankumar says that while the Growth category is still where most people have their super invested, a meaningful number are now in so-called ‘lifecycle’ products. “Most retail funds have adopted a lifecycle design for their MySuper defaults where members are allocated to an age-based option that’s progressively de-risked as that cohort gets older,” he says.
“It’s difficult to make direct comparisons of the performance of these age-based options with the traditional options that are based on a single risk category, and for that reason we report them separately. Table 2 shows the median performance for each of the retail age cohorts, together with their current median allocation to growth assets. For comparison purposes, it also includes a row for traditional MySuper Growth options – nearly all of which are not-for-profit funds. Care should be taken when comparing the performance of the retail lifecycle cohorts with the median MySuper Growth option, however, as they’re managed differently so their level of risk varies over time.”
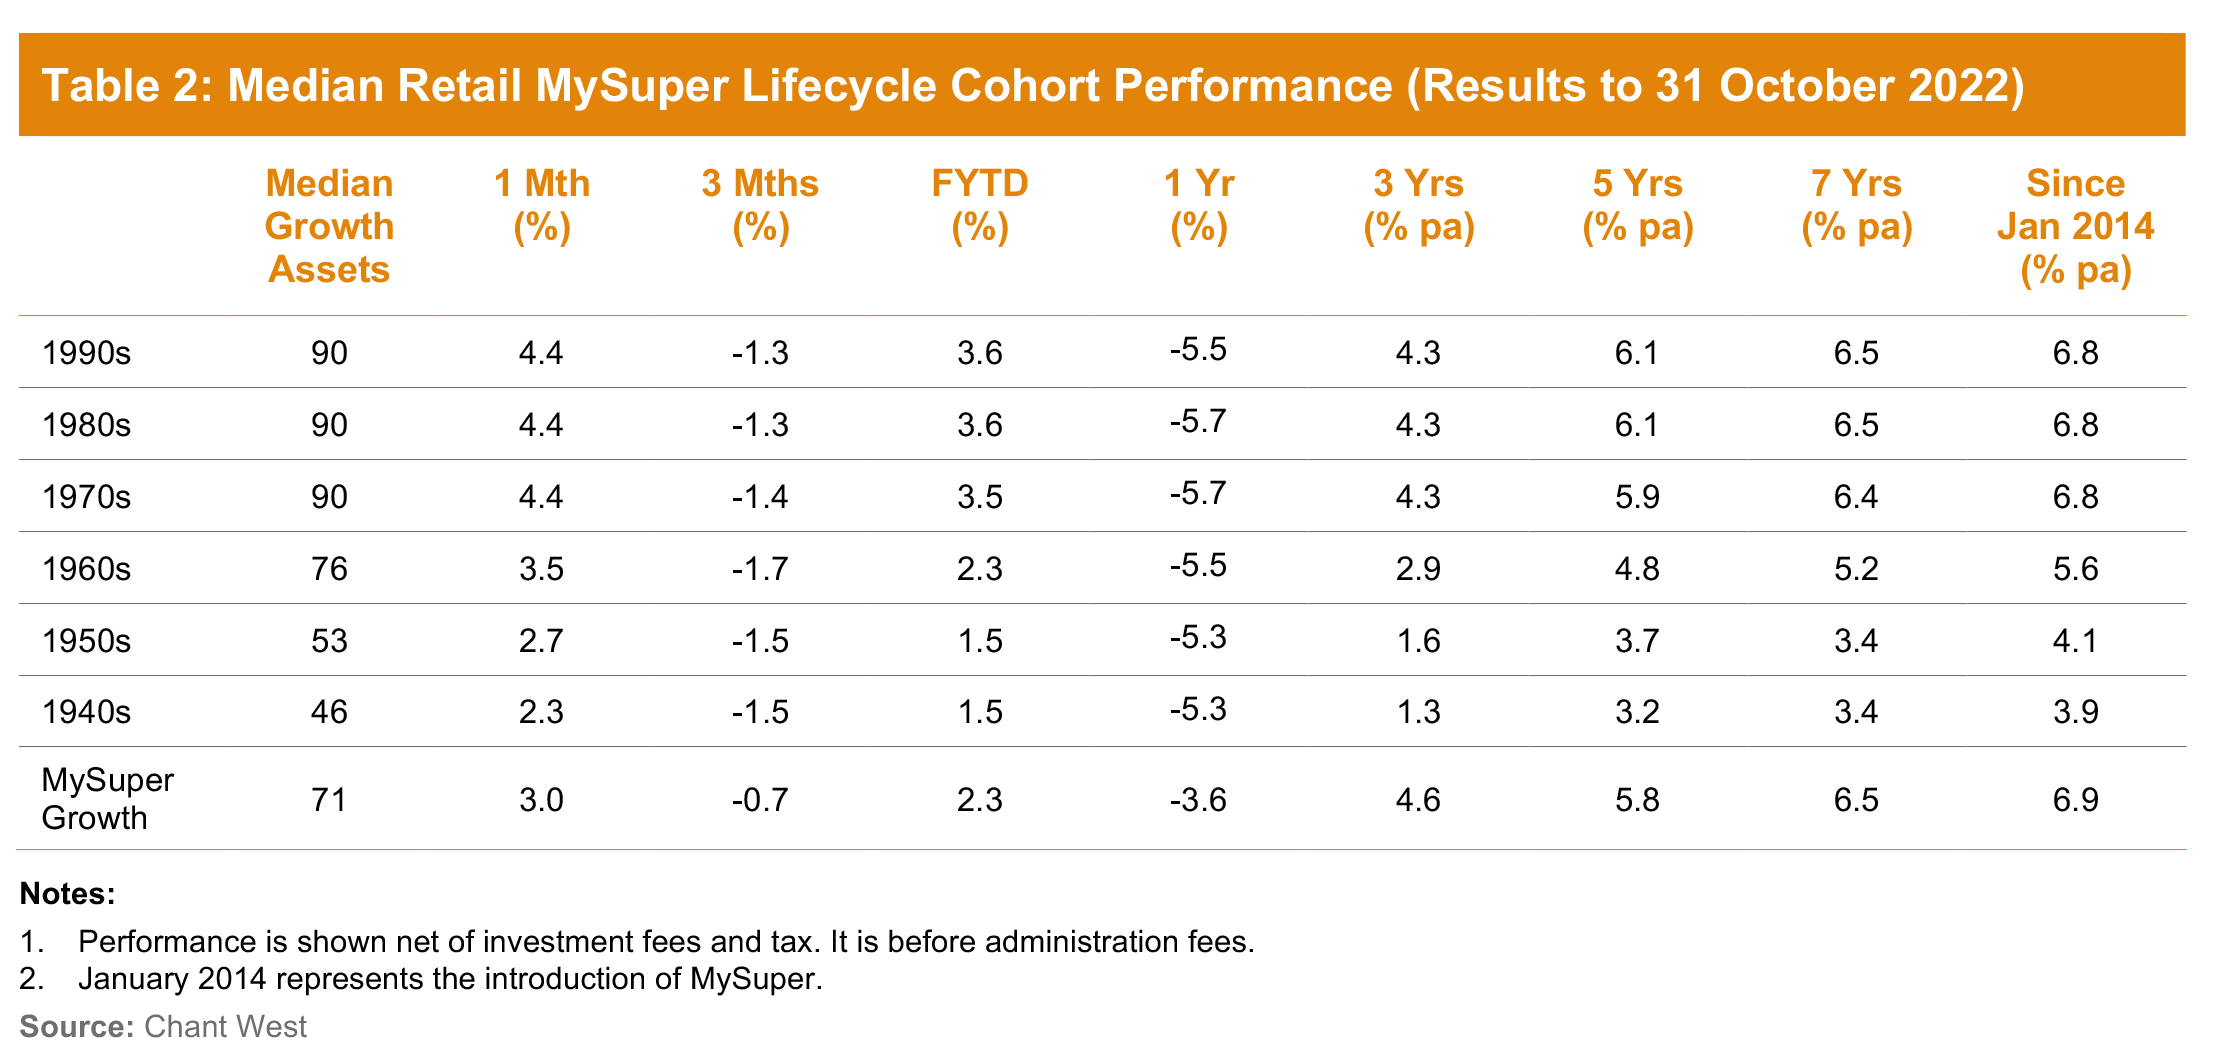
Despite the falls in global share markets so far in 2022, options that have higher allocations to growth assets have done better over most periods shown. Younger members of retail lifecycle products – those born in the 1970s, 1980s and 1990s – have held their own against the MySuper Growth median over the five-year period and longer. However, they’ve done so by taking on significantly more share market risk. On average, these younger cohorts have at least 20% more invested in listed shares and listed real assets than the typical MySuper Growth option.
The 1960s cohort has generally underperformed the median MySuper Growth option. This is partly due to a lower allocation to growth assets up until about two years ago, when lifecycle product providers revised their glide paths to delay the de-risking process until older ages. Another reason for this underperformance is a lower allocation to unlisted assets, which have performed well, and a higher allocation to traditional defensive asset sectors, such as bonds and cash, which have been the weakest performing sectors since the introduction of MySuper.
The oldest cohorts (those born in the 1950s or earlier) are relatively less exposed to growth assets, so you would expect them to underperform the MySuper Growth median over longer periods. Capital preservation is more important at those ages, so while they miss out on the full benefit in rising markets, older members in retail lifecycle options are generally better protected in the event of market weakness.
Long-term performance remains above target
MySuper products have only been operating for eight years, so when considering performance it’s important to remember that super is a much longer-term proposition. Since the introduction of compulsory super in July 1992, the median growth fund has returned 7.8% p.a. The annual CPI increase over the same period is 2.6%, giving a real return of 5.2% p.a. – well above the typical 3.5% target. Even looking at the past 20 years, which includes four major share market downturns – the ‘tech wreck’ in 2002-2003, the GFC in 2007-2009, COVID-19 in 2020 and the 2022 calendar year driven by high inflation and rising interest rates to combat it – super funds have returned 7.1% p.a., which is still comfortably ahead of the typical objective.
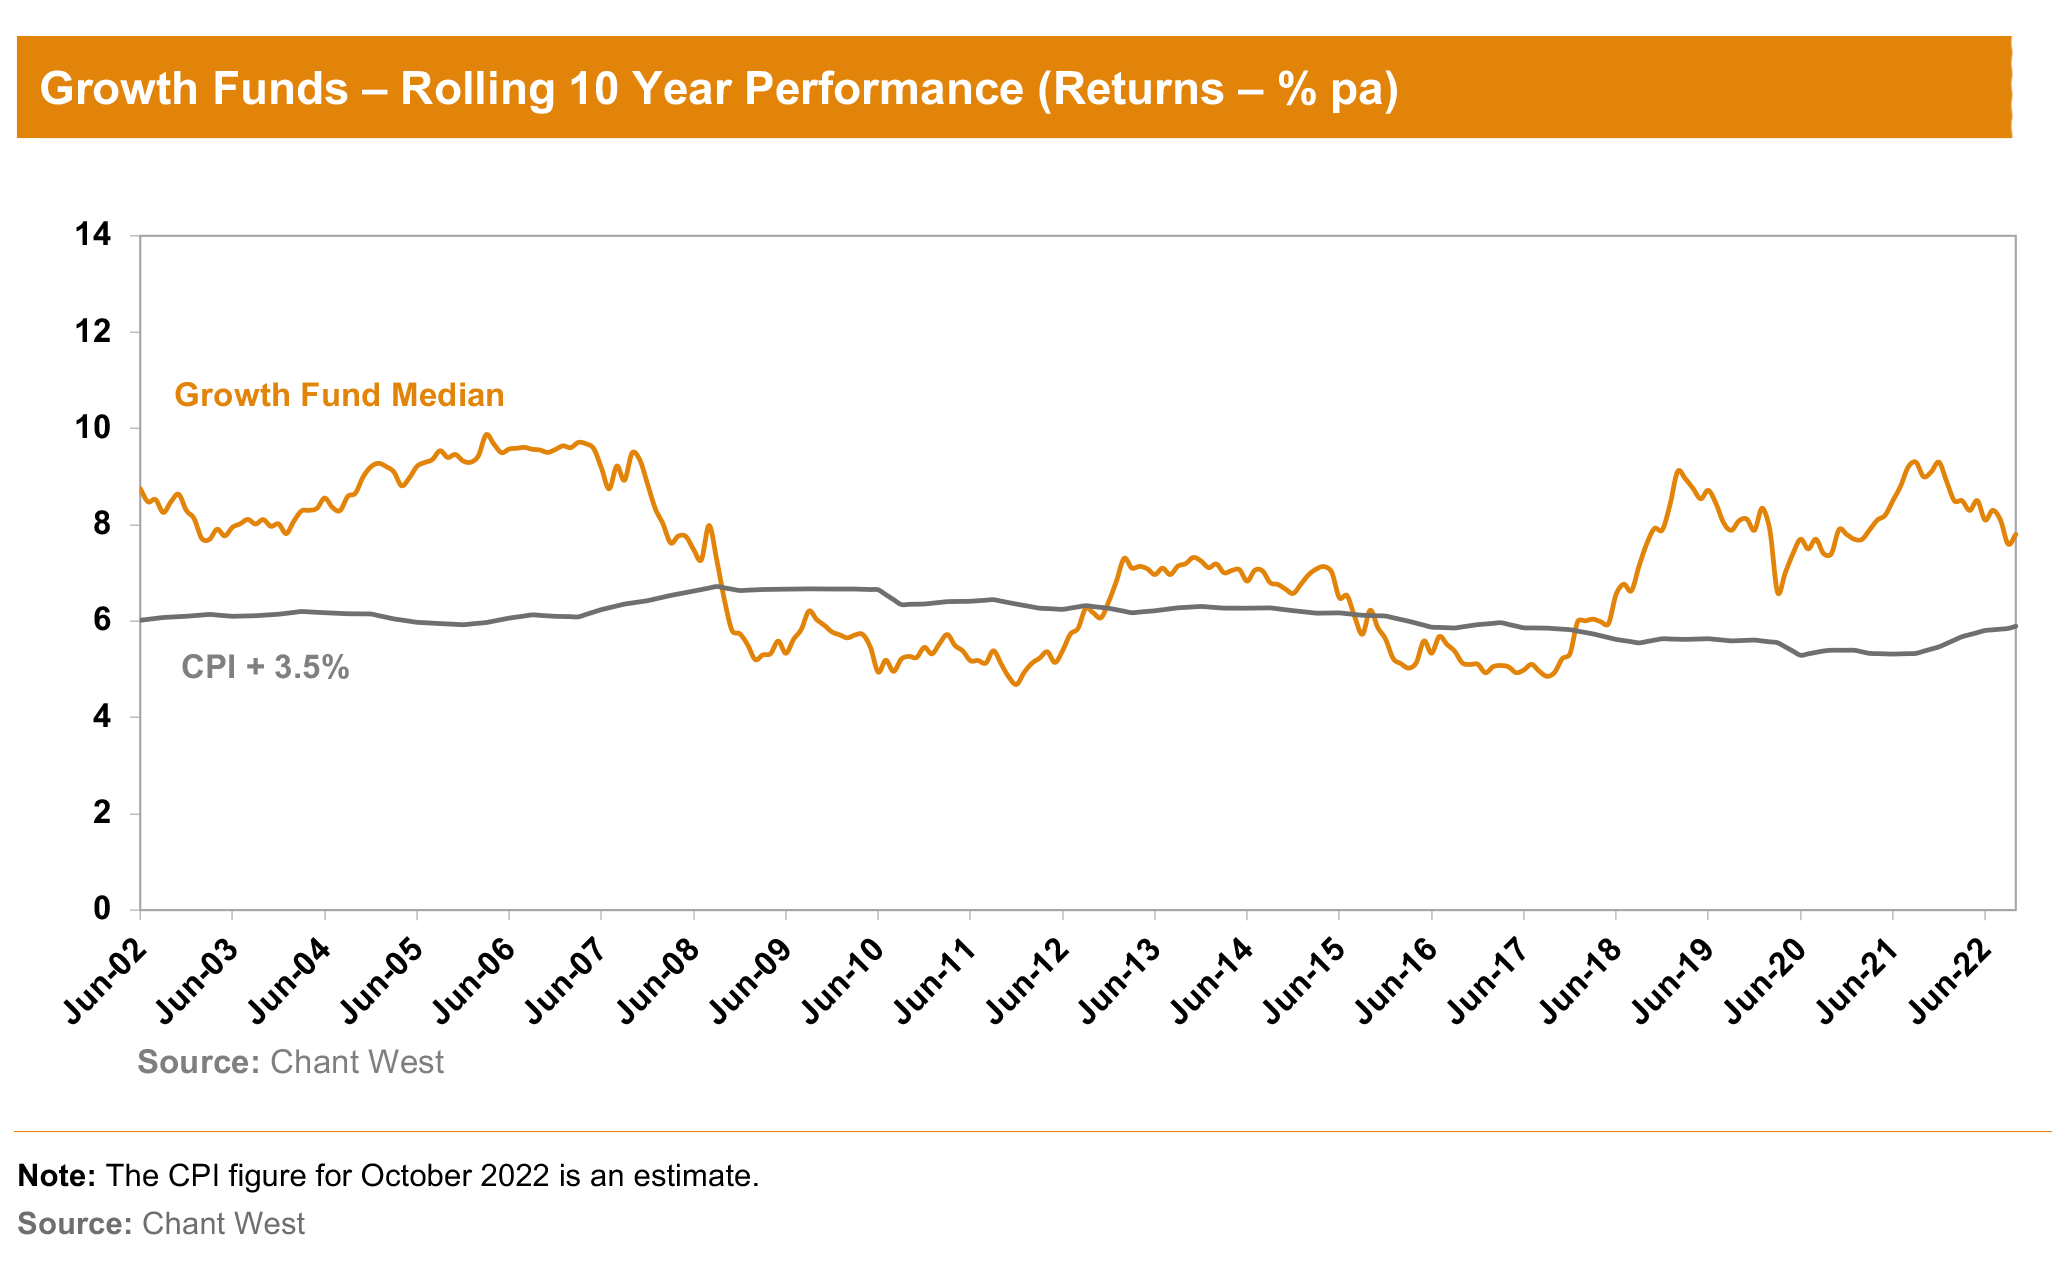
The chart below shows that, for the majority of the time, the median growth fund has exceeded its return objective over rolling 10-year periods, which is a commonly used timeframe consistent with the long-term focus of super. The exceptions are two periods between mid-2008 and late-2017, when it fell behind. This is because of the devastating impact of the 16-month GFC period (end-October 2007 to end-February 2009) during which growth funds lost about 26% on average.
By Mano Mohankumar, Senior Investment Research Manager and Ian Fryer, General Manager


