

How does the private debt market compares to public debt?
The characteristics of private debt
True to label, debt that is private is less transparent than other parts of the credit market, so broad analysis is not easy. Additionally, private debt strategies are not as homogenous as public debt. However, some clarity can be gleaned from the universe of 1,150 private debt funds (with capital over A$1.5 trillion) created by Burgiss, a global analytics and data provider for alternative assets. Salient points from this universe and research[1] are summarised below.
- Private debt is predominantly (c.80%) senior debt in the capital structure, a positive in terms of security, but the quality and sector of the underlying corporates remains the key driver of risk.
- Most private debt securities (84%) are floating rate loans which is a positive in terms of reducing duration risk.
- There is a large spread of industry exposure and this is key to understanding risk and the required return to compensate for it.
- Median senior loan spread (i.e. the margin over the risk free rate) is 7.9%, a small uplift on public market high yield spreads.
- Fees are not disclosed but the market level is typically 0.80 to 1.20% p.a, sometimes with a performance fee added.
Due diligence points for advisers considering private debt are therefore:
- Is the strategy investing in senior debt only, or does it include mezzanine tranches with lower credit quality?
- Are the loans in any one fund diversified across industries or concentrated in a particular area, for example property, or technology?
- What number of loans are in the portfolio and what is the concentration risk arising if larger holdings were to default?
- Unless the private debt fund is listed and can access liquidity in that way, then what is the typical loan term and hence the true underlying liquidity of the fund?
How does public high yield debt compare?
There is much more information available on high yield debt. Simply by appearing in publicly available indices requires all such bonds to meet strict eligibility criteria for inclusion and for ongoing reporting transparency. Such indices create a level playing field for risk return comparisons across asset classes, as shown in figure 1 below:

Emerging Market Debt (LC) = GBI-EM Global Diversified Index, Emerging Market Debt (HC) = JP Morgan EM Bond Index (EMBI Global Diversified Index), US Fallen Angels = Bloomberg Fallen Angel 3% Cap Index, US High Yield = Bloomberg US Corporate High Yield Index, Global Agg = Bloomberg Global Aggregate Bond Index, Global Equity = MSCI ACWI, EM Equity = MSCI Emerging Markets Index, Global Property = FTSE EPRA Nareit Global Real Estate Index Series, AUD Small Cap = MSCI Australia Small Cap Index, Global HY = Bloomberg Global High Yield Corporate Total Return Index, AUS Equity = S&P/ASX300 Index, AUD Bond = Bloomberg AusBond Composite 0+ Yr Index.
The characteristics of public high yield debt
In the following section we highlight why the high yield market is attractive relative to all the major asset classes. We seek to dispel three commonly held myths about the asset class, not least around why perceptions of high default rates impacting returns are not born out by historic returns. We have also highlighted a sub-segment of the High Yield market known as Fallen Angels with even stronger risk/return outcomes.
Myth 1: Default rates are between 3% and 5%
Reality: Defaults have averaged 1.5% pa
Many will be surprised to learn that the Bloomberg US High Yield Corporate Index[2] has only seen an average 1.5% pa default rate over the last 15 years (Figure 1).
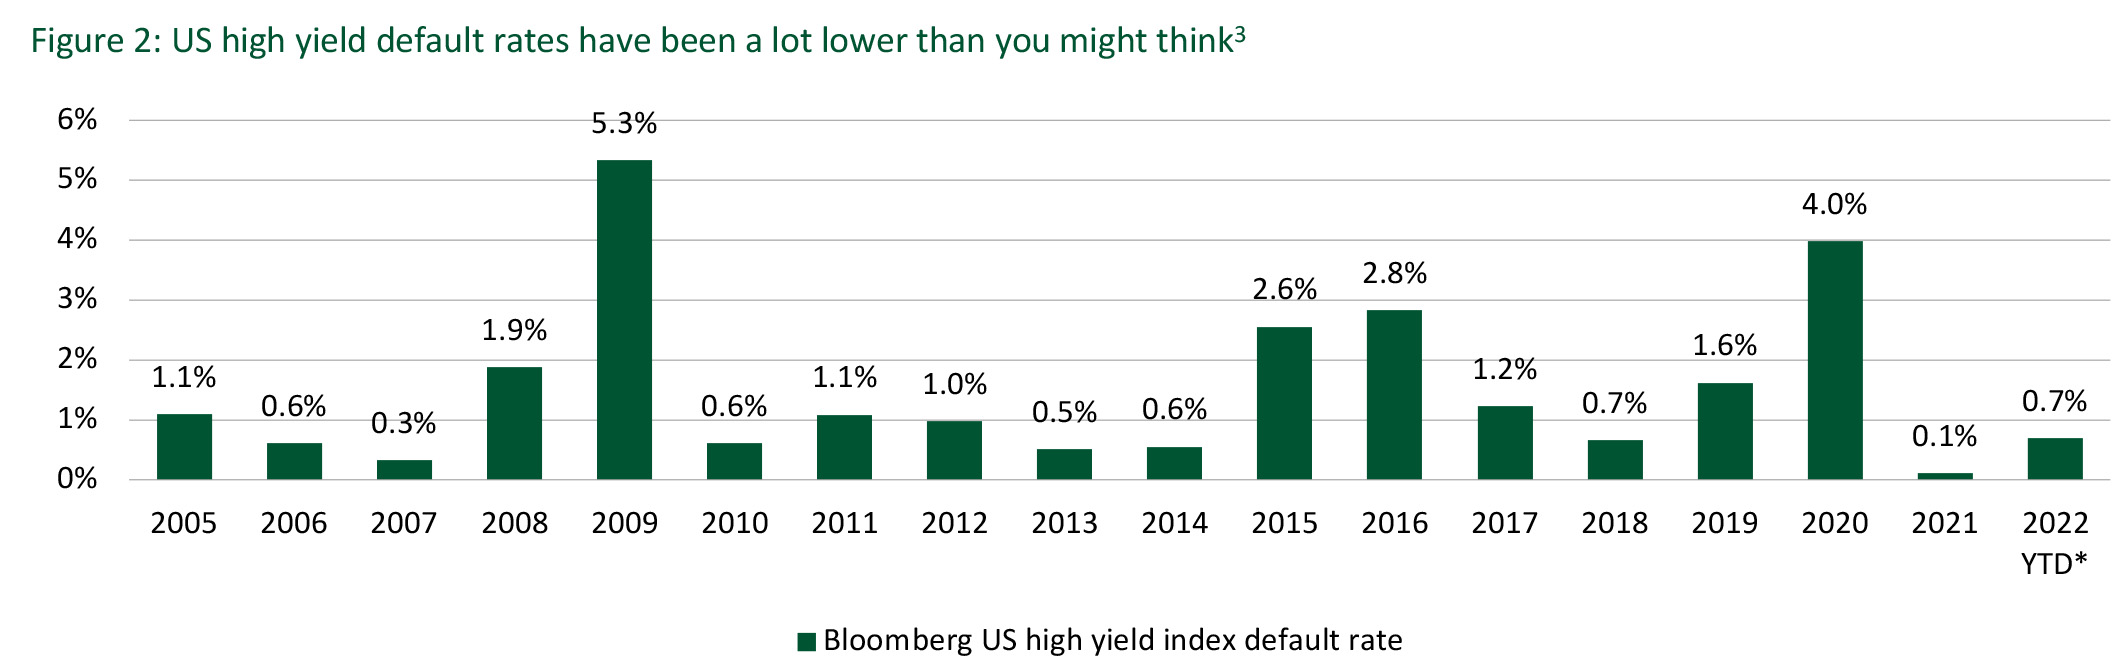
Historically, it has required a financial crisis (such as the start of the pandemic in February 2020 or the 2008 Global Financial Crisis) for US default rates to approach 4% or above. In 2021, defaults were the lowest in 15 years and have so far risen only to 0.7% in 2022 even as recession risks build. We expect default rates to remain within historical norms, but even in the event of crisis-level defaults, history indicates the pain will be far less substantial than most have been led to believe.
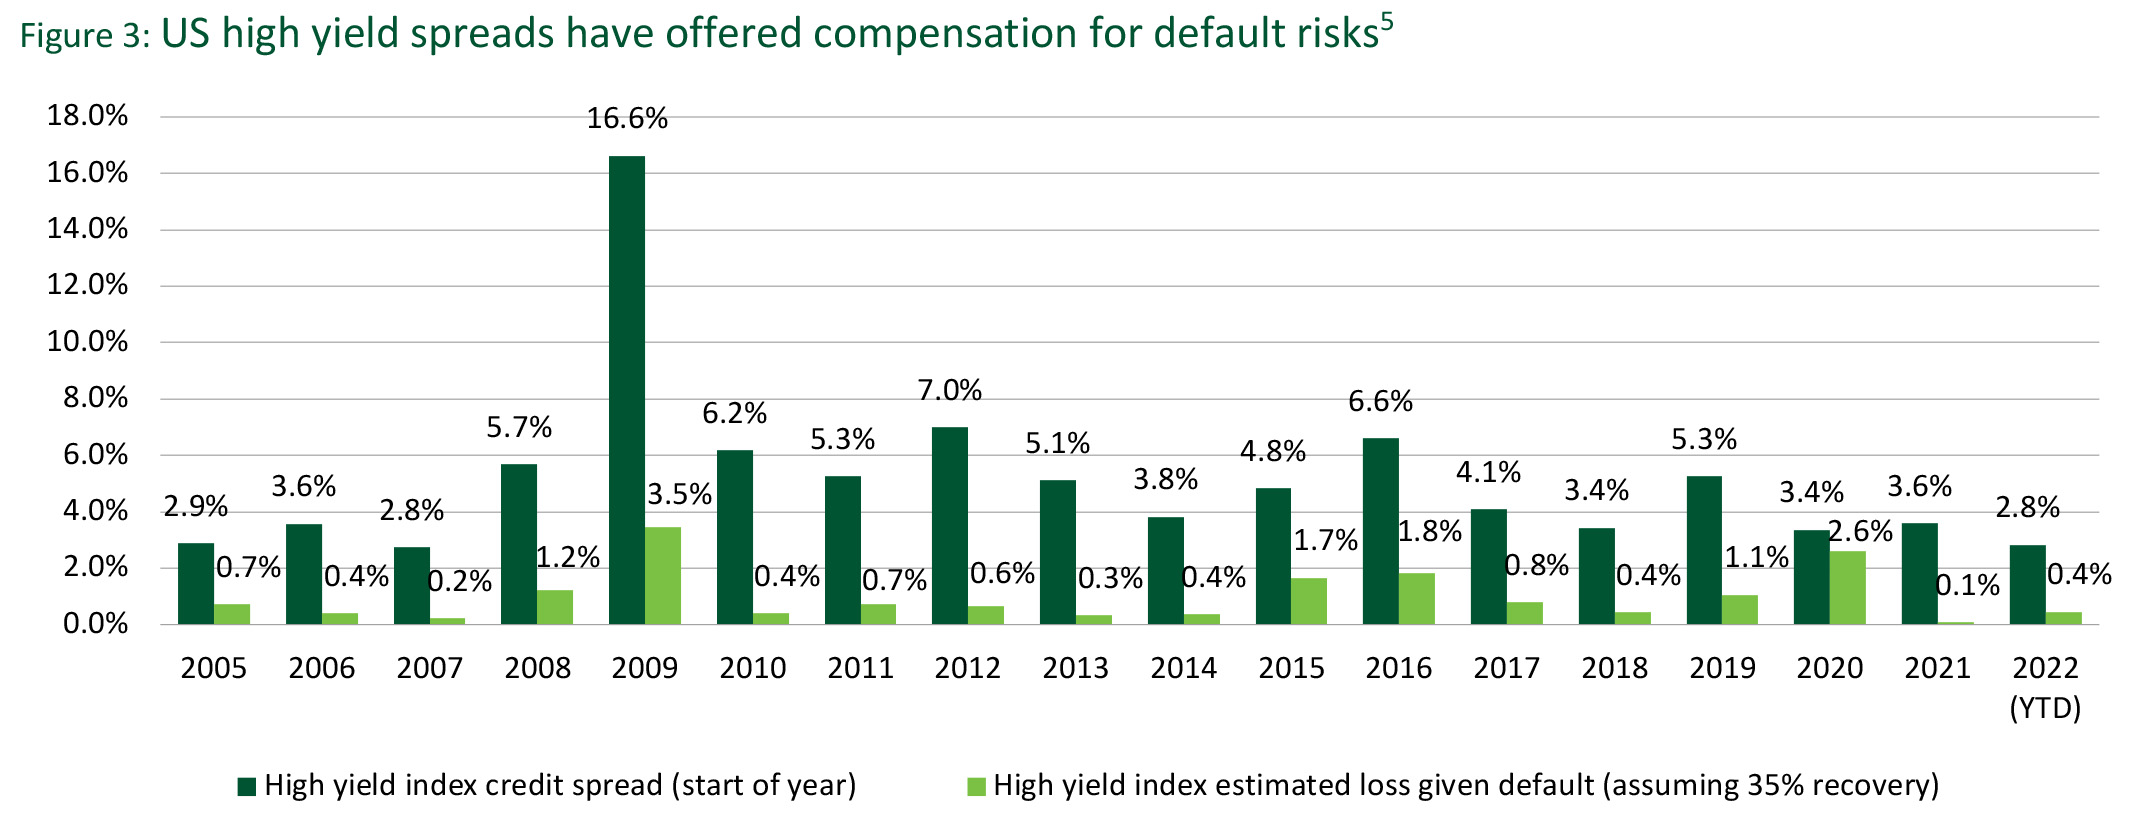
Assuming recovery rates of ~35%, (which is historically conservative[4]), high yield credit spreads have been priced to overcompensate for default risks (see figure 2).
Rating agencies report higher default rates
The high yield default rates investors are used to hearing from the ratings agencies are typically 3% to 5% on average, and much higher during periods of stress (Figure 3).
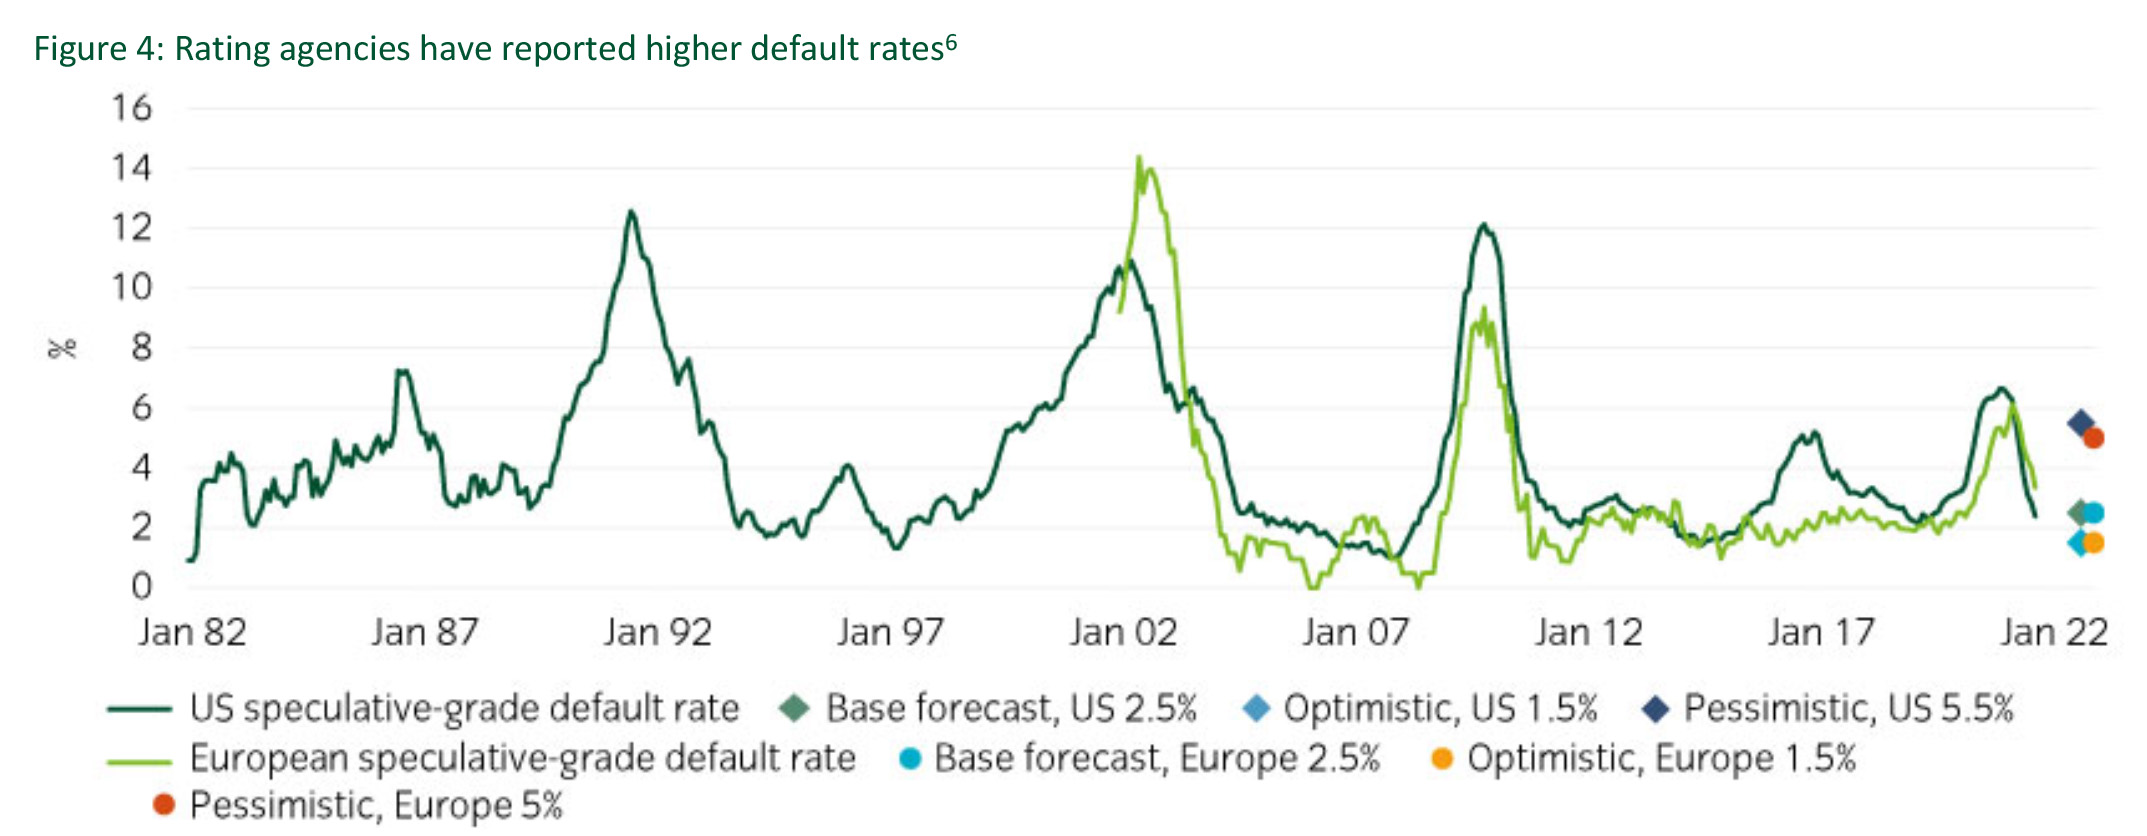
Ratings agency default analytics are not based on the high yield indices that investors are most likely to be exposed to, but the entire population of corporates for whom they have assigned a credit rating.
We believe these broader default samples are useful for top-down macro-level analysis or modelling. However, for high yield investors concerned about compensation for risk, index defaults have more direct relevance.
This is equivalent to how a climate scientist would never solely focus on global average temperatures to understand climate dynamics in the arctic – where temperatures are rising twice as fast.
Myth 2: High yield is vulnerable to rising rates
Reality: High yield returns have been positive in rising rate environments
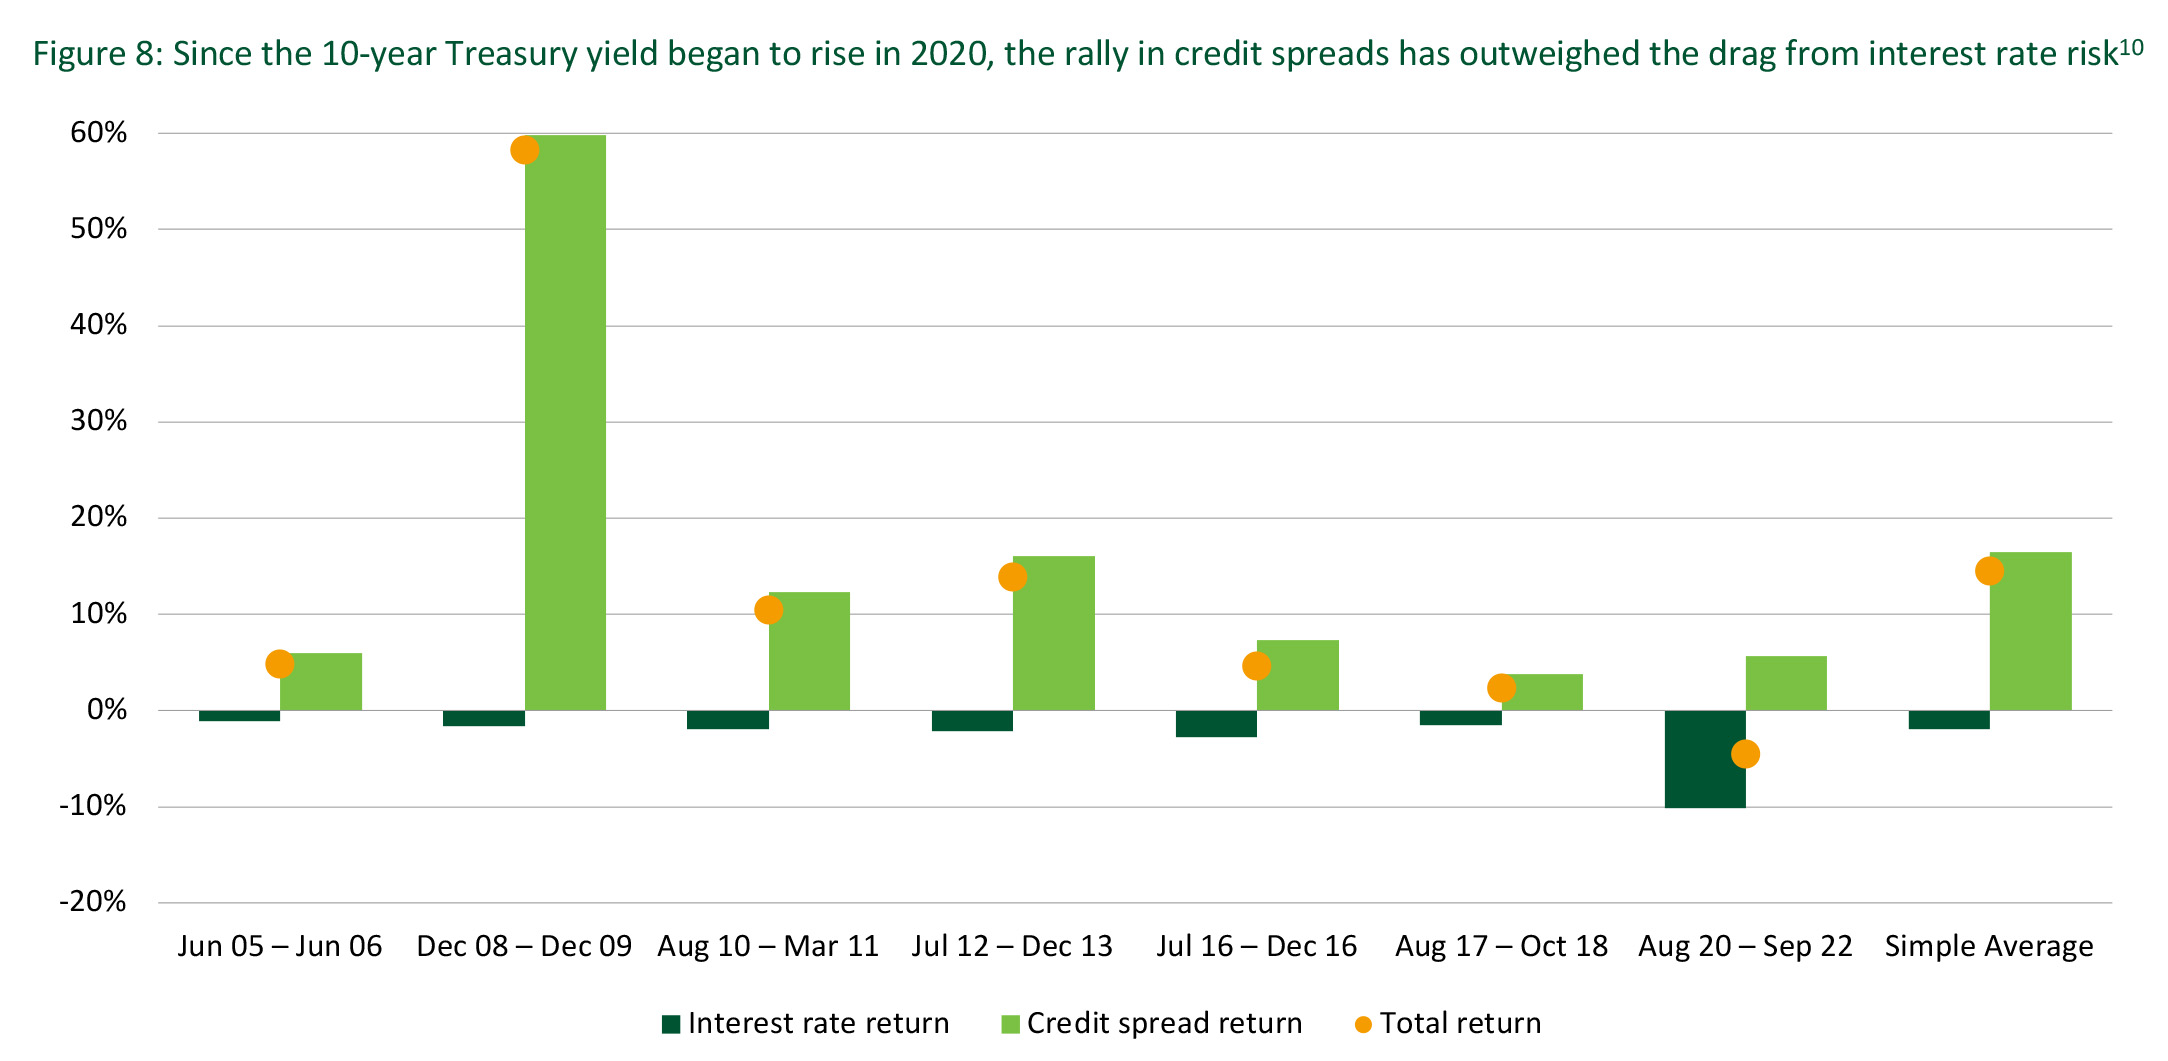
Since 2005, there have been seven periods in which 10-year Treasury yields have risen by ~1% or more
US high yield markets have consistently delivered positive total returns during most of these periods (Figure 4). The main exception has been the current period, which has not ended. We believe this could indicate a potentially attractive entry point for high yield investors.
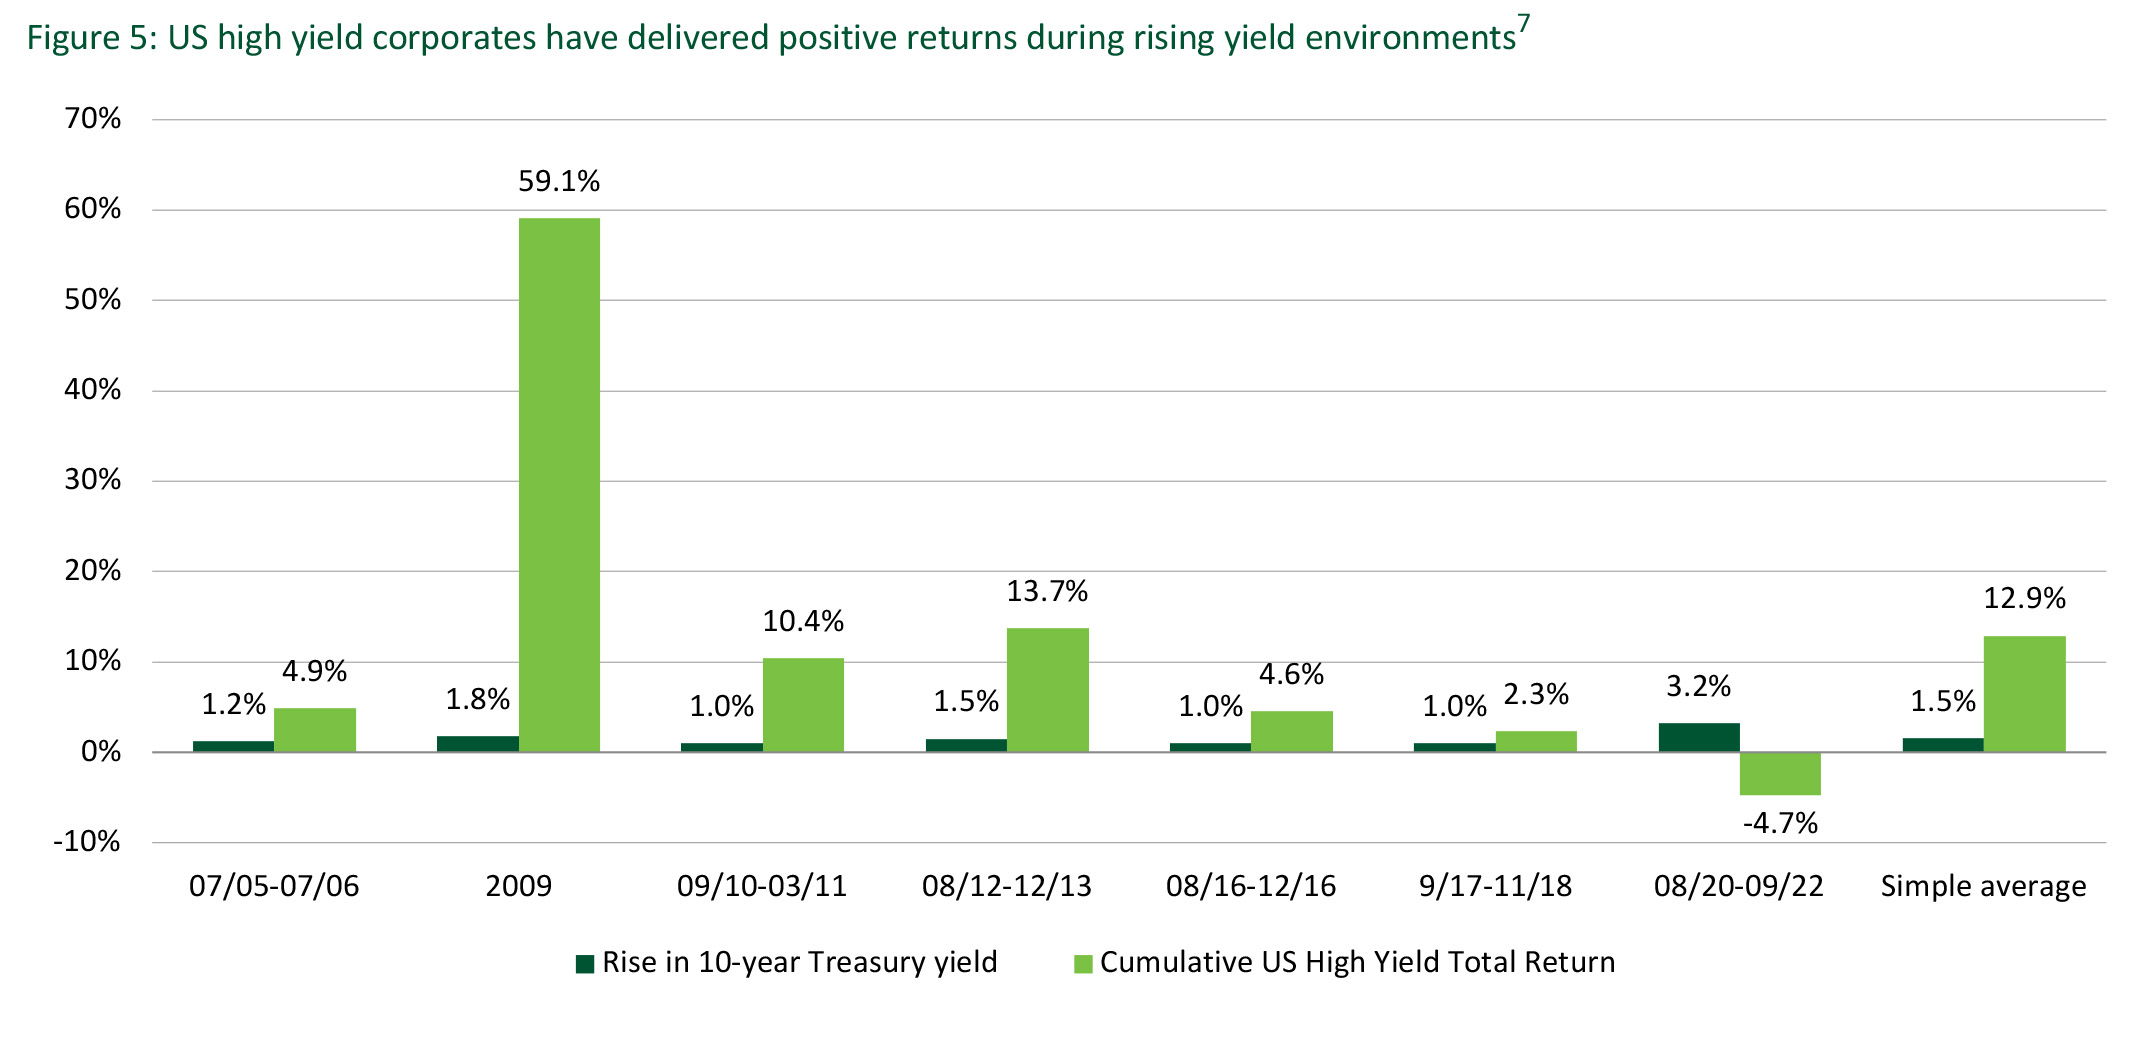
On average high yield returned close to 13% during these periods.
High yield is more naturally resilient to rising rates
High yield has less interest rate (or ‘duration’) risk than government or investment grade bonds, as high yield tends to be shorter dated on average.
Further, bond yields on high yield credit are mostly comprised of credit spread (Figure 5).
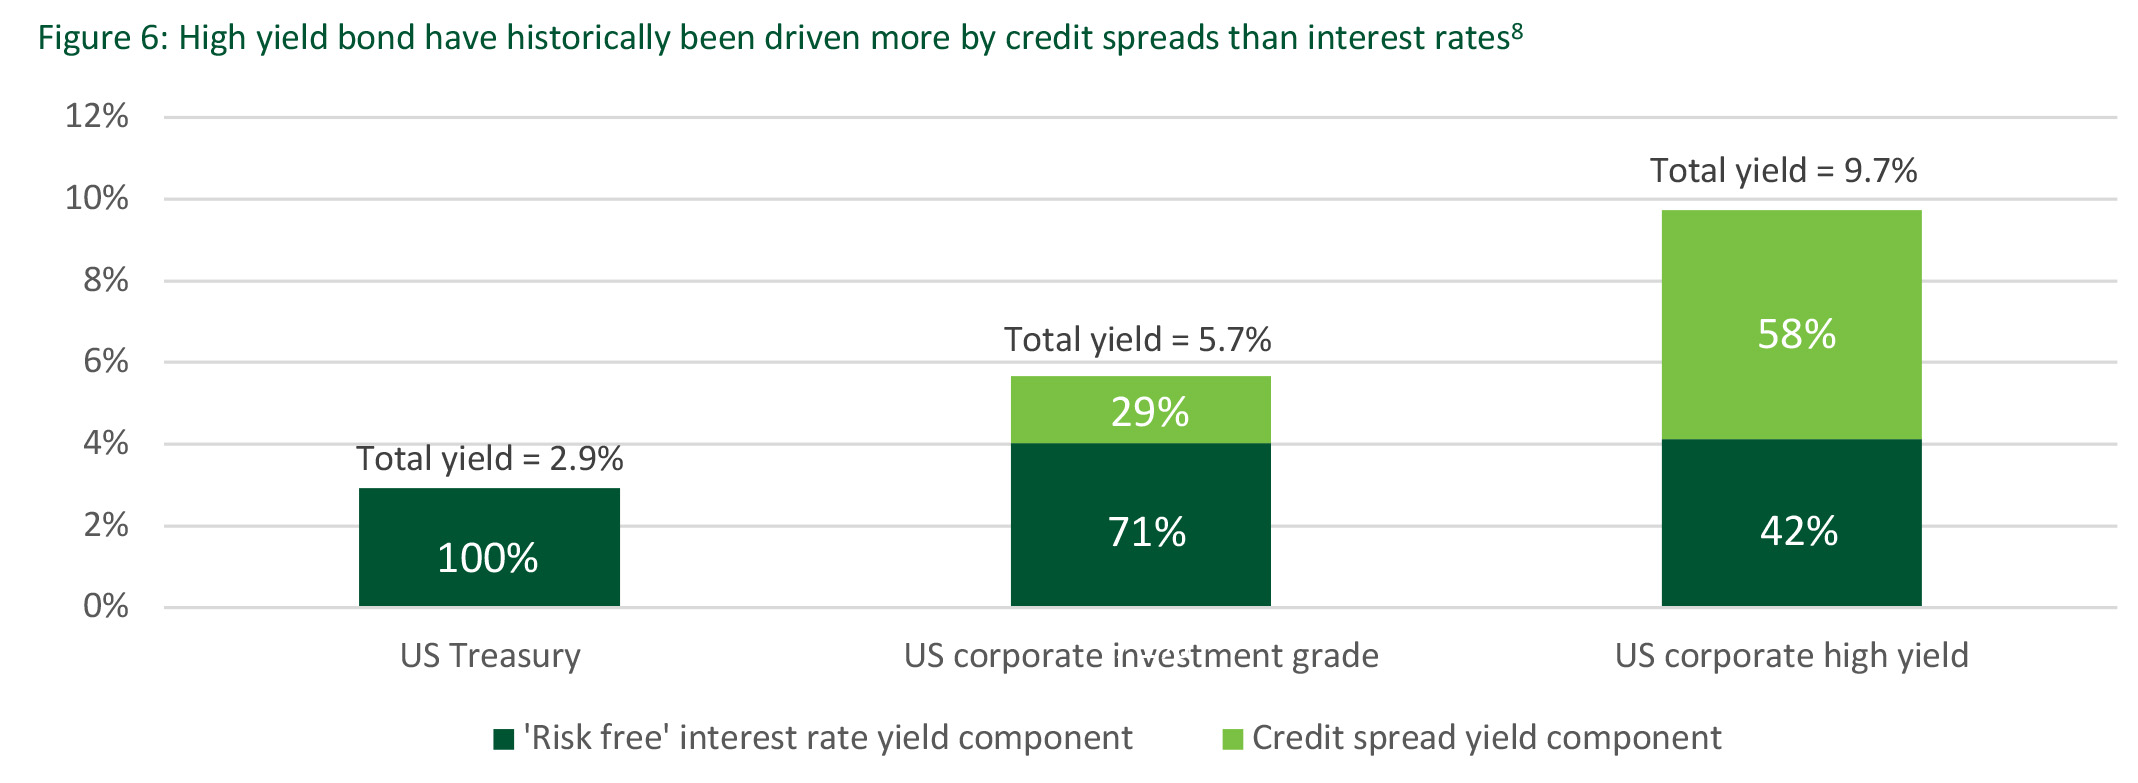
As such, changes in credit spreads have had more of an impact on high yield returns than changes in interest rates.
This is particularly important because interest rates and credit spreads tend to be negatively correlated (Figure 6). This is because central banks typically raise interest rates when the economy is growing, which is good for corporate balance sheets, and therefore credit spreads.
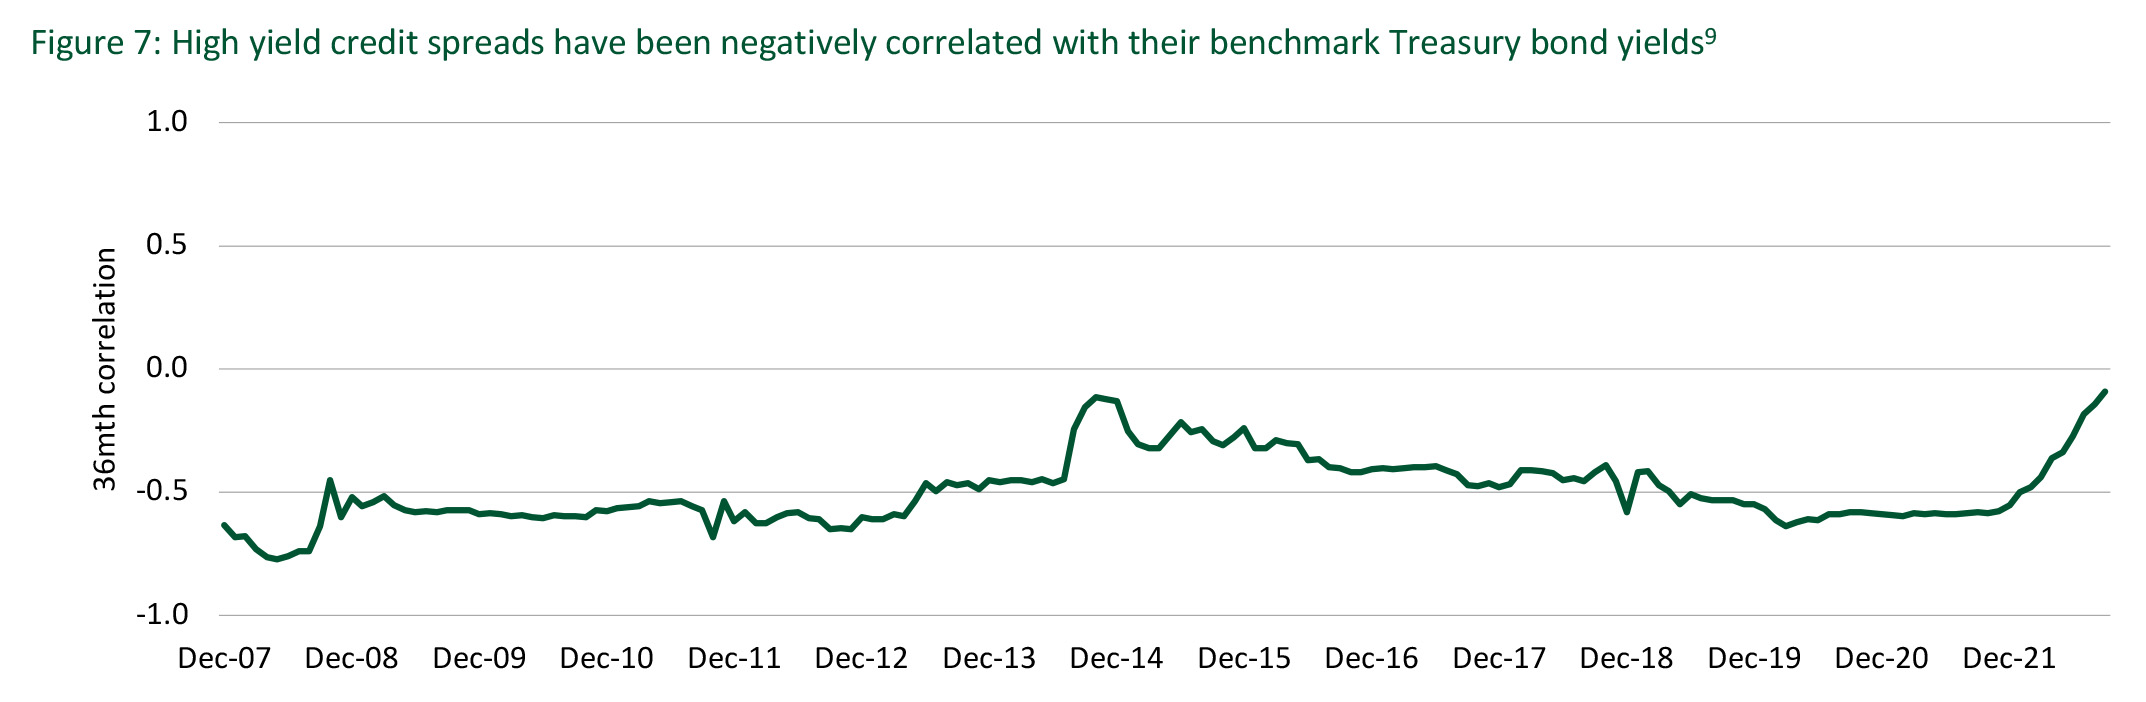
As such, when rates have risen, gains from credit spreads narrowing have heavily outweighed losses from interest rate risk in most cases (Figure 7).
Myth 3: Liquidity is impossible to source
Reality: Specialists can tap ‘hidden liquidity’ from the ETF ecosystem
For most market participants, two-way liquidity in the high yield market did indeed deteriorate rapidly following the 2008 financial crisis, as new banking sector regulations took hold, making it less attractive for market makers to hold large inventories of bonds on their books.
As bonds are almost universally traded over-the-counter, one bond at a time, two-way liquidity became harder to source, particularly during times of market stress when the number of sellers overwhelmed buyers, exacerbating price swings.
Other investors have found new sources of liquidity
However, after the 2008 crisis the fixed income ETF market developed rapidly, providing a new source of bond market liquidity.
Skilled investors experienced within the fixed income ETF ecosystem were therefore able to unlock ‘hidden liquidity’ within the ‘create and redeem’ feature, similar to the programmatic trading that has been a staple of the equity market for decades.
It has opened the door to trading large, customised baskets of bonds within hours for relatively low trading costs. In our experience, market makers even prefer trading diversified bond baskets because they can hedge them more efficiently and cost effectively.
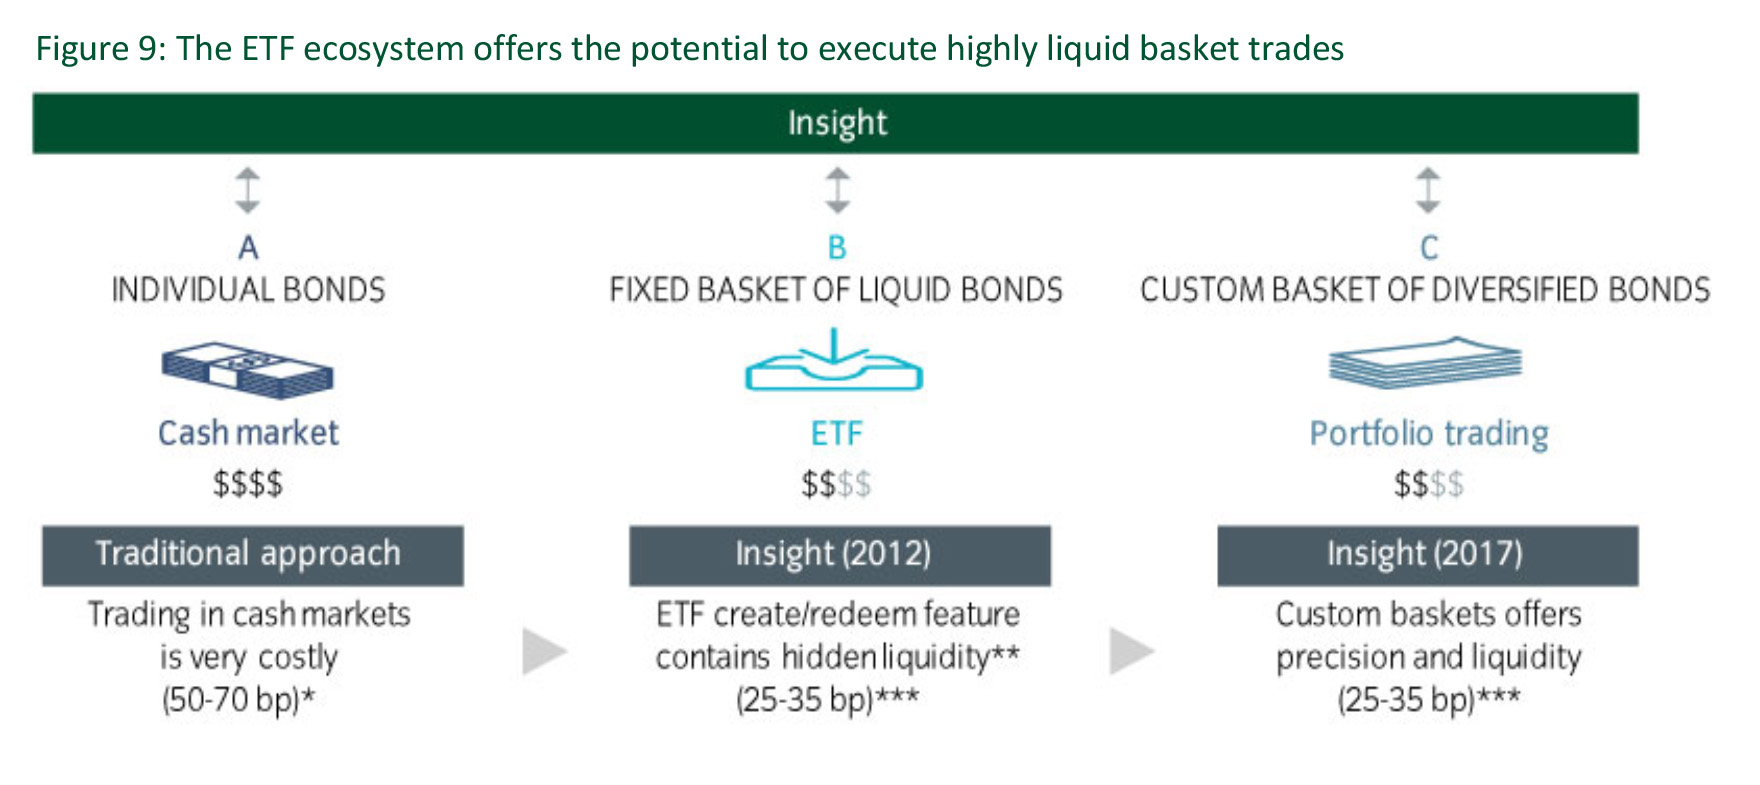
In our view, this type of trading can help investors target alpha within smaller and traditionally less liquid issuers. Investors can also aim to eliminate much of the drag on returns imposed by high transaction costs.
Income portfolio construction
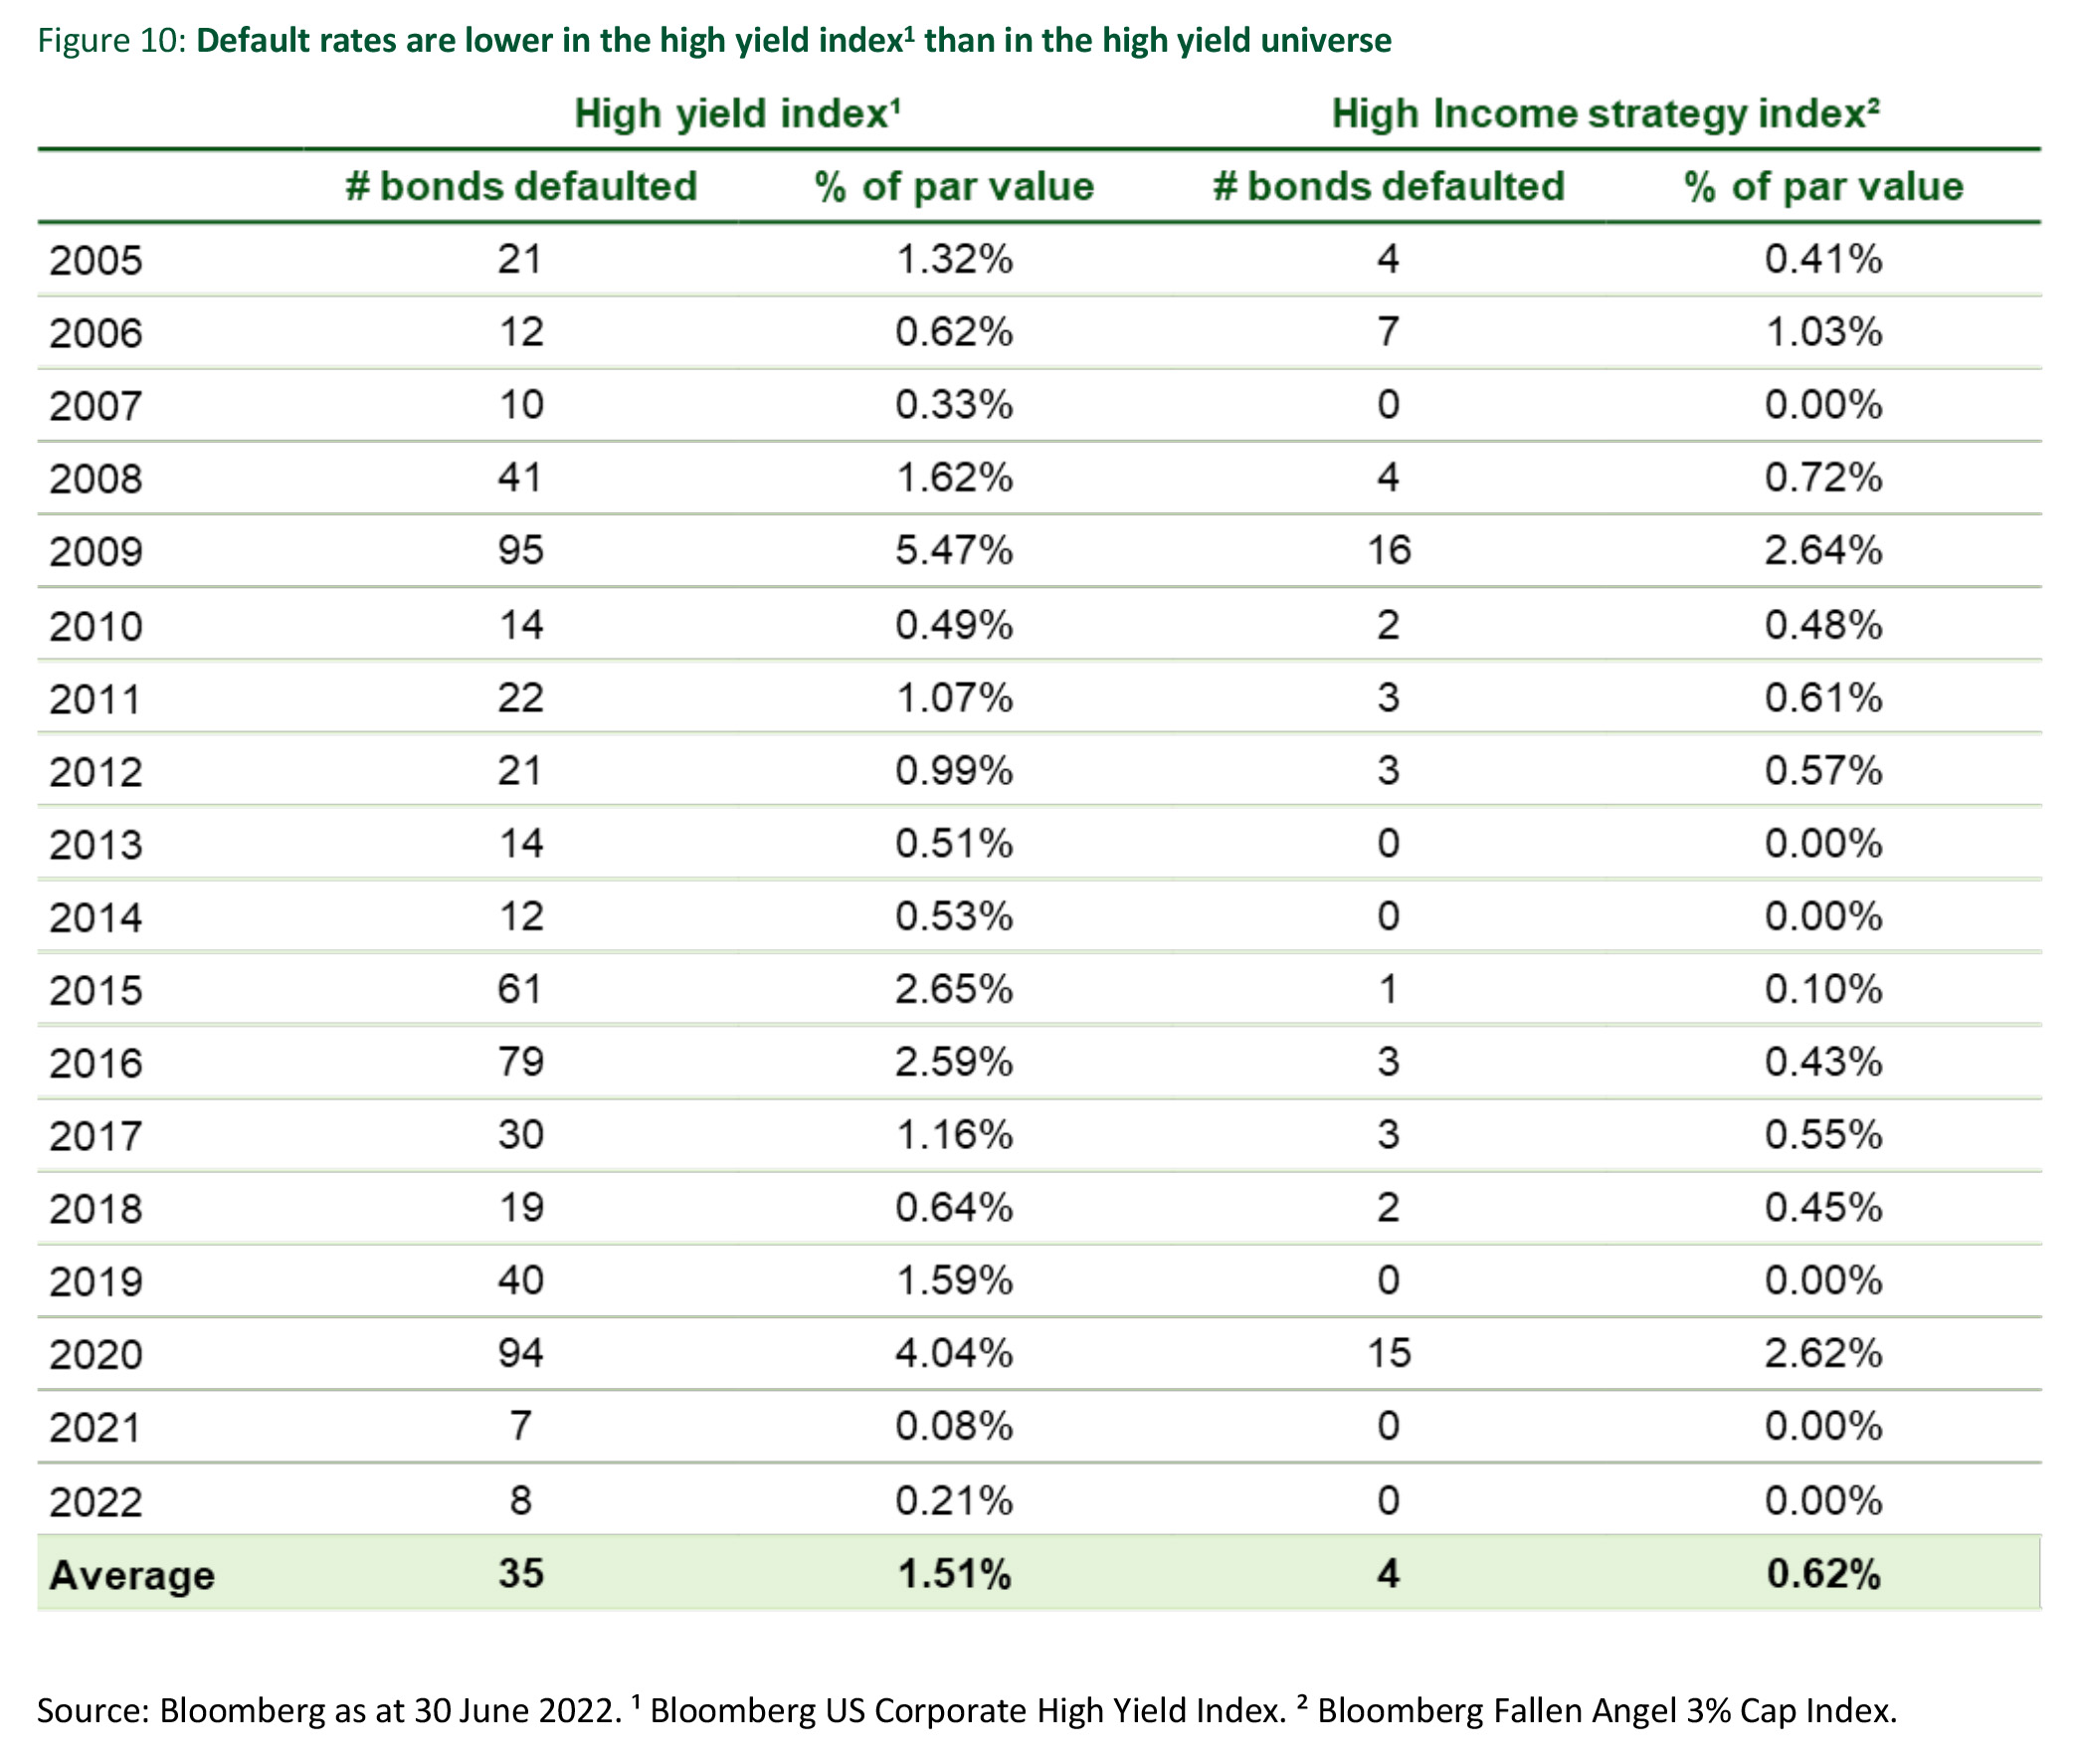
We believe the Fallen Angels segment highlighted in the earlier risk/return chart holds particular appeal for income portfolio construction. This segment comprises securities that have been downgraded from investment grade (BBB) to High Yield (BB) credit rating. Relative to the broader High Yield universe it is a higher quality segment. Notably the Fallen Angels index is comprised of 92% securities rated BB, just one notch lower than investment grade, contrasting with only 52% held at this quality level in the broader high yield index. Apart from superior credit quality, the Fallen Angel index benefits from forced “rules based” selling of its constituents by some institutional investors at the time of downgrade from investment grade to BB rating. The tables below highlight some other areas where Fallen Angels stand out relative to the broader high yield index.
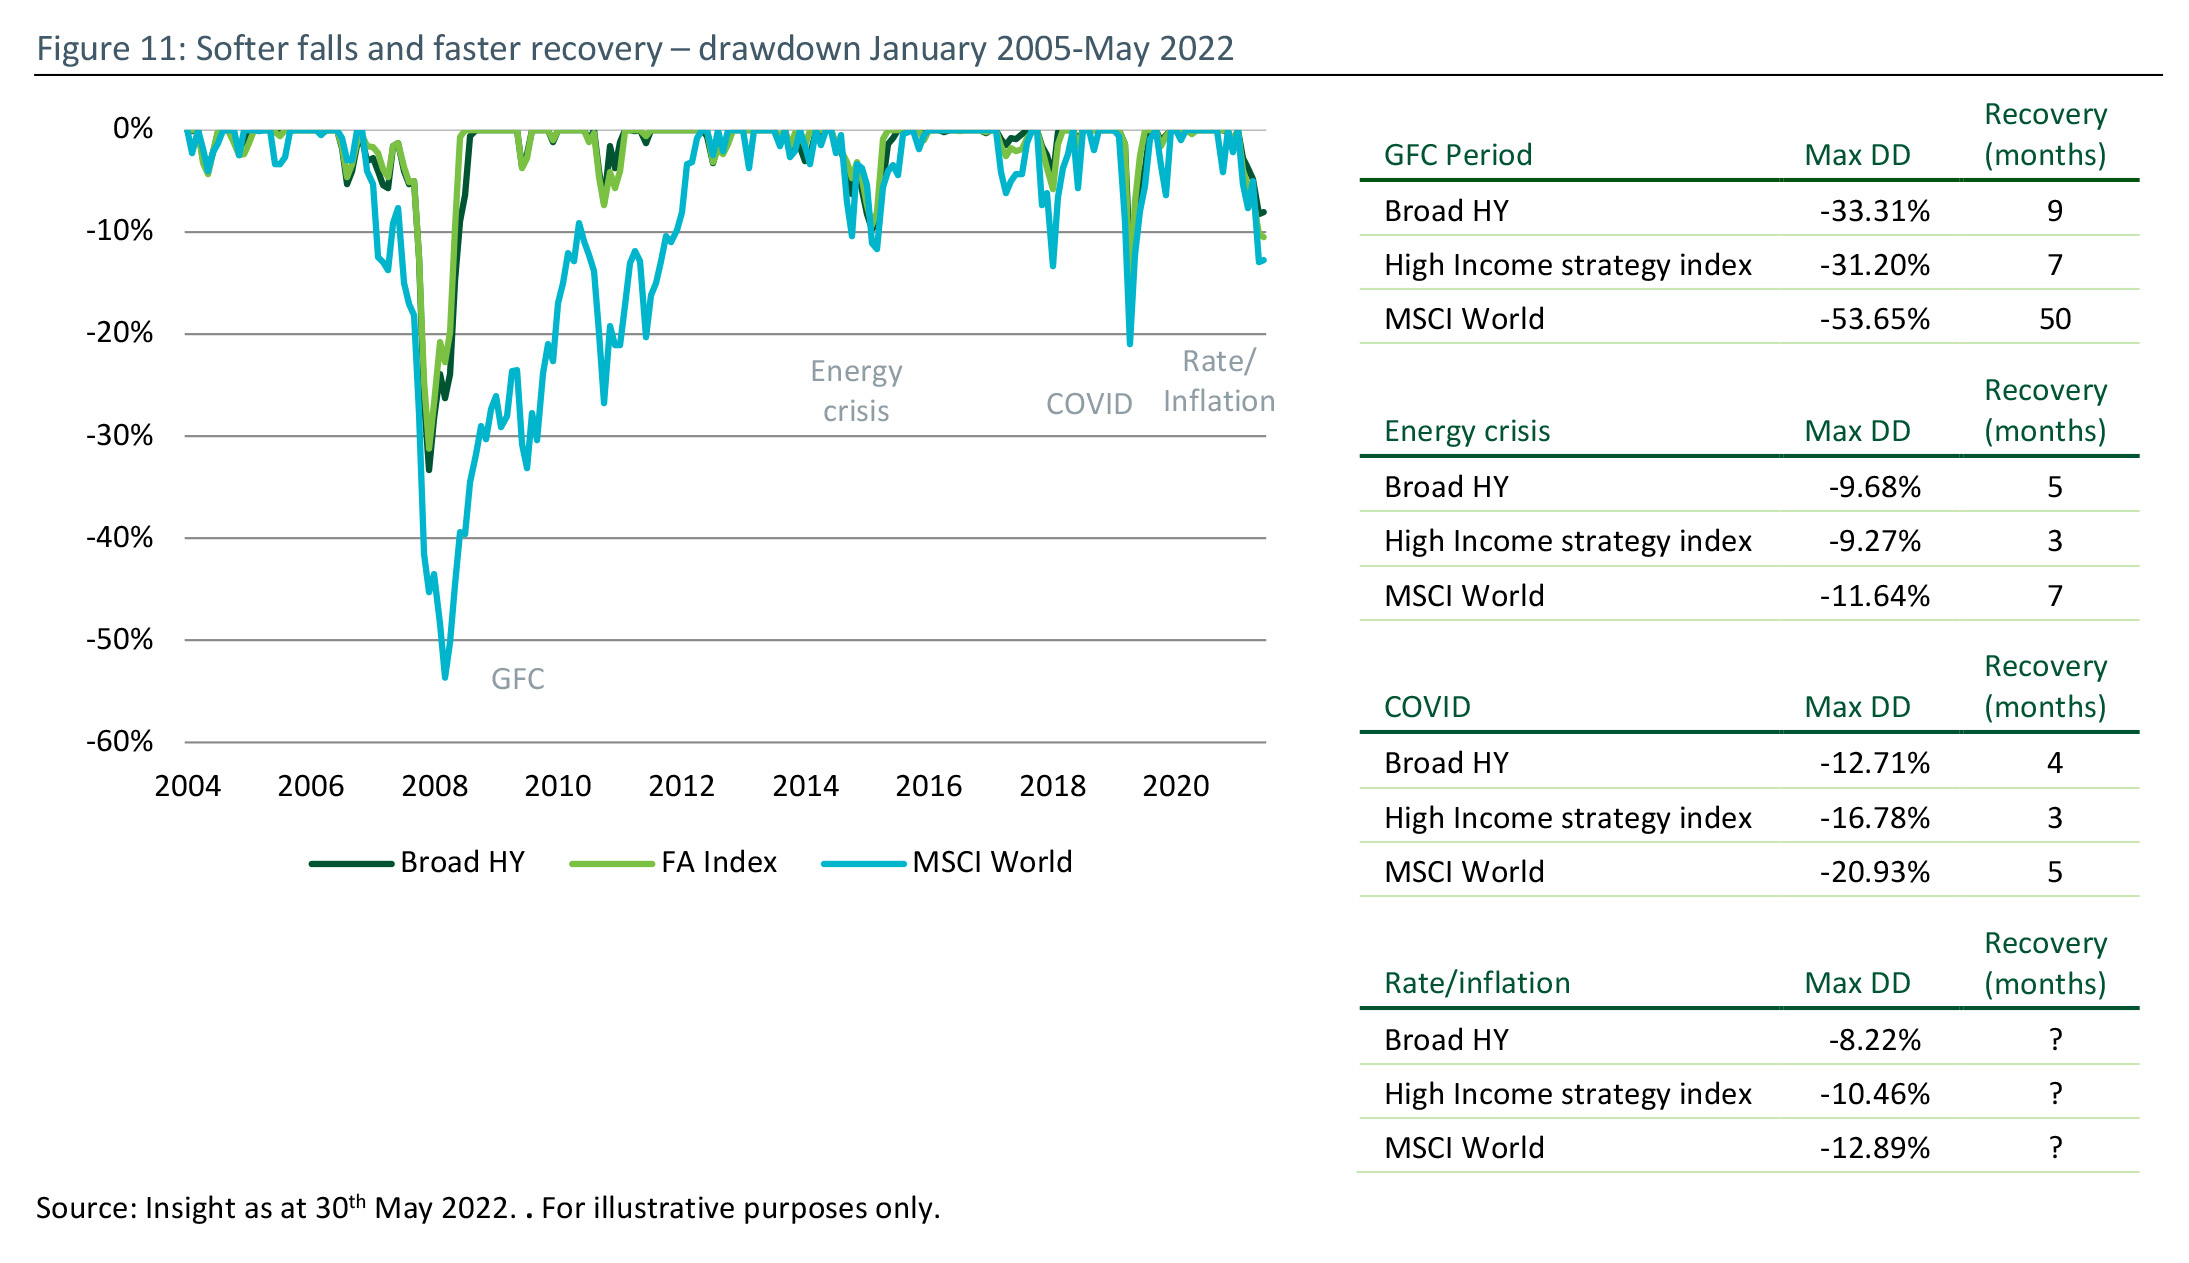
Smaller drawdowns and faster recovery
When constructing an income portfolio for clients the inclusion of publicly traded High Yield debt, such as Fallen Angels in particular, provides strong diversification either on a stand-alone basis or alongside private debt. Though the private nature of private debt makes comparison difficult there is a strong argument that public debt can improve portfolios by providing:
- Daily liquidity
- Diversification across 200-300 securities and multiple industries
- Low-cost exposure
- Complete transparency on holdings
Conclusion
No clear-cut comparison can be made between private and public debt due to the opaque nature of the private debt market. However, based on available information, this paper has outlined the key differences between public and private debt. It has also clarified some typical misconceptions around high yield debt and used the transparency of the public debt market to highlight the attractive risk/return characteristics of high yield debt as part of an income portfolio
———-
References
[1] A first look into private debt (April 2022) at https://www.burgiss.com/applied-research-blog/2022/4/12/a-first-look-into-private-debt and a closer look at private debt (November 2022) at https://www.burgiss.com/applied-research-blog/a-closer-look-at-private-debt
[2] See index descriptions at the back of the document
[3] Bloomberg, Insight calculations, May 2022. *Note, there has been one planned technical default in 2022 so far, but the bond is trading close to par as no loss is expected
[4] Moody’s, December 2021
[5] Bloomberg, Insight calculation, September 2022. *Note, there has been one planned technical default in 2022 so far, but the bond is trading close to par as no loss is expected
[6] S&P Global, December 2021
[7] Bloomberg, Insight calculations, September 2022
[8] Bloomberg, September 2022. Indices are The Bloomberg US Treasury Bond Index, The Bloomberg US Corporate Bond Index and The Bloomberg US Corporate High Yield Bond Index. Please see index descriptions at the back of the document.
[9] Bloomberg, September 2022. Past performance is not indicative of future results. Investment in any strategy involves a risk of loss which may partly be due to exchange rate fluctuations. The performance results shown are net of investment management fees and reflect the reinvestment of dividends and/or income and other earnings. Please refer to the important disclosures at the back of this presentation.
[10] Bloomberg, May 2022
———–
Important Information
Risk disclosures
Past performance is not indicative of future results. Investment in any strategy involves a risk of loss which may partly be due to exchange rate fluctuations.
The performance results shown, whether net or gross of investment management fees, reflect the reinvestment of dividends and/or income and other earnings. Any gross of fees performance does not include fees, taxes and charges and these can have a material detrimental effect on the performance of an investment. Taxes and certain charges, such as currency conversion charges may depend on the individual situation of each investor and are subject to change in future.
Any target performance aims are not a guarantee, may not be achieved and a capital loss may occur. The scenarios presented are an estimate of future performance based on evidence from the past on how the value of this investment varies over time, and/or prevailing market conditions and are not an exact indicator. They are speculative in nature and are only an estimate. What you will get will vary depending on how the market performs and how long you keep the investment/product. Strategies which have a higher performance aim generally take more risk to achieve this and so have a greater potential for the returns to be significantly different than expected.
Any projections or forecasts contained herein are based upon certain assumptions considered reasonable. Projections are speculative in nature and some or all of the assumptions underlying the projections may not materialize or vary significantly from the actual results. Accordingly, the projections are only an estimate.
Portfolio holdings are subject to change, for information only and are not investment recommendations.
Associated Investment Risks
Fixed income
-
Where the portfolio holds over 35% of its net asset value in securities of one governmental issuer, the value of the portfolio may be profoundly affected if one or more of these issuers fails to meet its obligations or suffers a ratings downgrade.
-
A credit default swap (CDS) provides a measure of protection against defaults of debt issuers but there is no assurance their use will be effective or will have the desired result.
-
The issuer of a debt security may not pay income or repay capital to the bondholder when due.
-
Derivatives may be used to generate returns as well as to reduce costs and/or the overall risk of the portfolio. Using derivatives can involve a higher level of risk. A small movement in the price of an underlying investment may result in a disproportionately large movement in the price of the derivative investment.
-
Investments in emerging markets can be less liquid and riskier than more developed markets and difficulties in accounting, dealing, settlement and custody may arise.
-
Investments in bonds are affected by interest rates and inflation trends which may affect the value of the portfolio.
-
Where high yield instruments are held, their low credit rating indicates a greater risk of default, which would affect the value of the portfolio.
-
The investment manager may invest in instruments which can be difficult to sell when markets are stressed.
-
Exposure to international markets means exposure to changes in currency rates which could affect the value of the portfolio.
-
Where leverage is used as part of the management of the portfolio through the use of swaps and other derivative instruments, this can increase the overall volatility. While leverage presents opportunities for increasing total returns, it has the effect of potentially increasing losses as well. Any event that adversely affects the value of an investment would be magnified to the extent that leverage is employed by the portfolio. Any losses would therefore be greater than if leverage were not employed.
-
While efforts will be made to eliminate potential inequalities between shareholders in a pooled fund through the performance fee calculation methodology, there may be occasions where a shareholder may pay a performance fee for which they have not received a commensurate benefit.


