Market leadership narrows to GFC levels
Over the past twelve months to 31 May 2023, investors have faced a particularly challenging market environment. Amidst macroeconomic uncertainty and geopolitical tensions, it may surprise you that Australian equities (as represented by the S&P/ASX 300 Accumulation Index) have generated positive returns over the period. However, scratching below the surface, not everything is as it seems!
Despite the market’s positive return, 55% of constituents decreased in value over the past year. In fact, market leadership, as defined by the percentage of constituents outperforming the index, narrowed significantly, highlighting that the market’s performance has been driven by a small group of stocks with strong performance.
The following chart illustrates the percentage of constituents outperforming the S&P/ASX 300 Accumulation Index on a rolling one-year basis over the past 20 years.

Over the assessed period, market leadership averaged approximately 50%. However, over the past year, market leadership has narrowed significantly, falling to historically low levels in January 2023. At this stage, only one in every three stocks outperformed the market. The only period where market leadership was narrower was during the Global Financial Crisis.
What implications does narrow market leadership have on active management?
With a limited number of stocks outperforming during periods of narrow market leadership, investors can be forgiven for questioning the benefit of active management in such times. Do the words of Vanguard founder and index investing champion, John C. Bogel ring true?
“Don’t look for the needle in the haystack. Just buy the haystack!”
The following chart breaks down the average excess performance of active managers, as represented by Zenith’s rated Australian Shares – Large companies peer group, under different market leadership regimes, over the last 20 years.
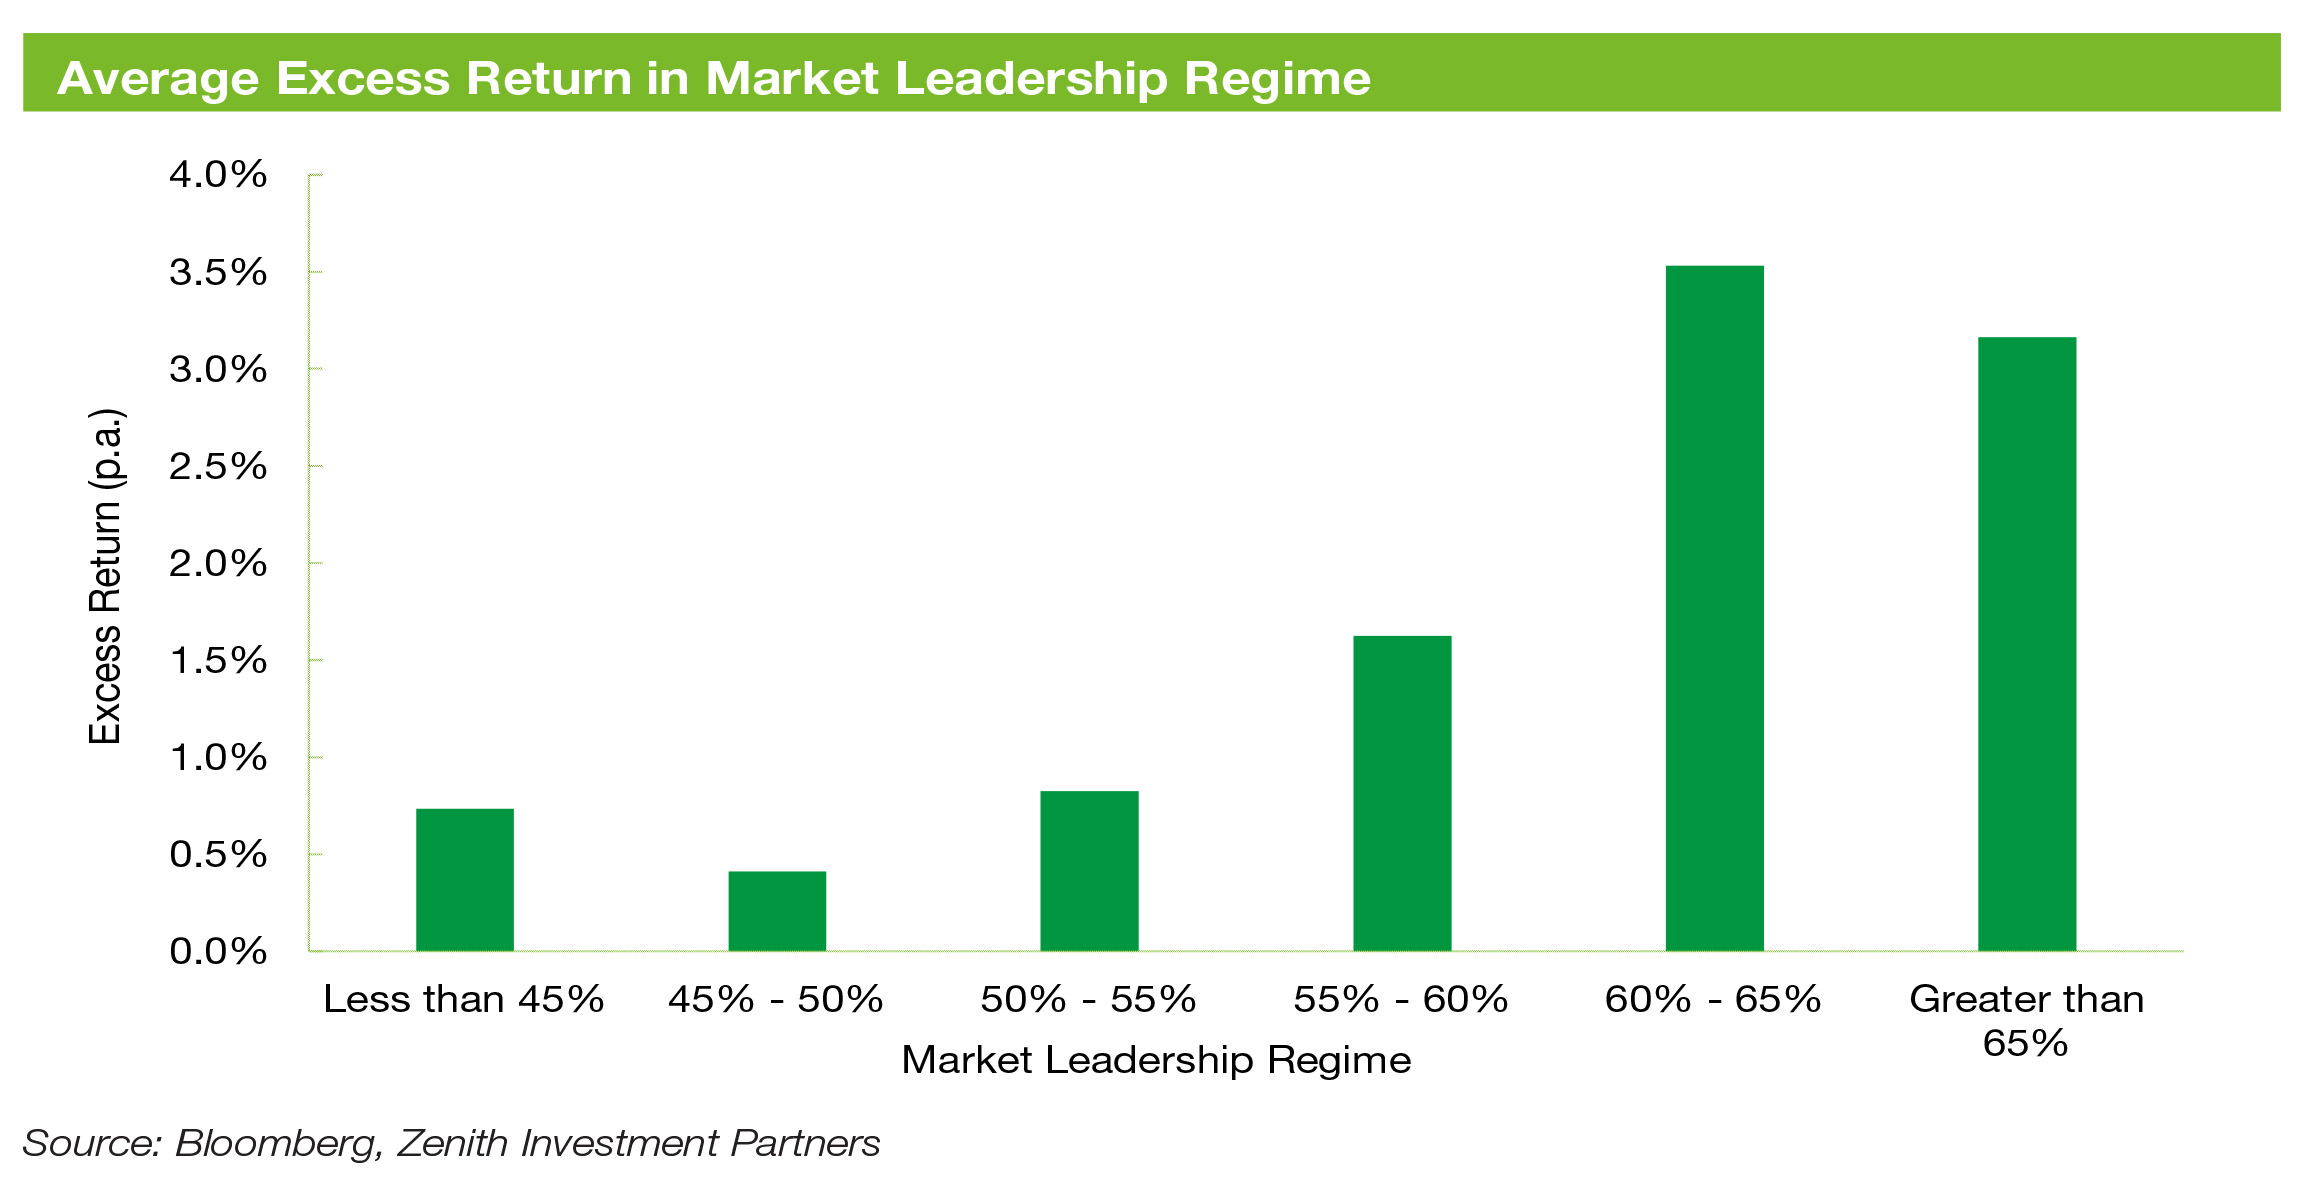
Consistent with expectations, excess returns diminished as market leadership became narrower and vice versa. However, Zenith highlights that our rated funds were able to outperform the benchmark under all market regimes, even under the narrowest of conditions.
Our analysis suggests there is a strong benefit from active management, even in tough market conditions.
Feast or famine?
Given the relationship between market leadership and the excess returns of active managers, can we use this to identify periods that are more conducive to active management?
We found that there is a strong and positive relationship between the current market regime and the market regime in future periods. Although over long term, market regimes tend to revert towards its mean. Essentially, when market leadership is narrow, it will have a high probability of remaining narrow in the near term.
The chart below shows the correlation between market leadership in the current period and market leadership in the subsequent 3, 6, 12, 15 and 18-month periods.
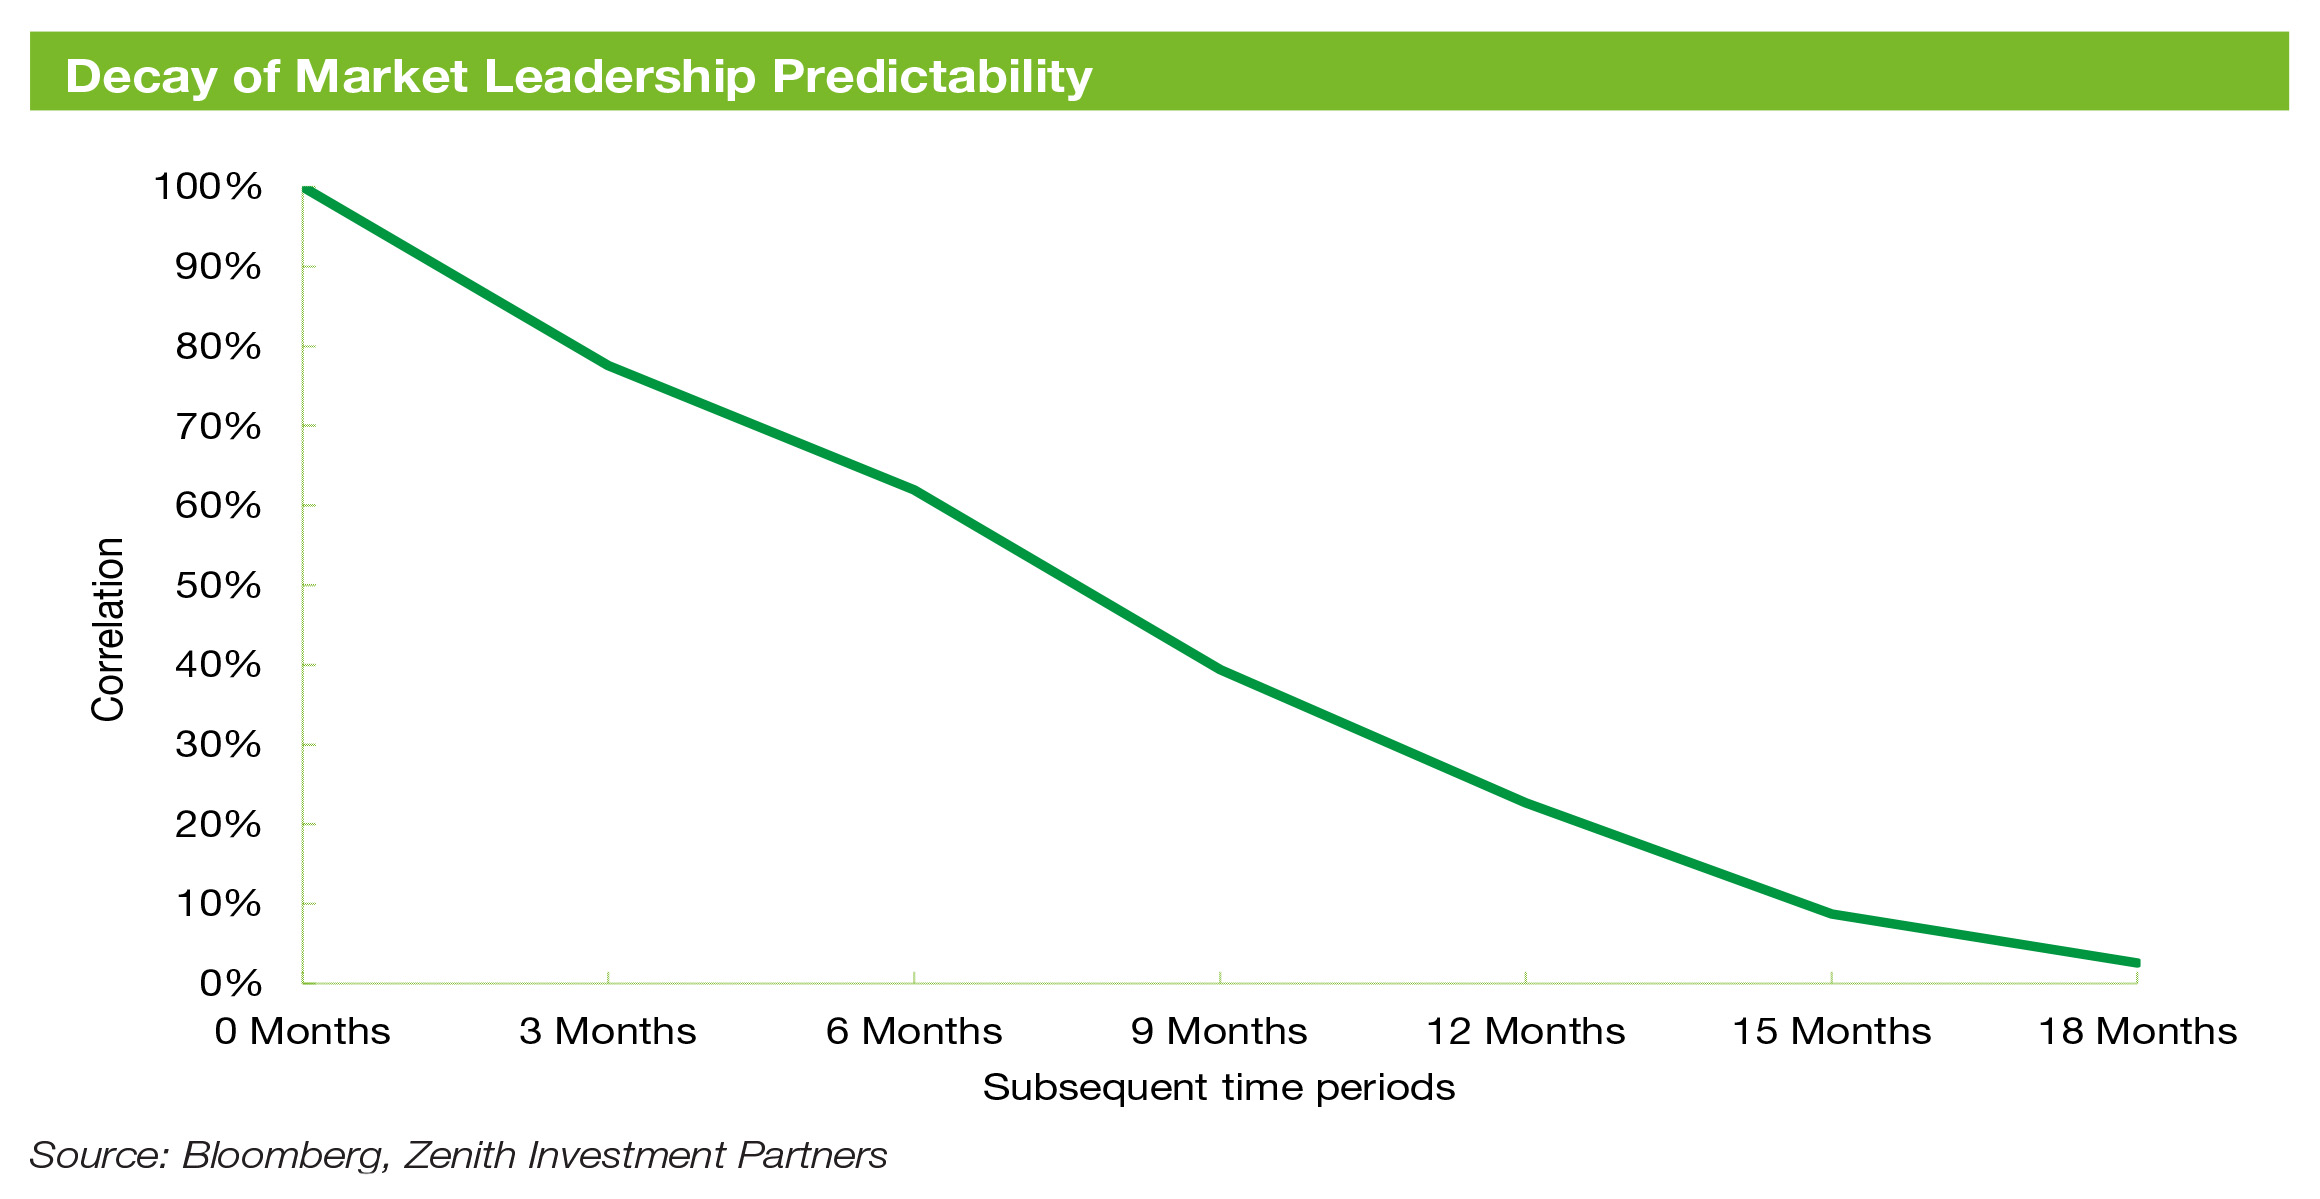
As shown above, the correlation between market leadership now and in the future is significantly higher in the short term and decays incrementally. This suggests that current market leadership regimes are expected to persist in the near term. However, the current market regime has limited predictive power over longer periods.
Investors in actively managed Australian equities funds can breathe easy knowing that the current narrow market leadership environment will eventually pass, with a return to a broader market regime that is more conducive to excess return generation.
Market leadership is not the only thing that has narrowed
Over the past 10 years, a low RBA target cash rate has seen investors shy away from cash and turn to other asset classes for income. However, in light of the RBA’s 12 rate hikes within the space of 13 months, should investors be rushing back to cash for income?
The chart below shows the annualised dividend yield of the S&P/ASX 300 Index relative to the RBA target cash rate.

Until May 2022, the S&P/ASX 300 Index dividend yield provided a significant buffer relative to the RBA target cash rate. However, considering the chart above, the income generated by both asset classes has narrowed to comparable levels. This convergence has continued with the RBA raising the target cash rate to 4.1% in June 2023.
Cash is king?
With respect to income yield, how do Australian equities compare against the other asset classes?
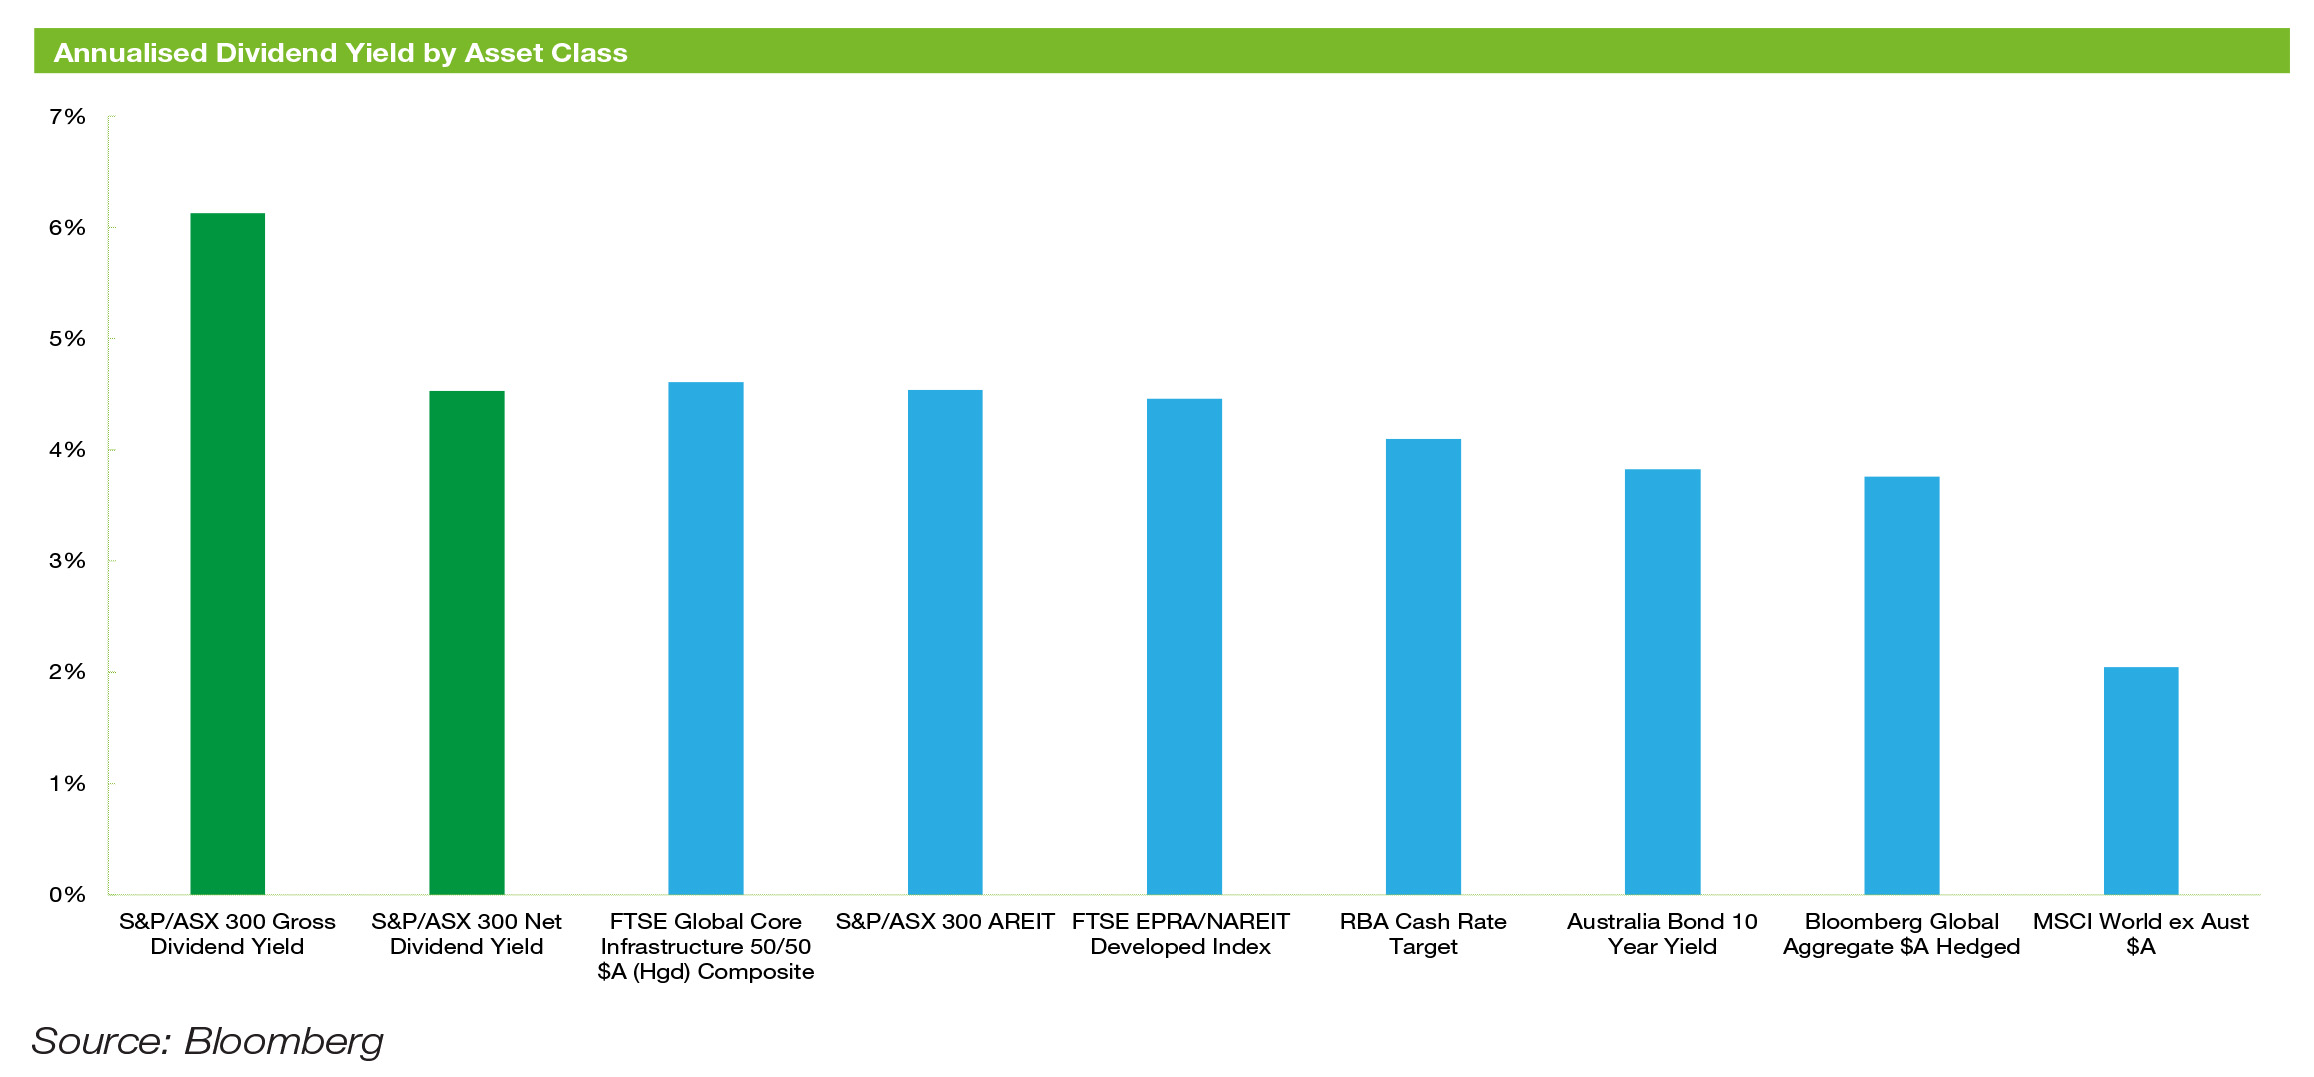
As at June 2023, Australian equity investors with a 0% effective tax rate received the highest yield of all asset classes at 6.1% p.a. This includes franking credits distributed by locally-listed companies as part of the imputation system. In contrast, the international equity market, (as represented by the MSCI World ex- Australia Index), only generated a dividend yield of 2.1% p.a.
Overall, the Australian equity market provided a favourable dividend yield on an after-tax basis in comparison to other asset classes.
What’s the real yield?
Australia is facing the highest level of inflation in 33 years, peaking at 7.8% in December 2022 and remaining at a comparable level at the time of writing. The chart below shows the rapid rise in inflation that has occurred domestically.

With inflation at elevated levels, real wealth has eroded significantly. While the 4.1% p.a. risk-free rate of return from the RBA target cash rate appears attractive, investors would see their capital deteriorate in real terms by holding cash.
The S&P/ASX 300 Index’s gross yield (grossed up to include the benefits of franking credits) has maintained a significant gap above the RBA target cash rate, highlighted by the chart below.

Despite inflation exceeding the yields of all asset classes in recent times, Zenith notes that the gross yield of Australian equities has comfortably outpaced inflation historically. In contrast, it is apparent that cash has historically returned a negative real yield.
Steady, high income and a growing capital base, is this achievable?
Through the following real world worked example, Zenith demonstrates the income and capital growth outcome delivered by a $10,000 investment in Australian equities compared to an investment in cash. We have assumed an investor withdraws their dividends/income annually and leaves the capital to grow each year. The chart below summarises the outcomes.

By the end of the period, an investment in Australian equities would have earned a total of $6,937 in income versus $1,518 from cash. Additionally, capital from an investment in Australian equities grew by $4,569 compared to $0 with cash over the same time frame.
How variable is your income?
While is it broadly accepted that equities are a higher risk asset class compared to cash and bonds, it might surprise many to find that the reverse is true for the variability of income received from the respective asset classes. This is particularly the case from an Australian equity investor’s perspective.
The chart below shows the average income return per year against the volatility of income (as measured by the standard deviation of income returns) for the RBA target cash rate, Australian bonds and Australian equities.
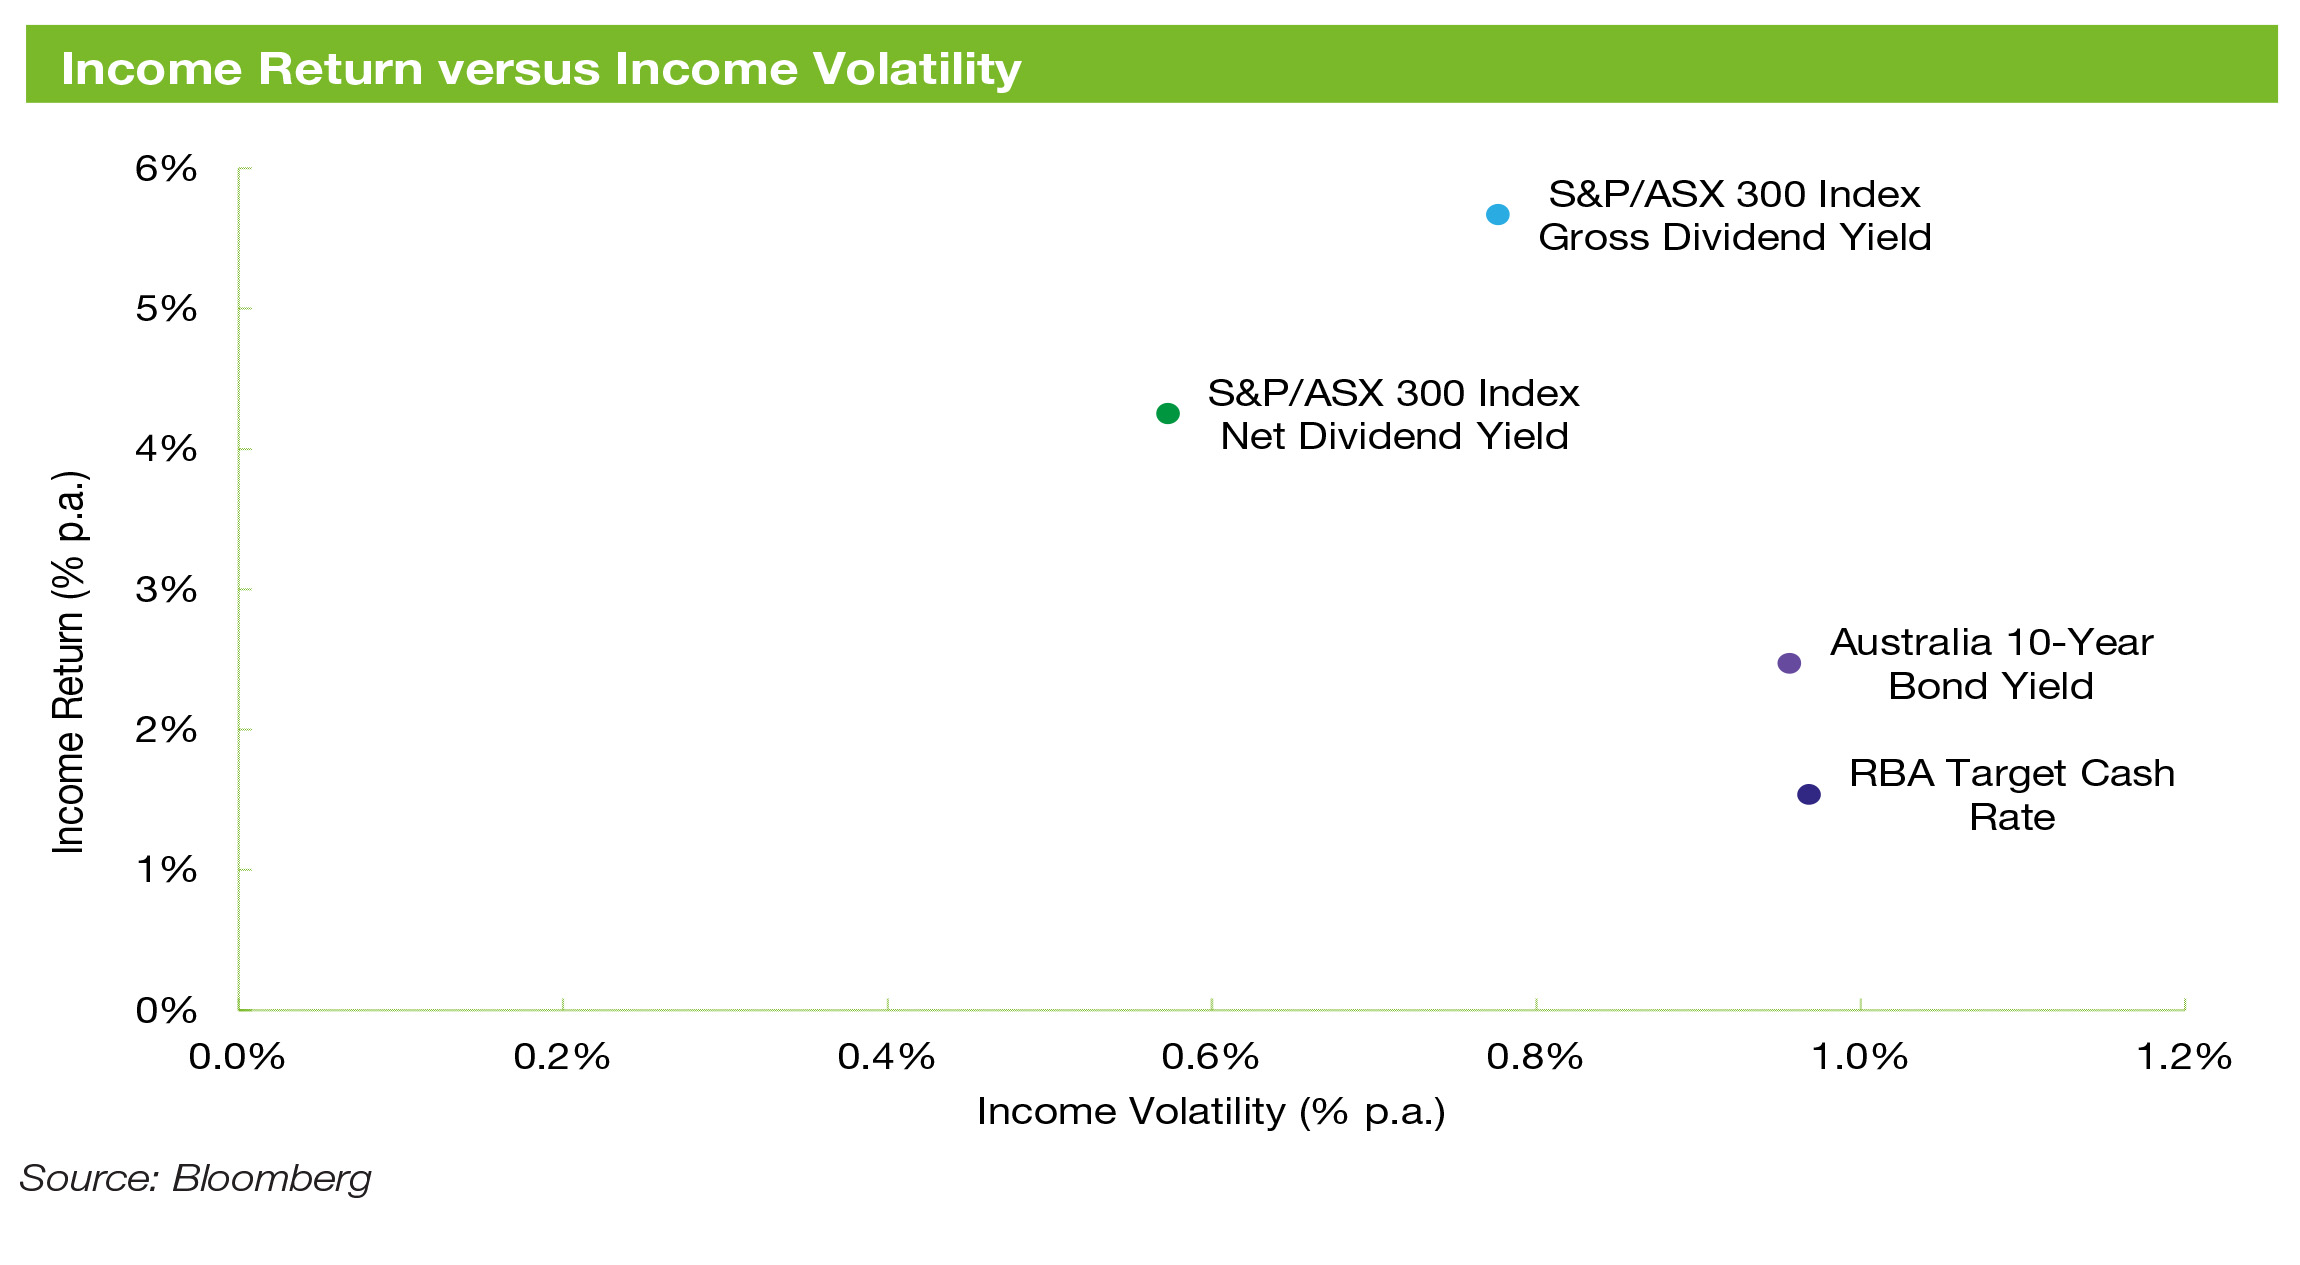
Over the past 10 years, the S&P/ASX 300 Index (grossed up for franking) achieved 5.7% p.a. in income with associated income volatility of 0.8% p.a. In contrast, cash or bonds earned an income of 1.5% p.a. and 2.5% p.a., respectively, with corresponding income volatility of 1.0% p.a. for both asset classes.
Zenith believes the key driver of the consistent dividend income derived from Australian equities is due to the imputation system, which incentivises companies to distribute their earnings to investors.
Gilding the lily?
Through our analysis, it is apparent that a passive exposure to Australian equities provides strong investment outcomes for an income focused investor. However, can active management improve upon these already attractive outcomes?
Over the last 10 financial years, Zenith-rated equity income funds had an average income return ranging between 4.7% p.a. and 9.4% p.a., on a net return basis[1]. Over the same period, the S&P/ASX 300 Index had an average net dividend yield of 4.3% p.a., comparably lower than all of Zenith’s rated managers.
Through the same $10,000 analysis we conducted above, we compared the income and capital growth returns of the average Zenith-rated equity income fund with the benchmark. The outcomes are summarised in the chart below.
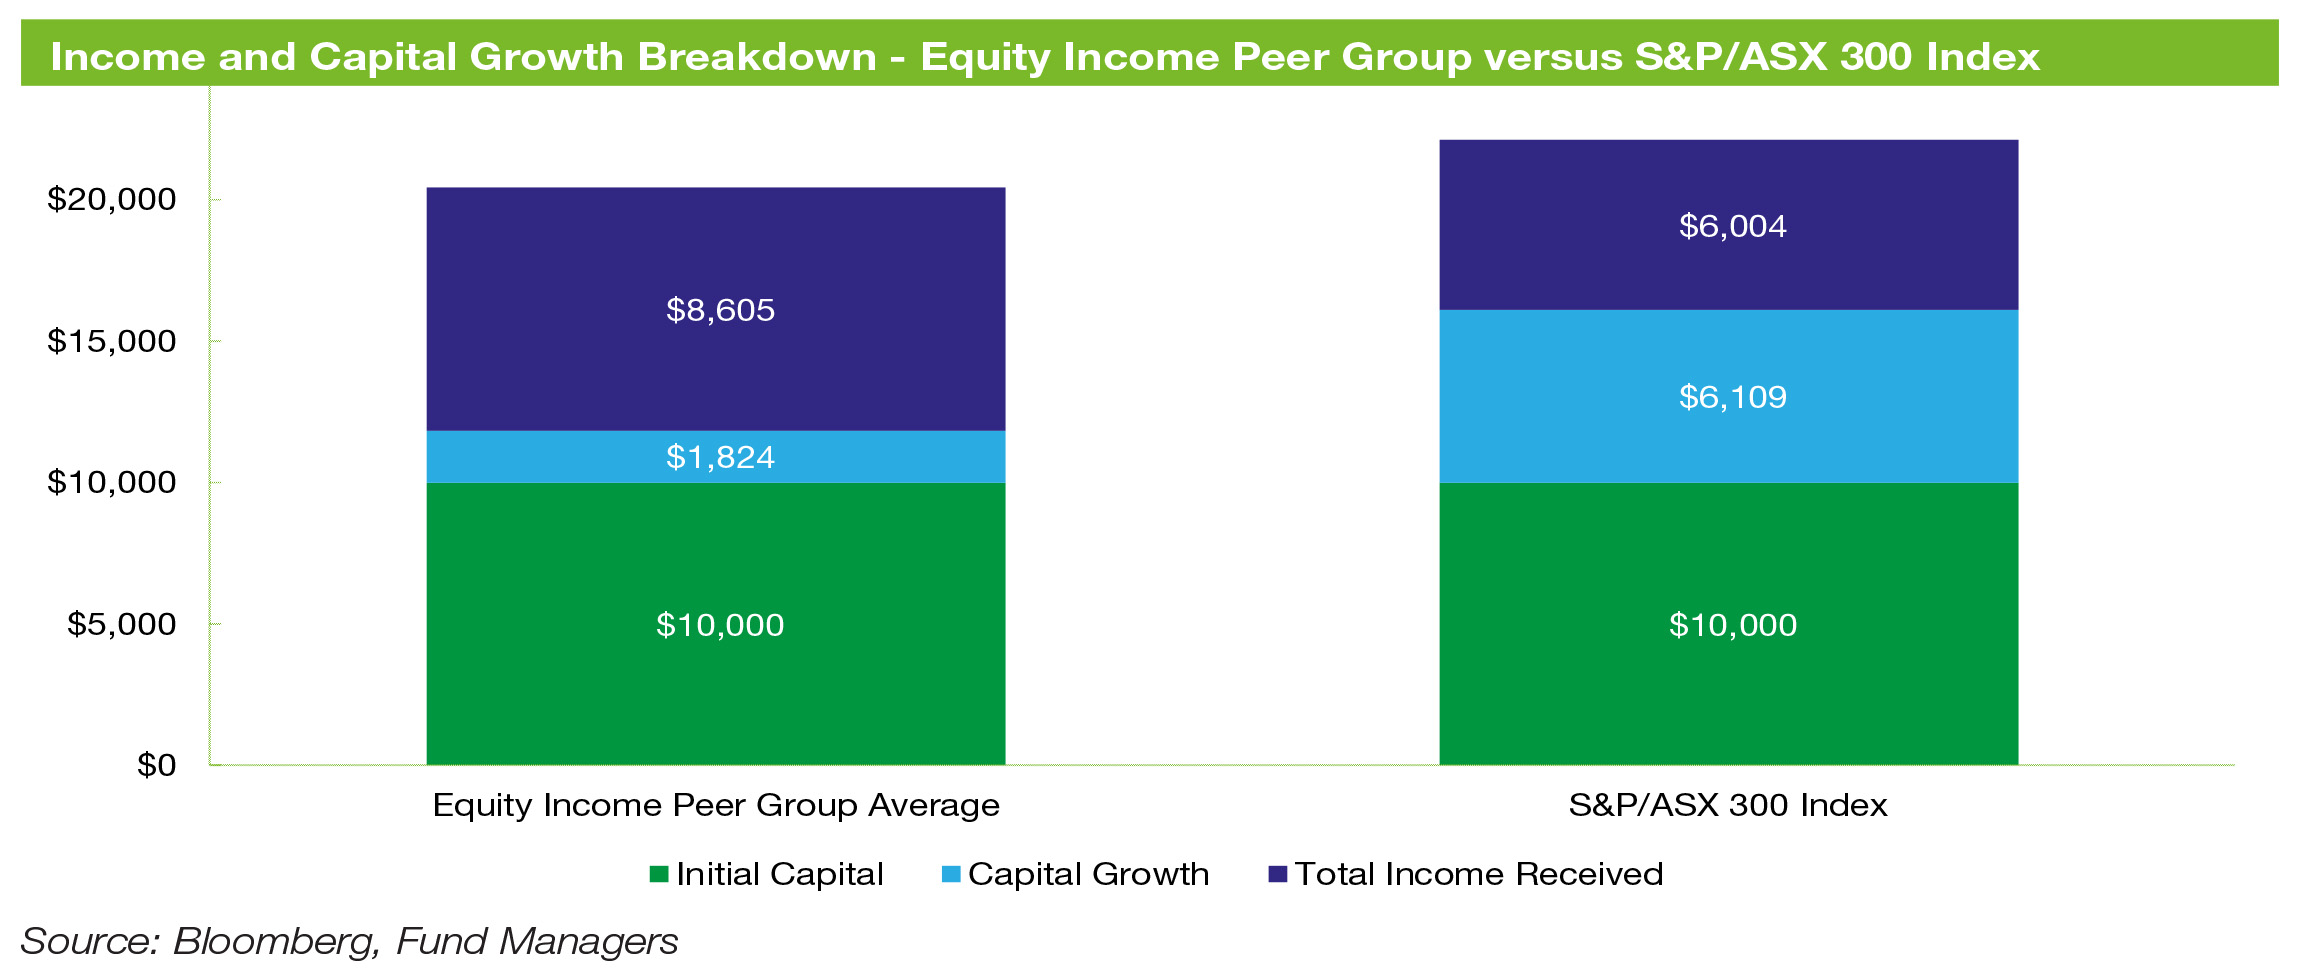
Over the ten-year period ending 30 June 2022, investors in the average active equity income fund received total income of $8,605 whilst growing capital by $1,824. In comparison, an investment in the S&P/ASX 300 Index would have generated income of $6,004 and capital growth of $6,109.
The lower capital growth can be explained by two key factors:
- Higher income that is not reinvested reduces the ability for capital to compound.
- The lower market sensitivity of equity income funds, which are focused on maintaining a stable capital base, underperform the benchmark in rising markets. The equity income peer group exhibited an average market sensitivity factor (beta) of 0.9.
In Zenith’s opinion, actively managed equity income products provide investors with a tailored investment solution.
——-


