
Advisers need to understand the investment case for global growth equities, the importance of structural growth and earnings growth to share price growth, and the importance of the S-Curve.
Growth investors generally focus on those companies with sustainable above average growth, those that exhibit high levels of profitability and earnings growth ahead of their peer group. Growth managers tend to look to the future and typically invest in companies that have a solid earnings outlook, even if the share price appears expensive in terms of metrics such as the company’s price-to-earnings (P/E) ratio or price to book (P/B) ratio – the investor is willing to pay more today for a company’s future cash flows.
The characteristics of a typical growth company are as follows:
- high P/E and P/B ratios
- low or no dividends – earnings are reinvested to grow the business
- high earnings growth.
A growth style investment tends to do best in buoyant market conditions; it would generally outperform the market when share prices are rising. Growth stocks also tend to do well when interest rates are low.
Conversely, growth investments tend to lose value in a bear market, often falling faster and harder. Growth funds are generally expected to offer the potential for higher returns; however, growth stocks and funds can be more volatile and may represent a greater risk when compared to other investment styles.
Investors need to remember that in any market environment, earnings growth drives stock prices and those companies producing great earnings growth can continue to do so through any cycle. While the result may not be linear, it will happen over time.
Equity markets can be like a game, one with very few winners and lots of losers. In this sense, equity markets are different to other asset classes; bonds return to par value and currencies mean revert.
The S-Curve and picking winners
While a focus on today’s winners and losers is important, picking the winners (and losers) over the medium to longer term is more critical. While it might sound simple, when several companies are vying for supremacy in an industry, which is likely to prevail and deliver solid returns to shareholders?
The S-curve tracks how a company or industry grows over its lifecycle. There comes a point in a lifecycle when growth inflects, driven by a structural change. It is the tailwind created by the structural change that allows a company to deliver and create wealth.
When it comes to the world’s most consistent compounders, a long runway of earnings growth that’s backed by a multi-year or decade structural change is incredibly important. Earnings durability, backed by an impressive total addressable market, is key.
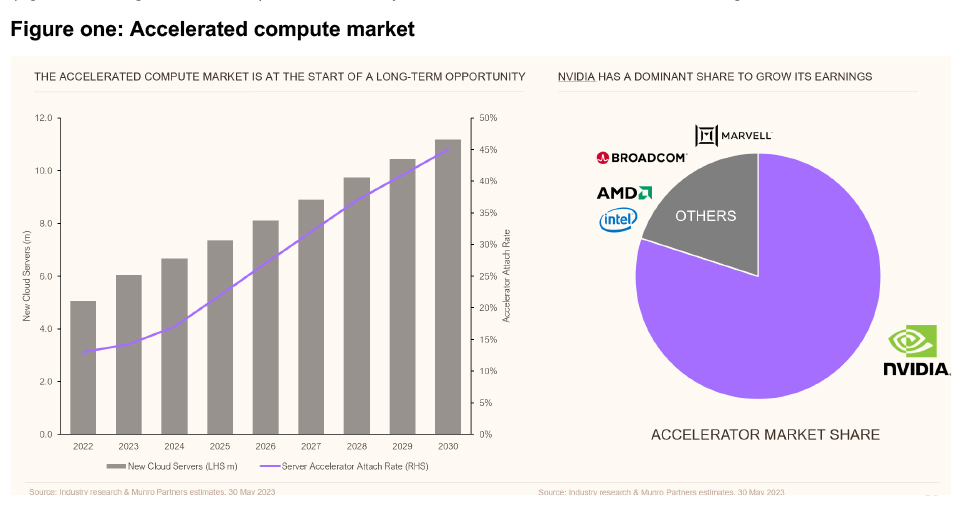
This can be illustrated by the accelerated compute market, which global growth expert Munro Partners believes is at the beginning of its S-Curve (figure one). As illustrated on the left side of figure one, the increase in new cloud servers has resulted in an increase in the accelerated attach rate; this market was valued at US$15.1 billion in 2022 and is expected to grow at a steady rate of around 37.4 percent from 2023-2030[1]. These chips handle deep learning tasks by processing massive amounts of data at lightning speed, ensuring real-time applications run smoothly.
Nvidia has regularly made headlines in recent times. Its dominant share of the accelerator market (figure one, right hand side) illustrates why it has been of increased interest to growth investors.
To recognise the winners, investors need to identify the next round of structural changes and the companies that will benefit from them. To maximise investor returns, this needs to be as close to the start of the S-Curve as possible.
A 2017 study[2] examined every company that listed on the US share market over previous last 90 years and analysed the outcome had you bought and held every single one of those 26,000 companies. Compared to Treasury Bills, the analysis found:
- More than 50 percent of every company listed in the US, or over 14,000 companies, eventually have a valuation of zero
- The next 11,000 companies only make enough to offset what those 14,000 lose
- Just 1,000 companies – or less than 5 percent of all statistical observations – to make up the entire $US45 trillion of wealth created in the US share market
- The top 4 percent of companies account for all of the net shareholder wealth creation since 1926.
As this study illustrates, it has always been just a few stocks driving the share market – the difference lies in the structural changes driving the market at that time. This study has subsequently been updated to examine global markets. The new study covered 64,000 global companies from 43 countries over 30 years.
The results of the updated study found that of the US$76 trillion shareholder wealth created by 63,785 companies from 1990 to 2020[3]:
- the top 5 companies (0.008%) accounted for 10.3 percent of returns
- the top 159 companies (0.25%) accounted for 50 percent of returns
- the top 1,526 companies (2.39%) accounted for 100 percent of returns
- the other 62,259 companies collectively matched US Treasury Bills.
In total, 25,441 or 39.9 percent of companies generated modest positive wealth; this barely offset the wealth destruction of 36,818 or 57.7 percent of companies. Or, to look at it another way, just 2.4 percent of global listed companies accounted for market performance above a short-term government security. This reinforces the importance of focusing on winners, where structural change is key: harnessing structural change rather than macroeconomics is the key determinant that creates those few winners.
So what about macroeconomics?
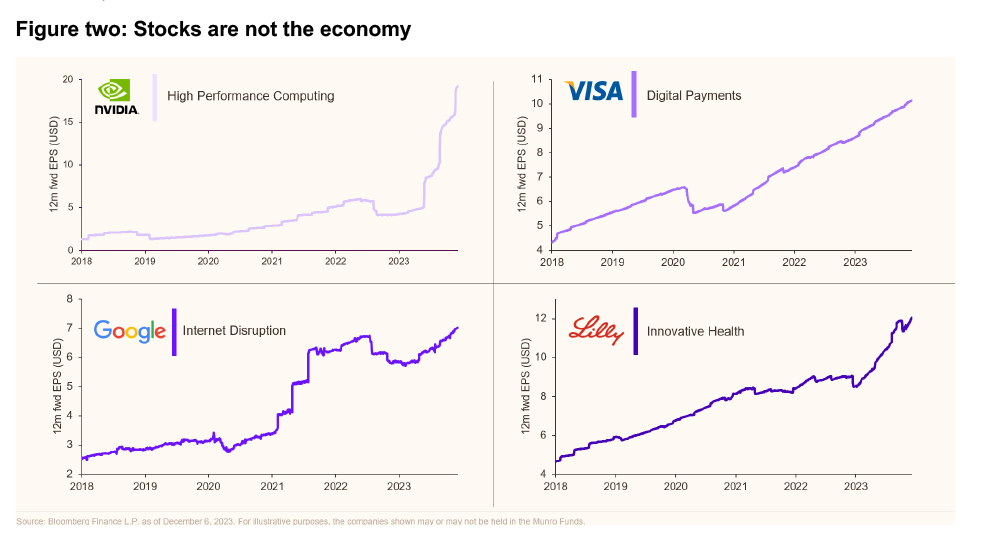
While macroeconomic factors can evidently influence markets and individual companies in the short term, it’s important to remember that stocks are not the economy (figure two). Irrespective of what’s happening in economies, stocks revert to following their earnings. For investors focused on earnings growth and structural change, individual macroeconomic factors such as inflation or rates may slow the economy but is less likely to impact those winners at the forefront of structural change. For example, the four companies illustrated in figure two exhibited accelerated earnings growth across 2023 despite macroeconomic headwinds.
Areas of Interest
As a growth investor, Munro Partners identifies sustainable growth trends that are under-appreciated, not well understood and mispriced by the market, and in the team’s view, the winners and losers. The team believes that the investment success stories of the future will emerge from within the big technological and structural changes affecting global society and focuses on identifying and understanding these trends, which it calls its Areas of Interest (AoIs).
Innovative health
There’s been a global revolution in healthcare as exciting new technologies like machine learning, artificial intelligence, virtual reality and genomics transform all areas of traditional healthcare. This ranges from diagnostics to disease prevention, drug treatments to aged care.
Within the global healthcare landscape, structural change and innovation and the resulting investment opportunities are shaped by three key drivers:
1. Demographic change
Populations are ageing across the developed world. Life expectancy for a baby born in Australia in 2020-2022 was 81.2 years for males and 85.3 years for females. In 1992, the equivalent figures were 74.5 and 80.4 years respectively[4].
ABS data[5] shows that eight in ten (or 81.4 percent) of Australia’s population had at least one long-term health condition in 2022. Further, one in two (49.9 percent) people had at least one chronic condition. Disease prevention, treatment, and lifestyle management for the older members of society is a massive and growing subsector of the healthcare industry.
2. New technologies
Science, academia and healthcare companies ranging from start-up biotech pioneers to global pharmaceutical giants are inventing new products and processes to diagnose, treat or cure diseases or make healthcare provision more efficient. AI and the internet of things are making hospitals smarter while the use of predictive analytics can better manage patient volumes and staff-to-patient ratios.
Micro robotics is used in surgical treatments previously considered dangerous and invasive. Innovations in genomics and gene therapy techniques may make possible a new era of personalised medicine instead of generic treatment plans for all patients with the same diagnosis. These and other innovations offer a fascinating range of potential opportunities for long-term growth investors.
3. The rising cost of healthcare
Global spending on health reached a staggering 10.34 percent of global GDP. However, health spending per capita in high income countries is considerably higher at 13.3 percent of GDP; by comparison, low income countries spend an average of 5.25 percent[6].
Consequently, technological systems that reduce the cost of providing healthcare are fertile areas to invest in.
Decarbonisation and the climate opportunity
Climate is at the very start of its S-Curve, with many new climate technologies still early in the adoption phase and therefore having the potential for significant growth.
The June 2023 update of the IEA Government Energy Spending Tracker found US$1.34 trillion had been allocated by governments for clean energy investment support since 2020[7]. Clean energy investment rose nearly 25 percent from 2021 to 2023, outpacing growth in fossil fuels in the same period. This was spent on renewable power, electric vehicles and other technologies to cut the global energy system’s dependence on fossil fuels.
Government and corporates are focused on lowering their carbon footprint to meet net zero emission targets and it is estimated that US$50-100 trillion will be spent over the coming decades to achieve this. It’s important to note that the “zero carbon” 2050 target does not mean emitting any more carbon; it means emitting no carbon.
Ambitious political commitments are being mirrored in the corporate world, which rather than taking a ‘wait and see’ approach, is transitioning to a low carbon future independently of government mandates. Many corporations are changing their behaviour – or promising to – in the face of overwhelming demand for ESG and other socially responsible initiatives from customers, employees, members and shareholders.
Globally, fighting climate change is about far more than just clean energy and electric vehicles; there are four structural categories from which will emerge the climate success stories that will enable the decarbonisation of our planet. These are:
- Clean energy: companies at the forefront of renewable energy generation covering wind, solar and renewable diesel
- Energy efficiency: companies at the forefront of insulation products, electrical switches, lighting and metering technology
- Clean transport: companies benefitting from the growth of electric vehicles, battery technology and alternative transportation
- Circular economy: Companies most likely to benefit from efforts to improve recycling, alternative packaging materials and management of wastewater.
As always, at the individual stock level, there will be only a handful of climate winners and a long tail of losers. Many among the rash of global climate start-ups won’t survive, and a raft of established businesses – including many corporate household names – will need to adapt or perish. The airline and automotive industries are particularly vulnerable, along with fossil fuel producers and the industries that rely on them.
Growth investing presents a compelling strategy for investors aiming to maximise their returns by focusing on companies with high potential for substantial earnings expansion. This investment approach offers several distinct advantages. These include the potential for significant capital appreciation, benefiting from innovation-driven sectors, and capturing the gains from growth companies at the beginning of their S-Curve, especially those that can transform industries.
——–


