
Key points
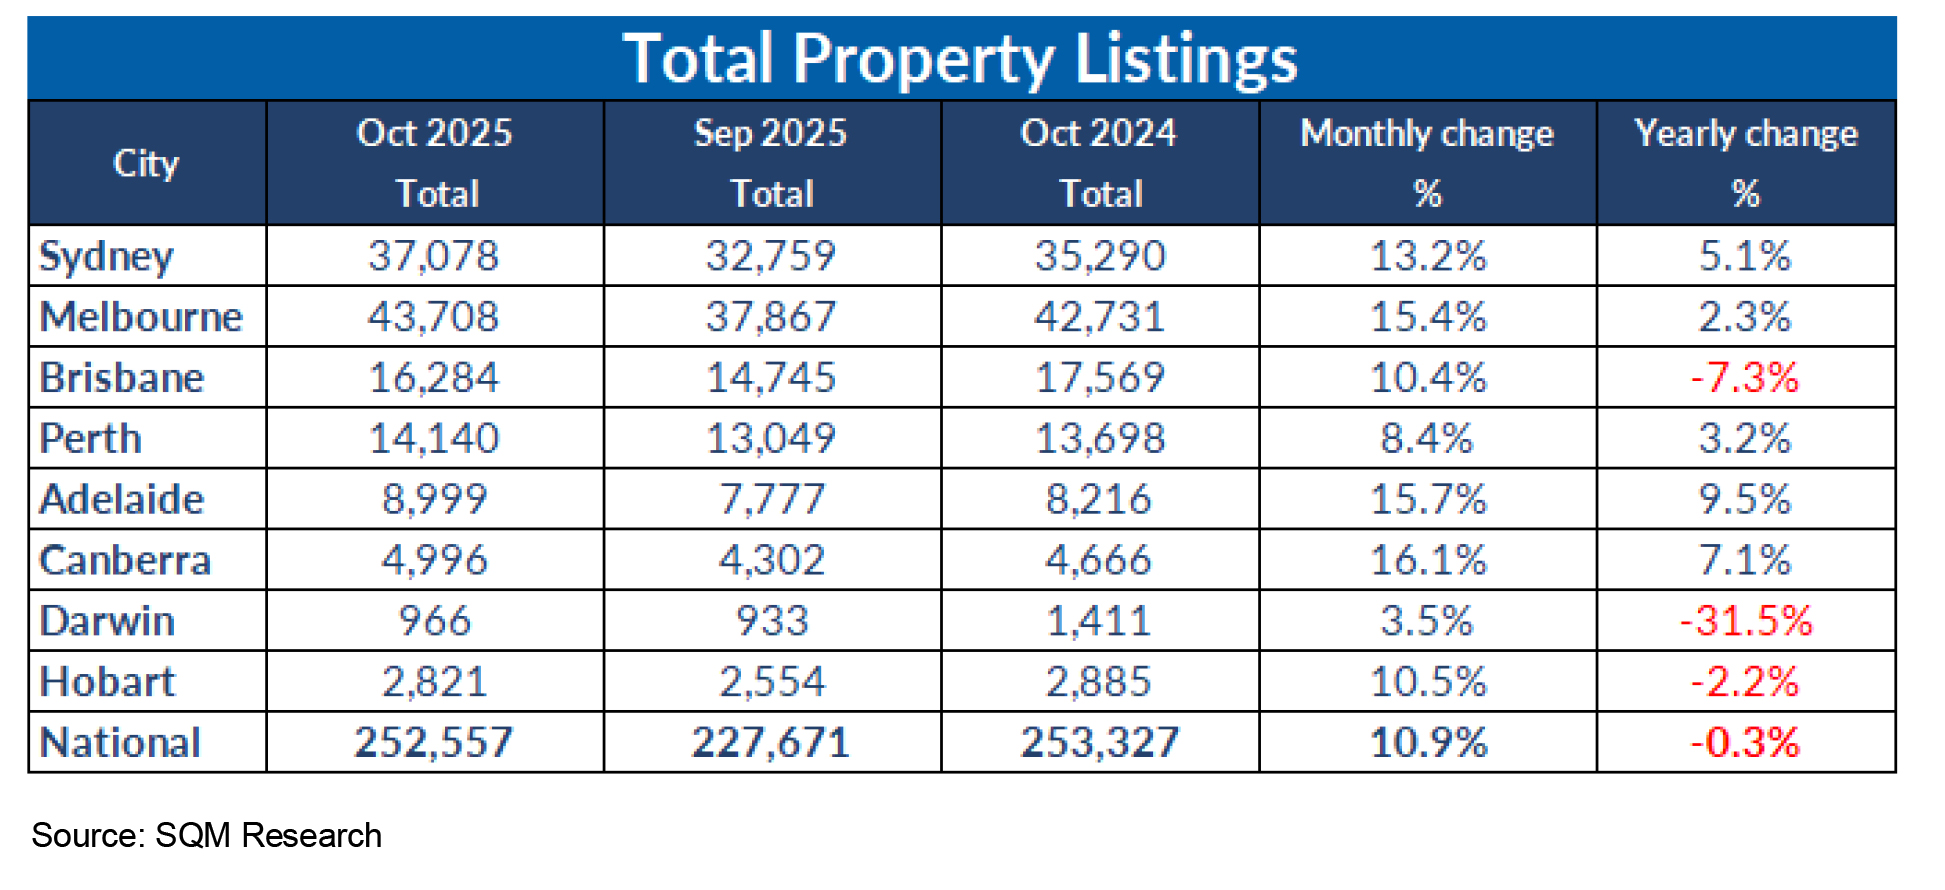
- National residential listings surged 10.9% month-on-month in October, reaching 252,557, but remain 0.3% lower year-on-year.
- Sydney and Melbourne led the monthly lift, up 13.2% and 15.4% respectively, reflecting robust spring activity.
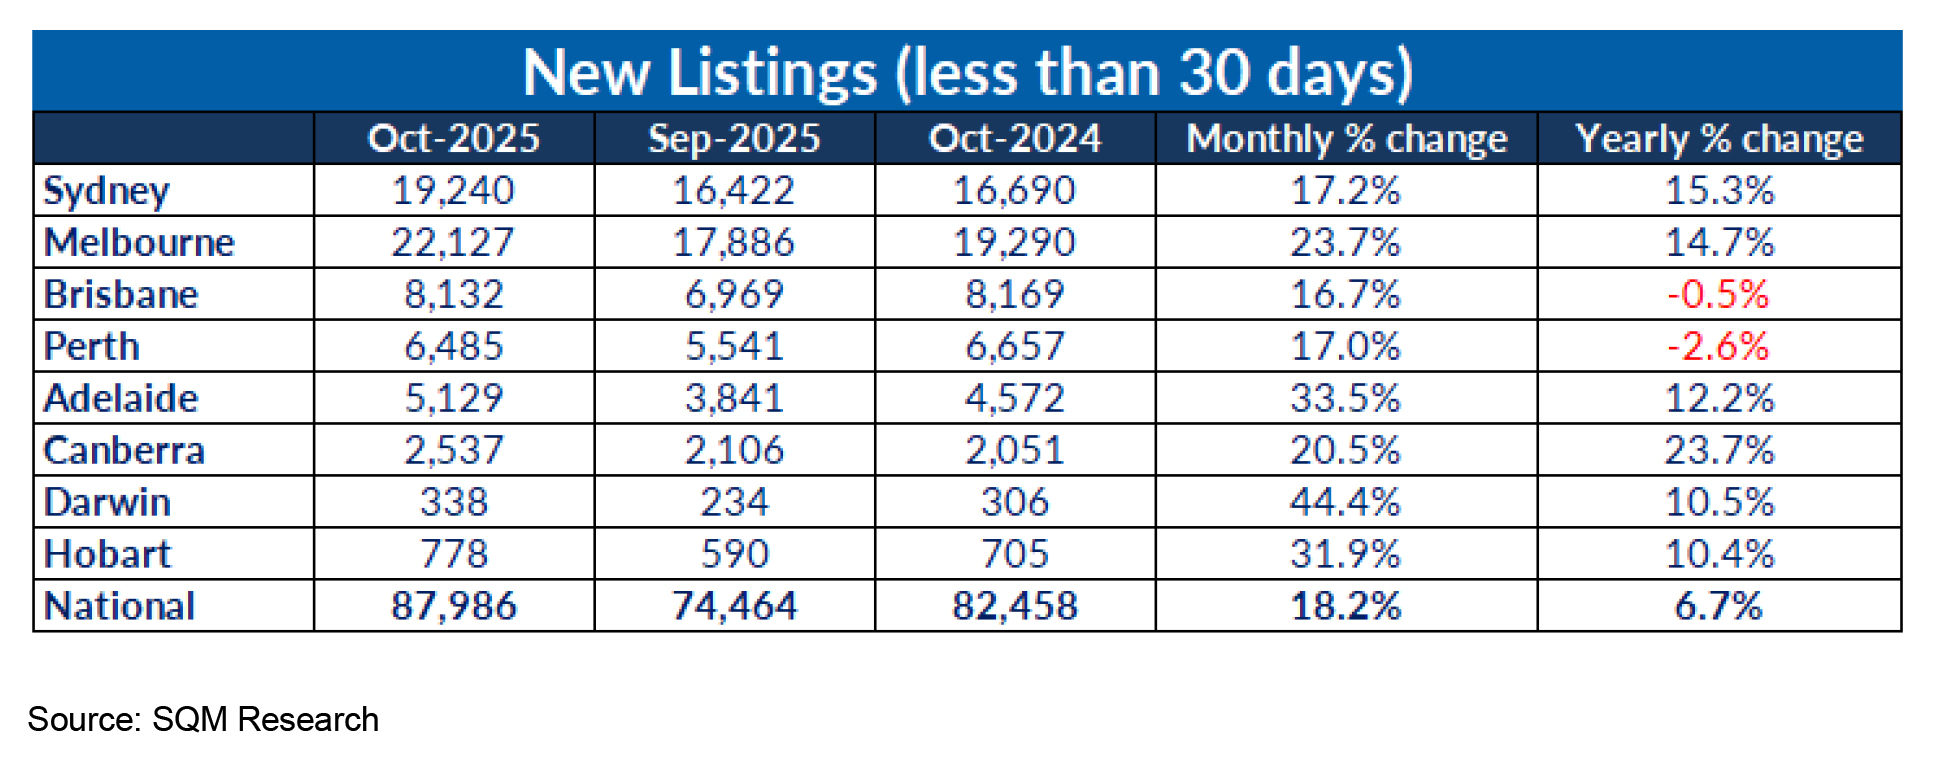
- New listings (<30 days) rose 18.2% nationally, driven by Melbourne (+23.7%) and Adelaide (+33.5%).
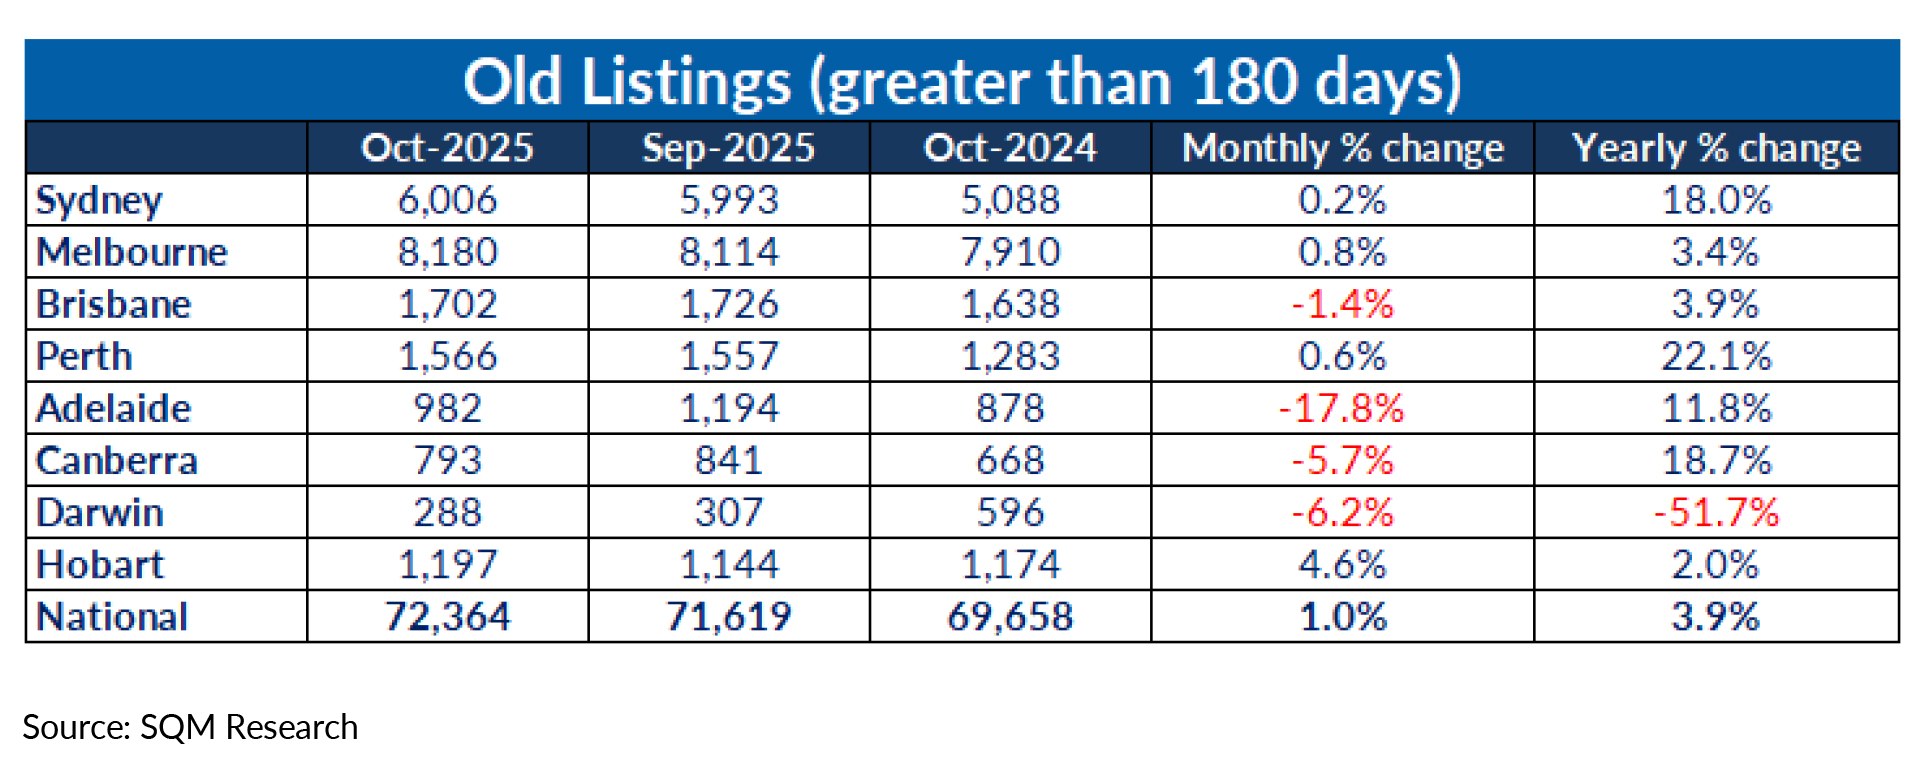
- Old listings (180 + days) edged up 1.0% month-on-month.
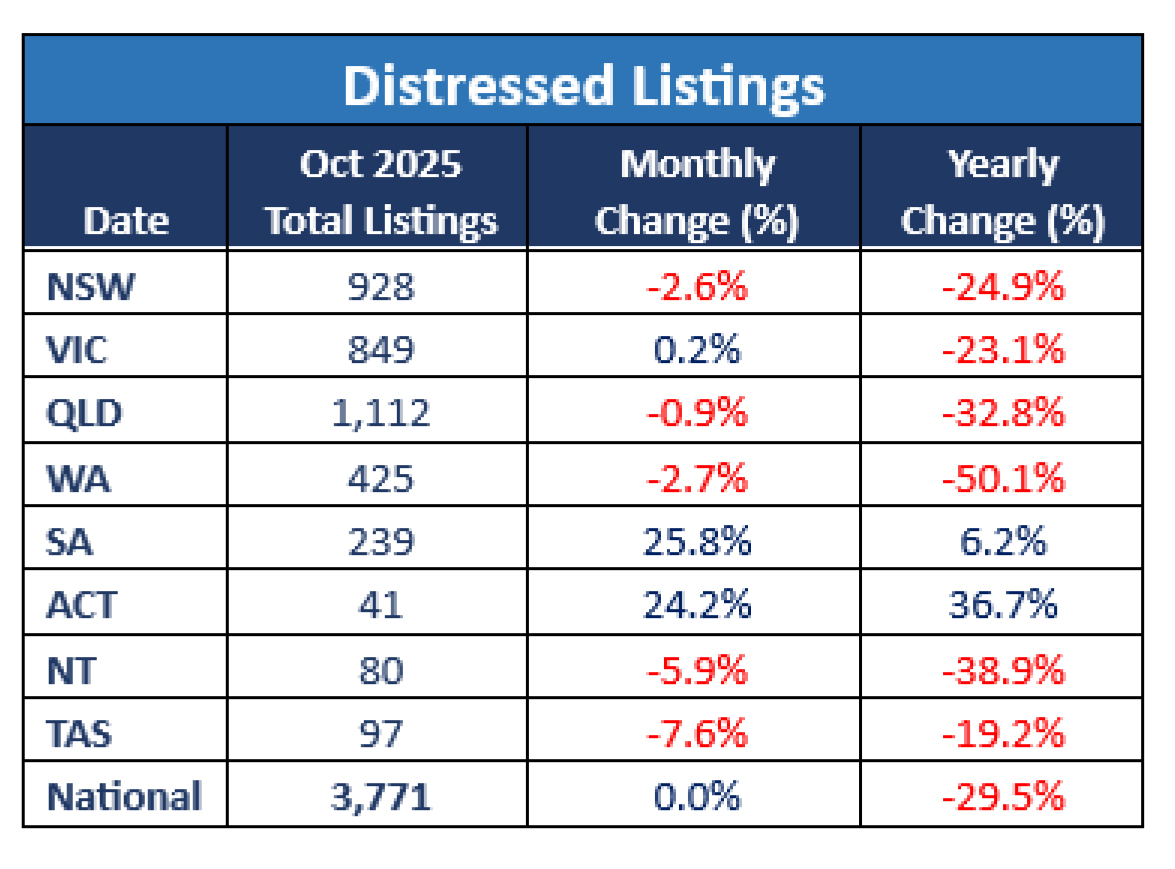
- Distressed listings held steady nationally but are down 29.5% year-on-year, with large declines in WA (-50.1%) and NSW (-24.9%).
- Asking prices continued to rise, led by Brisbane (+12.0%) and Perth (+10.2%) year-onyear growth in house prices.
Total listings
Australia’s housing market recorded a sharp lift in total listings through October 2025, signalling sellers’ renewed confidence as the spring selling season hit full stride. National listings rose to 252,557 dwellings, up 10.9% from September, only marginally below levels seen a year earlier.
Sydney listings rose 13.2% to 37,078, supported by strong new supply and steady buyer demand.
Melbourne surged 15.4% to 43,708, pushing above last year’s level by 2.3%—a sign of returning vendor confidence.
Adelaide and Canberra continued to climb, up 15.7% and 16.1% respectively, while Perth rose 8.4%.
Darwin’s listings inched up 3.5%, but remain sharply lower (-31.5% YoY), underscoring its long-term contraction in available stock.
New listings
Fresh stock under 30 days soared 18.2% month-on-month to 87,986 listings, extending spring’s momentum. Melbourne and Sydney led the charge, up 23.7% and 17.2%, respectively. Adelaide posted a remarkable 33.5% monthly increase, while Canberra and Darwin climbed 20.5% and 44.4%, indicating broad-based vendor engagement.
Year-on-year, national new listings were 6.7% higher, reversing months of subdued inflows. Sydney’s annual lift of 15.3% underscores rising confidence, while Melbourne (+14.7%) and Canberra (+23.7%) also recorded strong gains. Only Brisbane (-0.5%) and Perth (-2.6%) saw slight annual dips, reflecting localised market tightness.
This surge in fresh listings highlights both seasonal momentum and growing willingness among sellers to test buyer appetite as clearance rates stabilise and price expectations recalibrate.
Old listings
Aged stock (180 + days) increased modestly, rising 1.0% nationally month-on-month and 3.9% year-on-year, to 72,364 properties. The small uptick suggests most new listings are being absorbed efficiently.
Sydney’s old listings were steady (+0.2%), while Melbourne saw a marginal lift (+0.8%), reflecting relatively balanced conditions. Adelaide’s decline of 17.8% indicates brisk turnover and pricing alignment, and Canberra’s 5.7% fall also signals healthy buyer engagement.
Darwin’s aged stock plunged 51.7% year-on-year, underscoring the city’s limited supply and volatility.
Distressed listings
Distressed property numbers remained unchanged nationally in October but are down nearly 30% from a year earlier, pointing to improved household balance sheets and reduced mortgage stress despite higher interest rates.
Queensland (-32.8%), Western Australia (-50.1%), and New South Wales (-24.9%) led annual declines, while the ACT bucked the trend with a 36.7% rise YoY, following a 24.2% monthly increase—a small but notable shift reflecting isolated financial pressure pockets.
South Australia also recorded an uptick (+25.8% monthly), though from a low base.
Asking prices
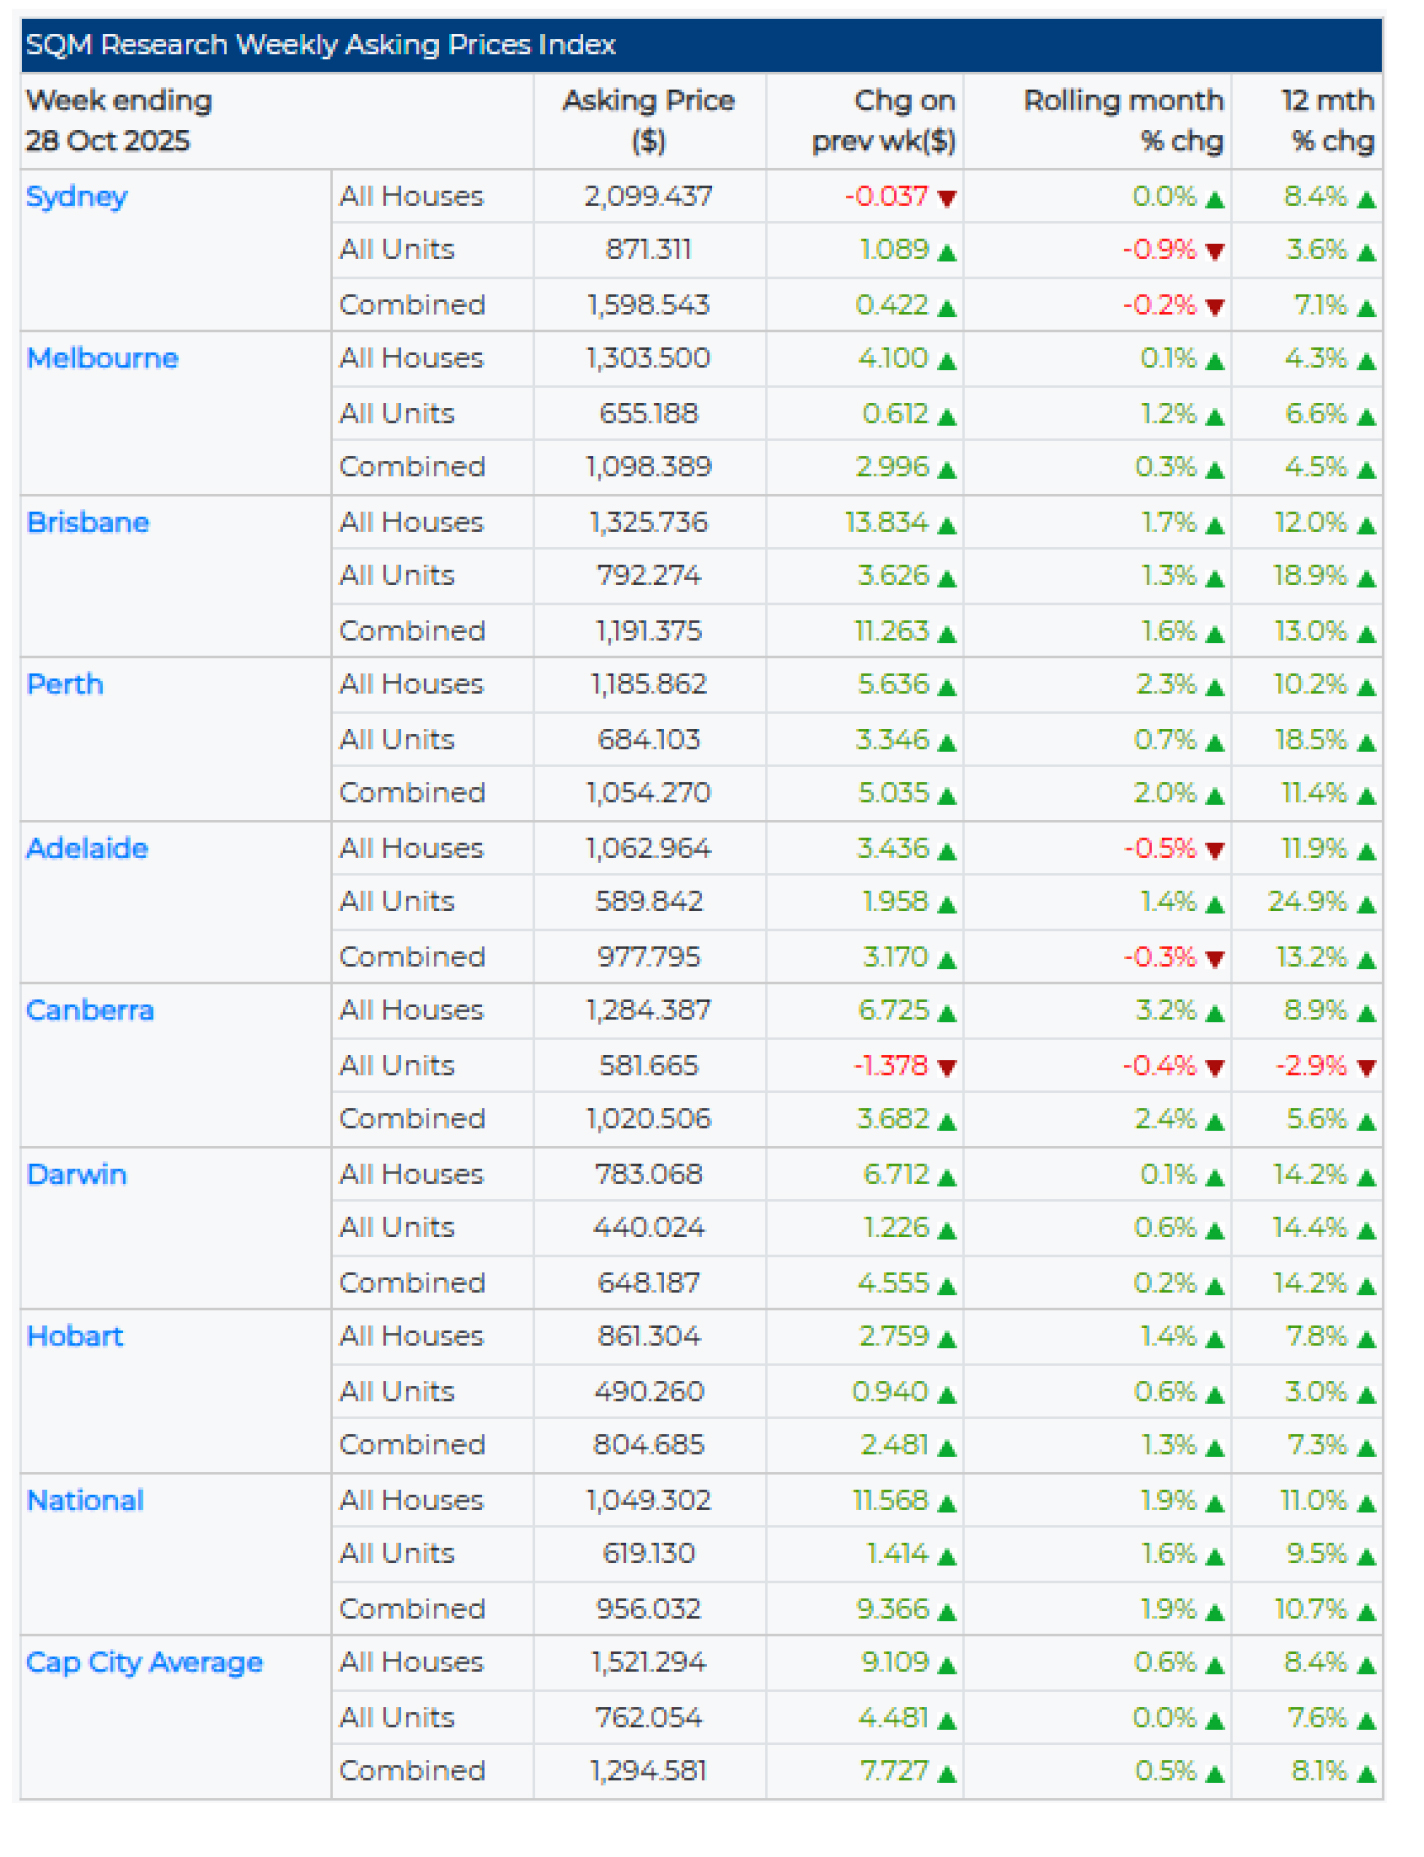
SQM Research’s Weekly Asking Prices Index for the week ending 28 October 2025 revealed continued upward momentum.
Nationally, asking prices rose 1.9% for houses and 1.4% for units over the month, with combined dwellings up 1.6% month-on-month and 9.7% year-on-year. Sydney house asking prices eased marginally (-0.04%) to $2.1 million yet remain 8.4% higher YoY.
Melbourne (+0.3% monthly, +4.3% YoY) and Brisbane (+1.7% monthly, +12.0% YoY) saw steady appreciation, while Perth recorded another strong month (+2.3% monthly, +10.2% YoY).
Adelaide and Canberra also posted healthy annual gains above 8%. Darwin remains the most volatile market, with house asking prices up 14.1% YoY.
Louis Christopher, Managing Director of SQM Research said: “The October surge in listings is a clear sign of renewed vendor activity heading into the final quarter of the year,” said Louis Christopher.
“We’ve seen a 10.9% national lift—an unusually strong result even for spring—suggesting sellers are more confident in finding buyers, particularly in Sydney, Melbourne, and Adelaide.”
“While total stock is still fractionally below last year’s level, the balance between new and old listings shows a healthier, more dynamic market. Distressed listings remain low nationwide, reinforcing that most homeowners are coping with current financial conditions.”
“We do, however, continue to watch Canberra closely. The lift in older and distressed listings there points to some market fatigue, possibly due to pricing mismatches. Overall, though, the market is functioning well—buyers are selective, and realistically priced homes are selling.”


