
Key points
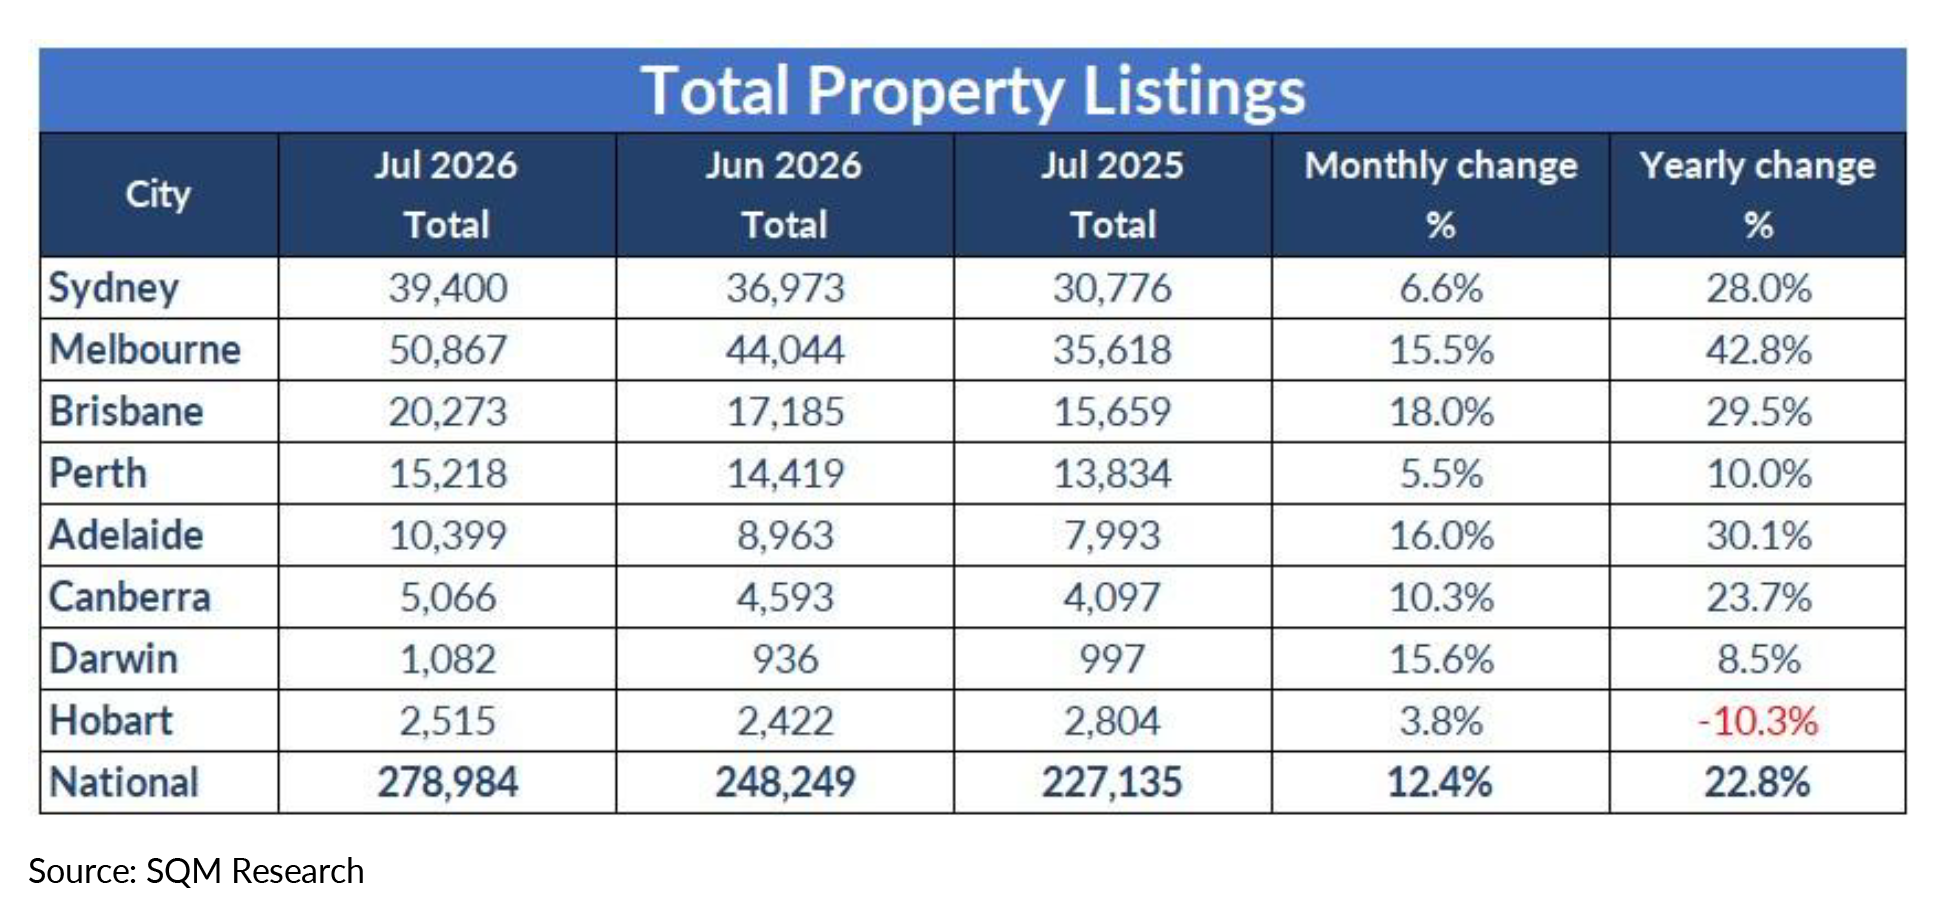
- National property listings rose 12.4% month-on-month in July to 278,984 dwellings.
- Total listings are now 22.8% higher than July 2025, marking the strongest annual increase in available housing stock in over a year.
- New listings increased 5.1% nationally, while old listings rose 8.1%, indicating both fresh supply and an accumulation of existing stock.
- Distressed listings increased 1.6% nationally and are now 0.9% higher than a year ago, the first annual increase in distressed stock in some time.
- Capital City asking prices fall 1.2% during the month.
Total listings
It what is considered an unseasonal change, Australia’s residential property market recorded another significant increase in supply during July, with total property listings rising 12.4% to 278,984 dwellings. The increase was broad-based across almost every capital city, pushing national listings 22.8% above levels recorded a year ago.
Melbourne recorded the strongest increase among the major capitals, with listings rising 15.5% over the month to 50,867 properties, now sitting 42.8% higher than July 2025.
Brisbane also posted another exceptional result, rising 18.0% to 20,273 listings, while Adelaide increased 16.0% and Canberra 10.3%, reflecting continued growth in available stock.
Sydney recorded a 6.6% monthly increase and is now 28.0% higher than a year ago.
Perth continued to add listings, increasing 5.5% over the month to 15,218 properties, with stock levels now 10.0% higher year-on-year after several months of improving supply.
Darwin recorded a strong 15.6% monthly increase, while Hobart rose 3.8%, although listings there remain 10.3% below July 2025 levels.
New listings
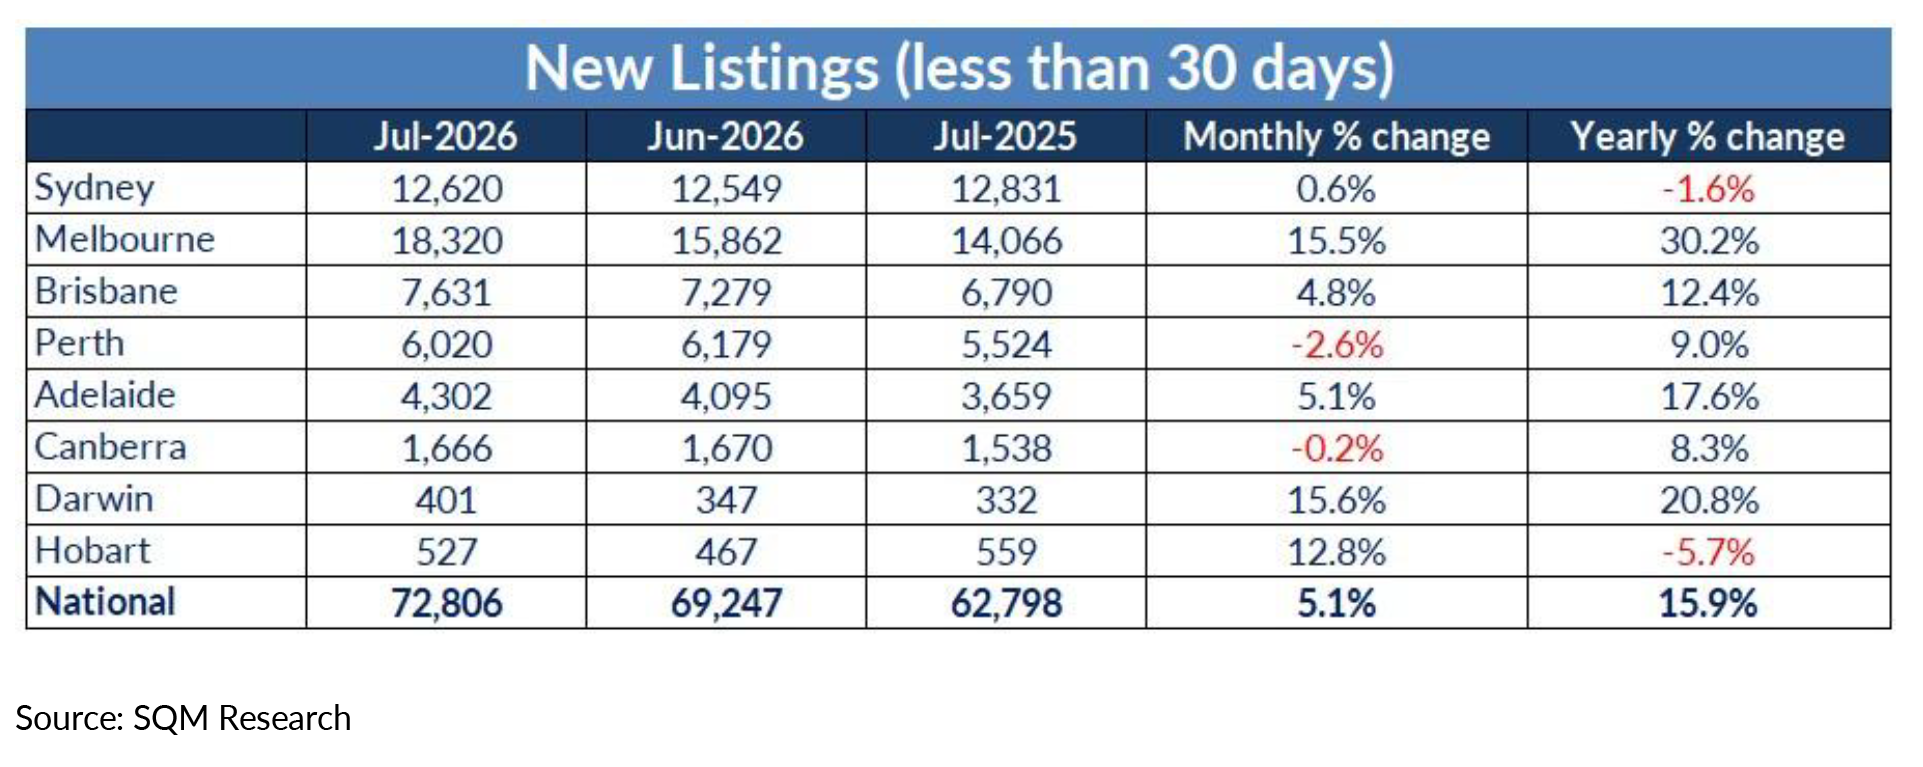
New listings increased 5.1% nationally during July to 72,806 dwellings, with fresh supply continuing to enter the market despite the winter season.
Melbourne (+15.5%) led the major capitals, followed by Brisbane (+4.8%), Adelaide (+5.1%) and Sydney (+0.6%).
Perth was the only major capital to record a modest decline (-2.6%), while Canberra was broadly unchanged (-0.2%).
Darwin recorded another strong increase in new listings (+15.6%), while Hobart rebounded 12.8% following June’s decline.
Nationally, new listings remain 15.9% higher than a year ago, indicating vendor activity remains well above 2025 levels.
Old listings
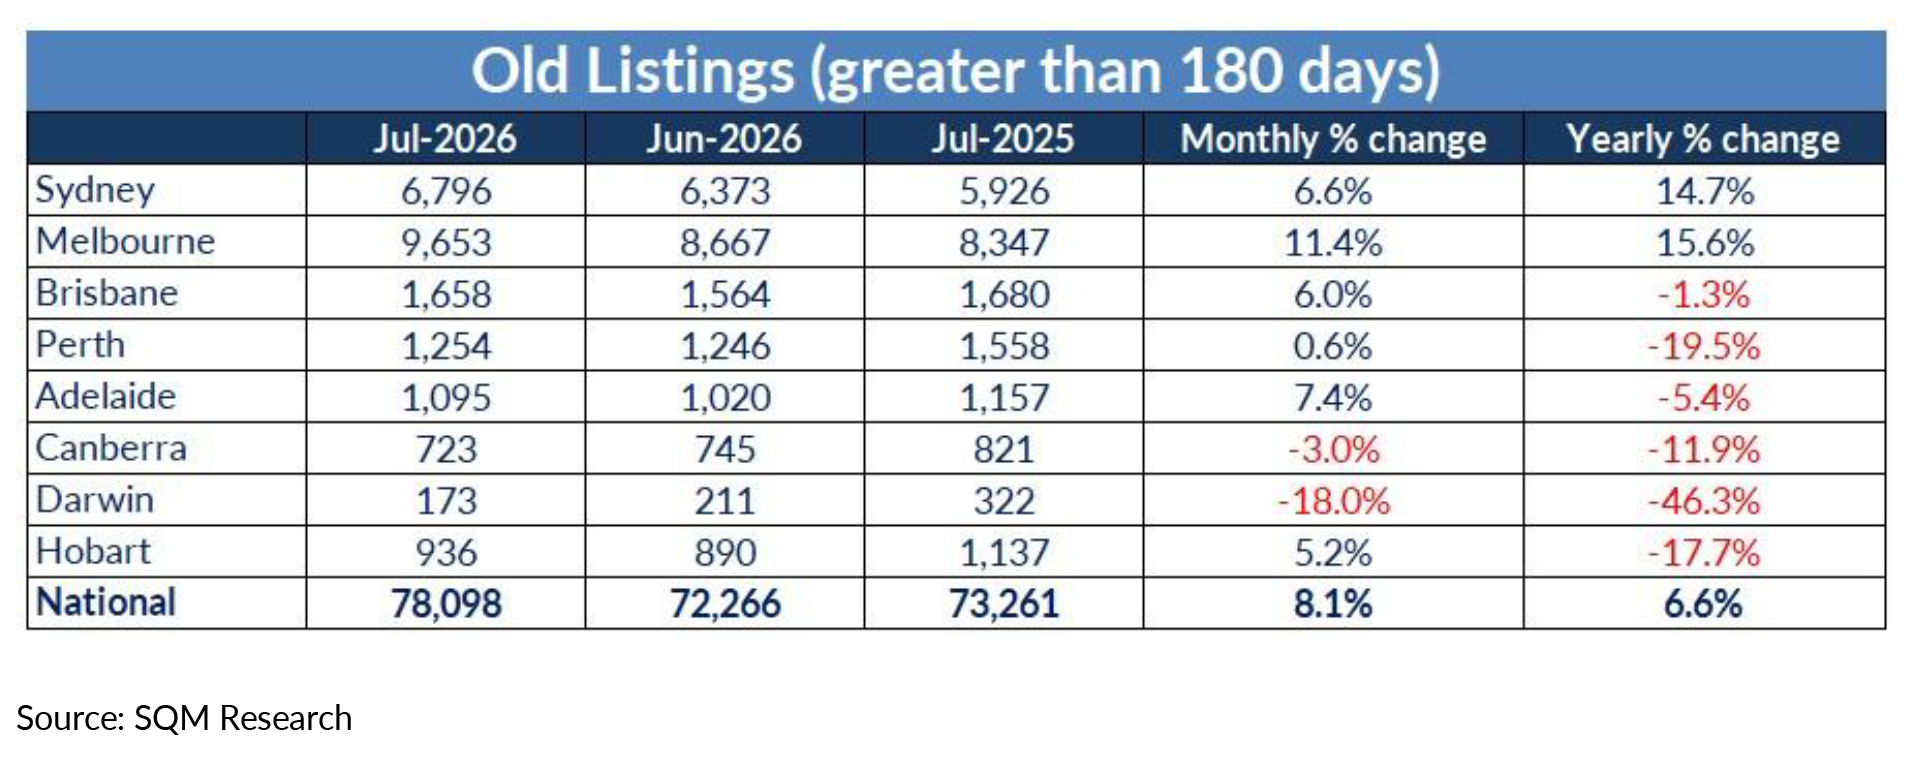
Older stock increased 8.1% nationally to 78,098 dwellings, with increases recorded across most capital cities.
Sydney (+6.6%), Melbourne (+11.4%) and Brisbane (+6.0%) all recorded notable rises in older listings.
Adelaide (+7.4%) and Hobart (+5.2%) also experienced increases, while Perth remained relatively stable (+0.6%).
Canberra (-3.0%) and Darwin (-18.0%) were the only capitals to record declines in older listings.
Nationally, old listings are now 6.6% higher than July 2025, suggesting properties are taking longer to transact as overall supply expands.
Distressed listings
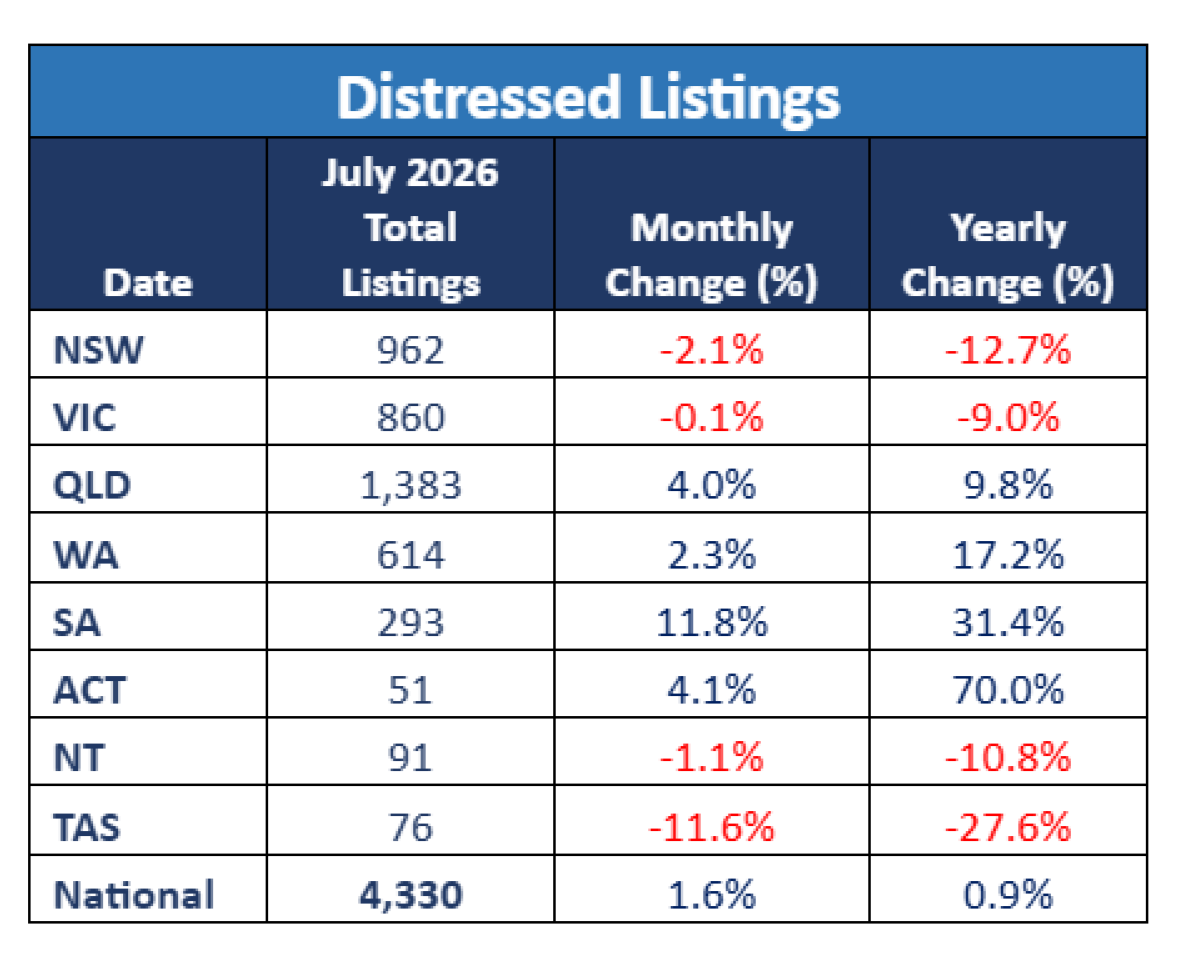
Distressed listings increased 1.6% nationally during July to 4,330 properties, representing the third consecutive monthly increase and the first annual rise (+0.9%) in distressed stock for some time.
Queensland (+4.0%), Western Australia (+2.3%) and South Australia (+11.8%) all recorded further increases, with South Australia now 31.4% higher than a year ago.
The ACT continues to stand out, with distressed listings 70.0% higher than July 2025, despite only a modest monthly increase (+4.1%).
New South Wales (-2.1%), Victoria (-0.1%), the Northern Territory (-1.1%) and Tasmania (-11.6%) all recorded monthly declines.
While distressed listings remain relatively low by historical standards, the recent upward trend will be closely monitored over coming months.
Asking prices
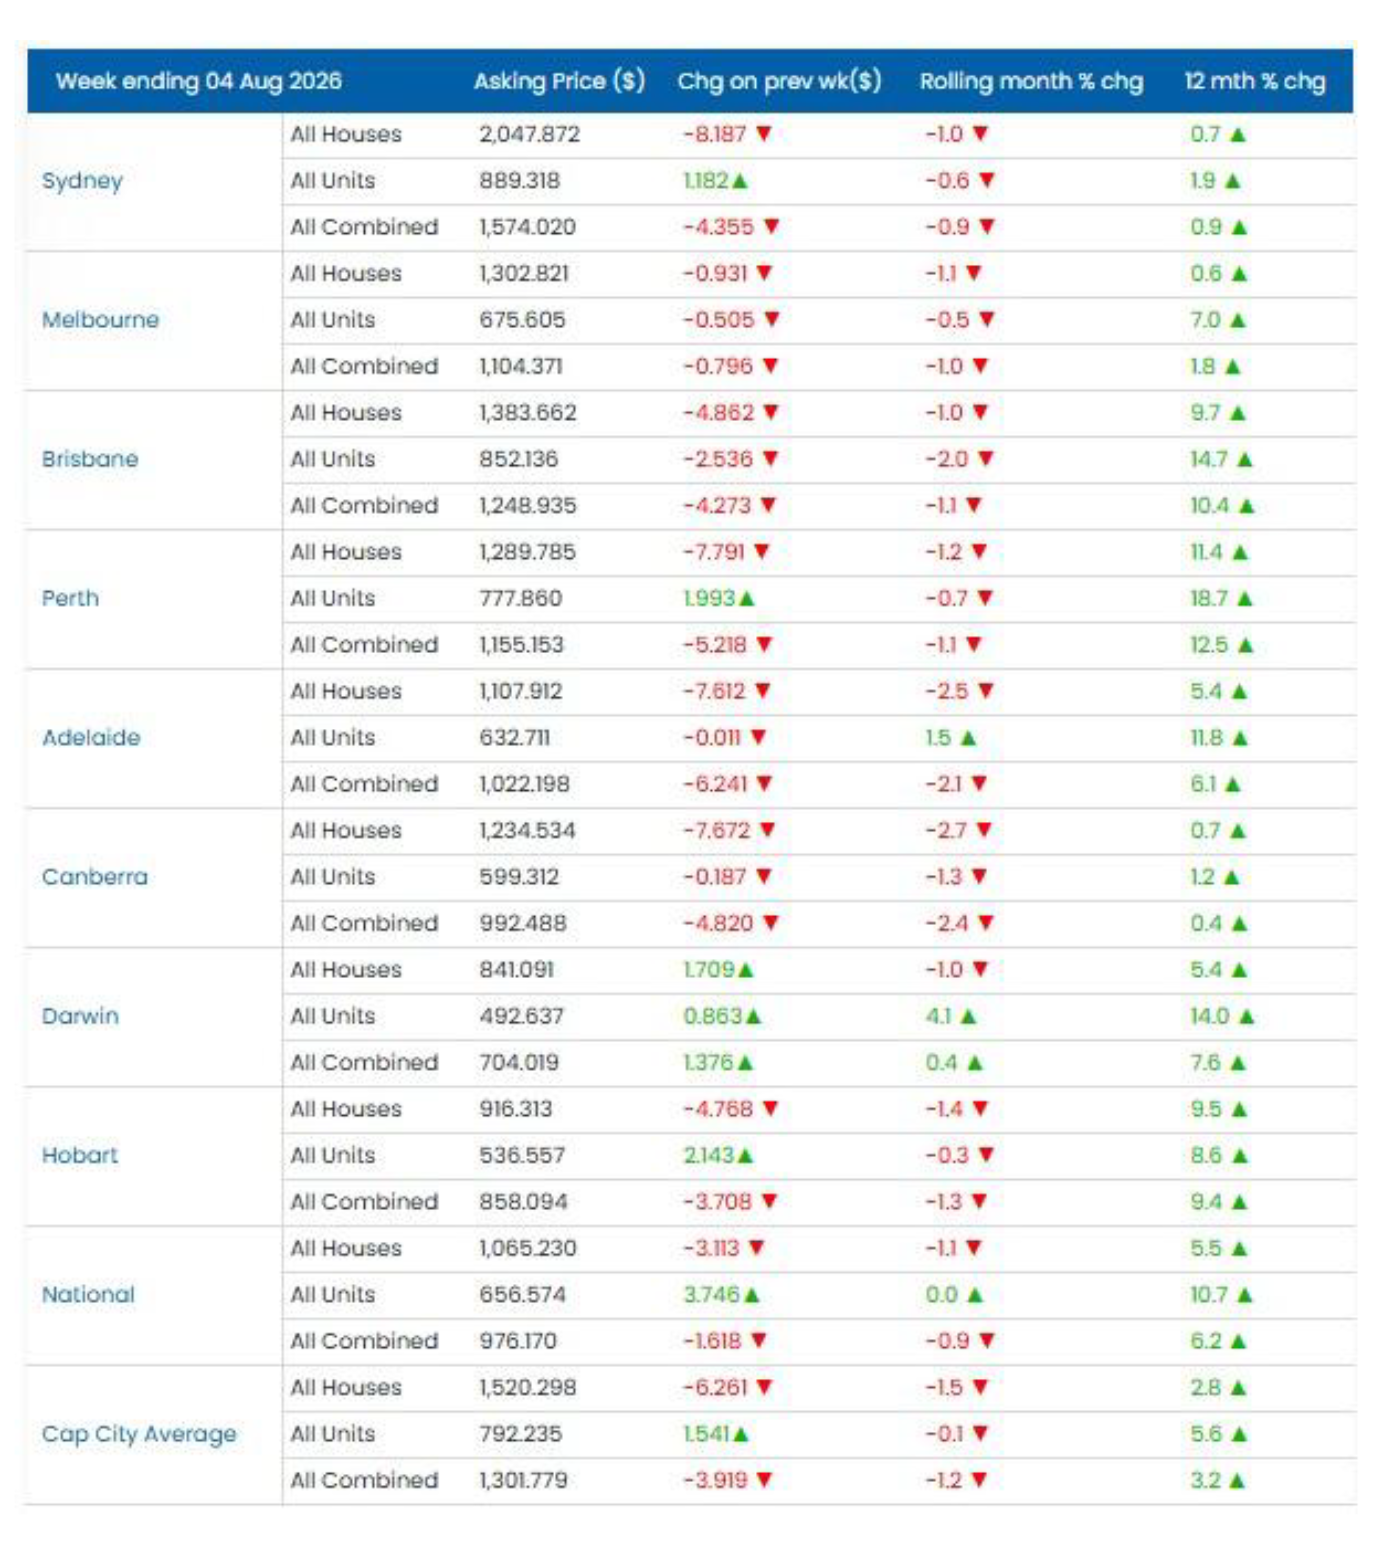
SQM Research’s Weekly Asking Prices Index for the week ending 4 August 2026 showed a softer month for asking prices across most capital cities, reflecting the increased level of supply now available to buyers.
Capital asking prices declined 1.5% for houses, while unit prices fell 0.2%. Combined dwelling asking prices eased 1.2% over the month but remain 6.2% higher year-on-year.
Sydney (-0.9%), Melbourne (-1.0%), Brisbane (-1.1%) and Perth (-1.1%) all recorded similar monthly declines in combined asking prices, though annual growth remains positive.
Adelaide experienced a larger monthly decline of 2.1%.
Canberra also softened (-2.4%), while remaining 0.4% higher year-on-year.
Darwin was the only capital city to record a monthly increase in combined asking prices (+0.4%) and remains 7.6% higher than a year ago.
Hobart recorded a 1.3% monthly decline, though combined asking prices remain 9.4% higher year-on-year.
Louis Christopher, Managing Director, SQM Research “July’s figures mark a significant shift in market conditions. National listing levels are now almost 23 per cent higher than they were a year ago, giving buyers considerably more choice than they have had for some time.”
This rise is rather abnormal as July tends to record a lull in listings due to the winter period. But not this year. No, Listings are firmly up across the board.
“What’s particularly noteworthy is that we’re seeing increases in both new listings and older listings. More properties are coming onto the market, but they’re also taking longer to sell. This is the typical read you see in housing market downturns – listings start piling up upon each other.
“At the same time, asking prices have softened as supply has increased and buyers have departed the market. The flip side is this should provide buyers with greater negotiating power heading into spring.”
Page 6 of 6 “The rise in total listings should also be contrasted against the fall in auction listings, which is actually down by about 20% compared to the same period last year. Vendors in this market are increasingly preferring to sell via private treaty.”
Going forward, we can expect another rise in listings as we head into spring. That increase in supply is likely to put further downward pressure on housing prices for the remainder of 2026.”


