
National property listings ease in August but remain well above last year
Key points
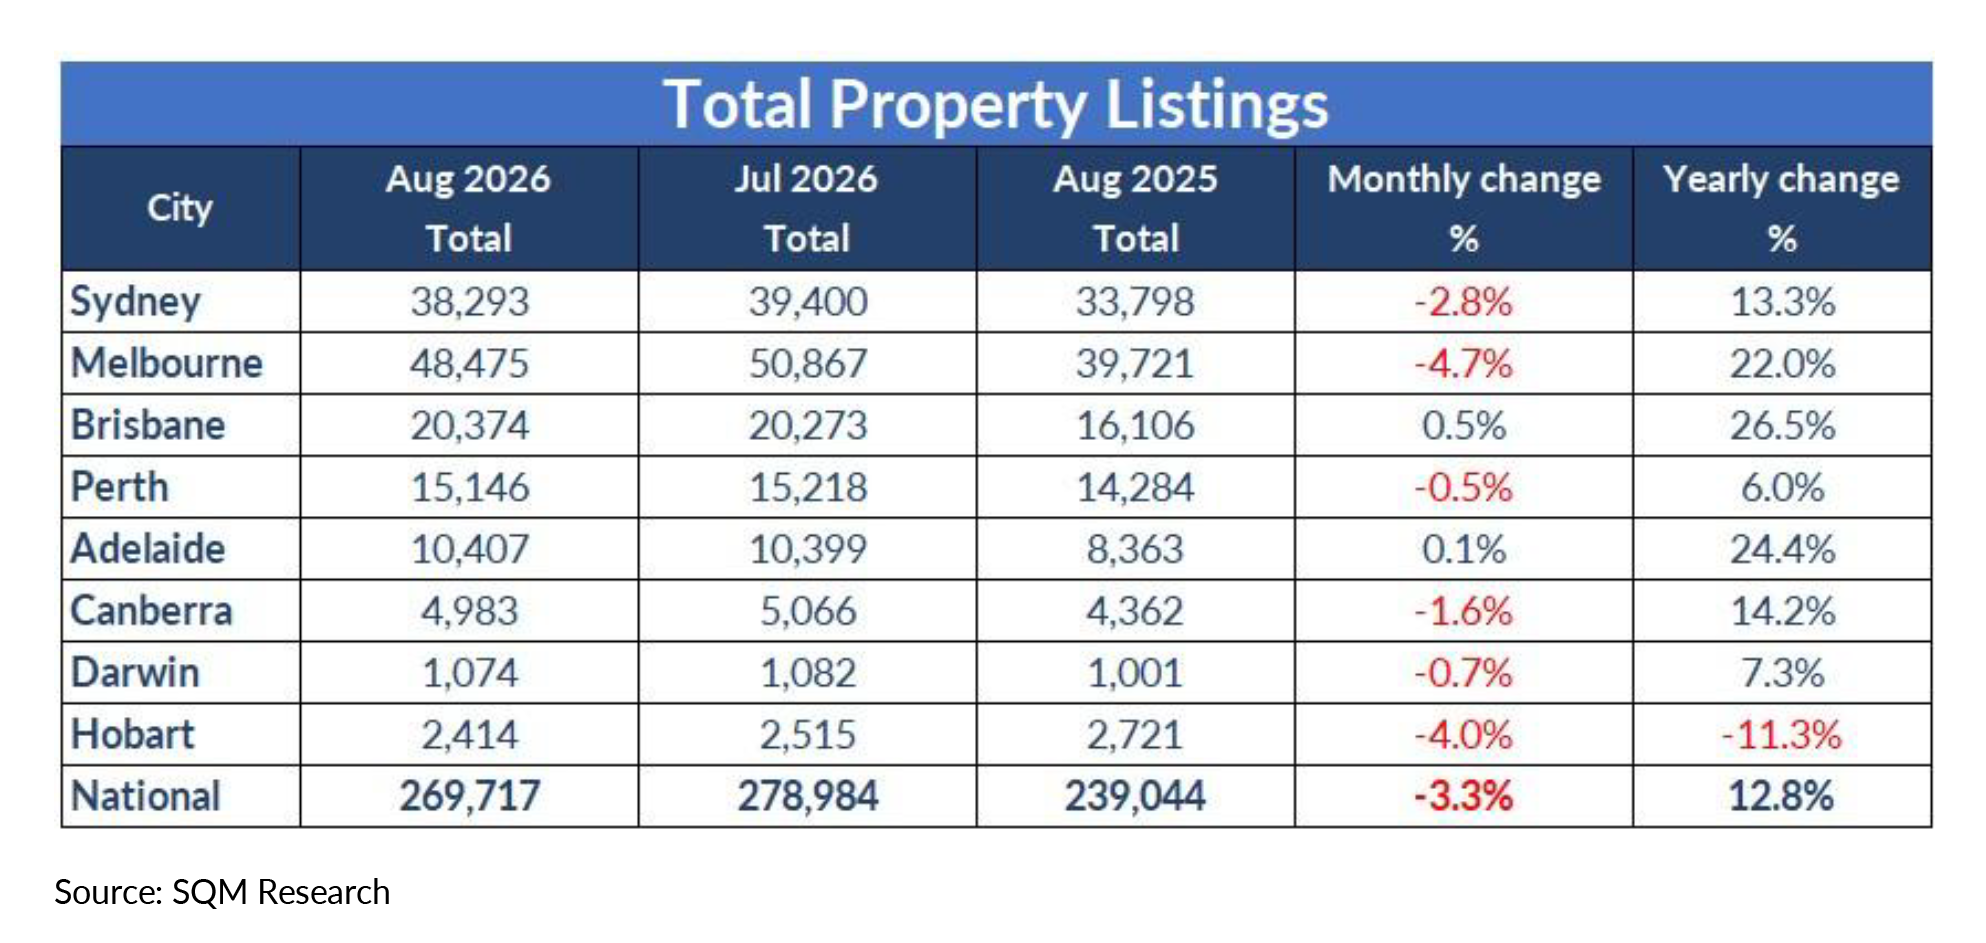
- National residential property listings declined 3.3% month-on-month in August to 269,717 dwellings, following the strong rise recorded in July.
- Despite the monthly easing, total listings remain 12.8% higher than August 2025.
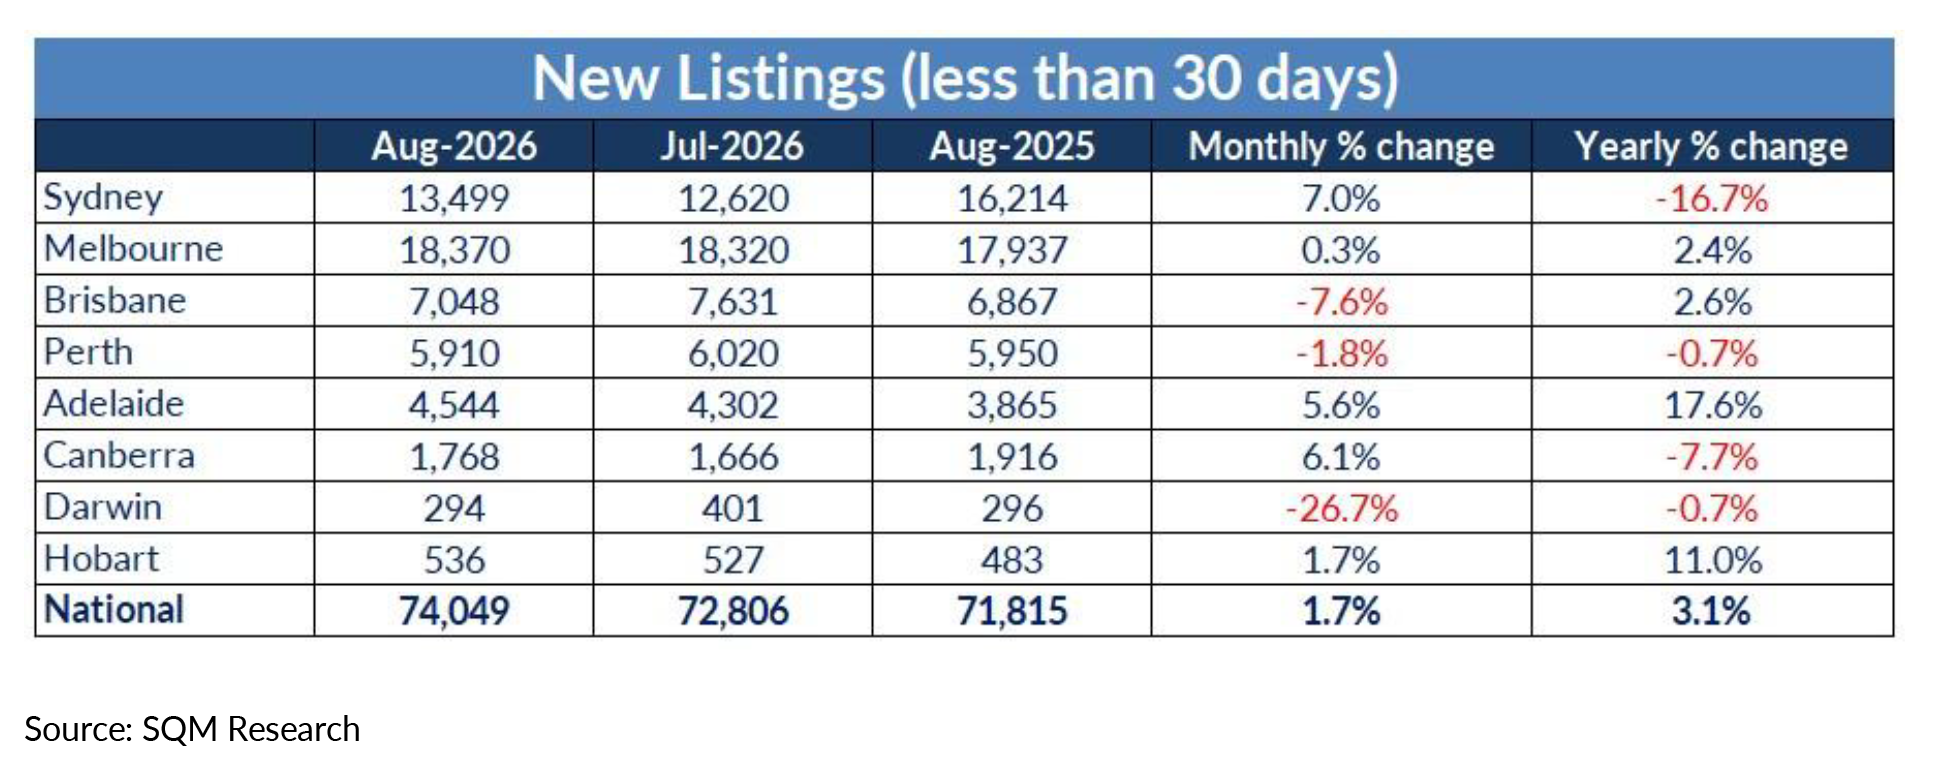
- New listings increased 1.7% nationally and are 3.1% higher year-on-year.
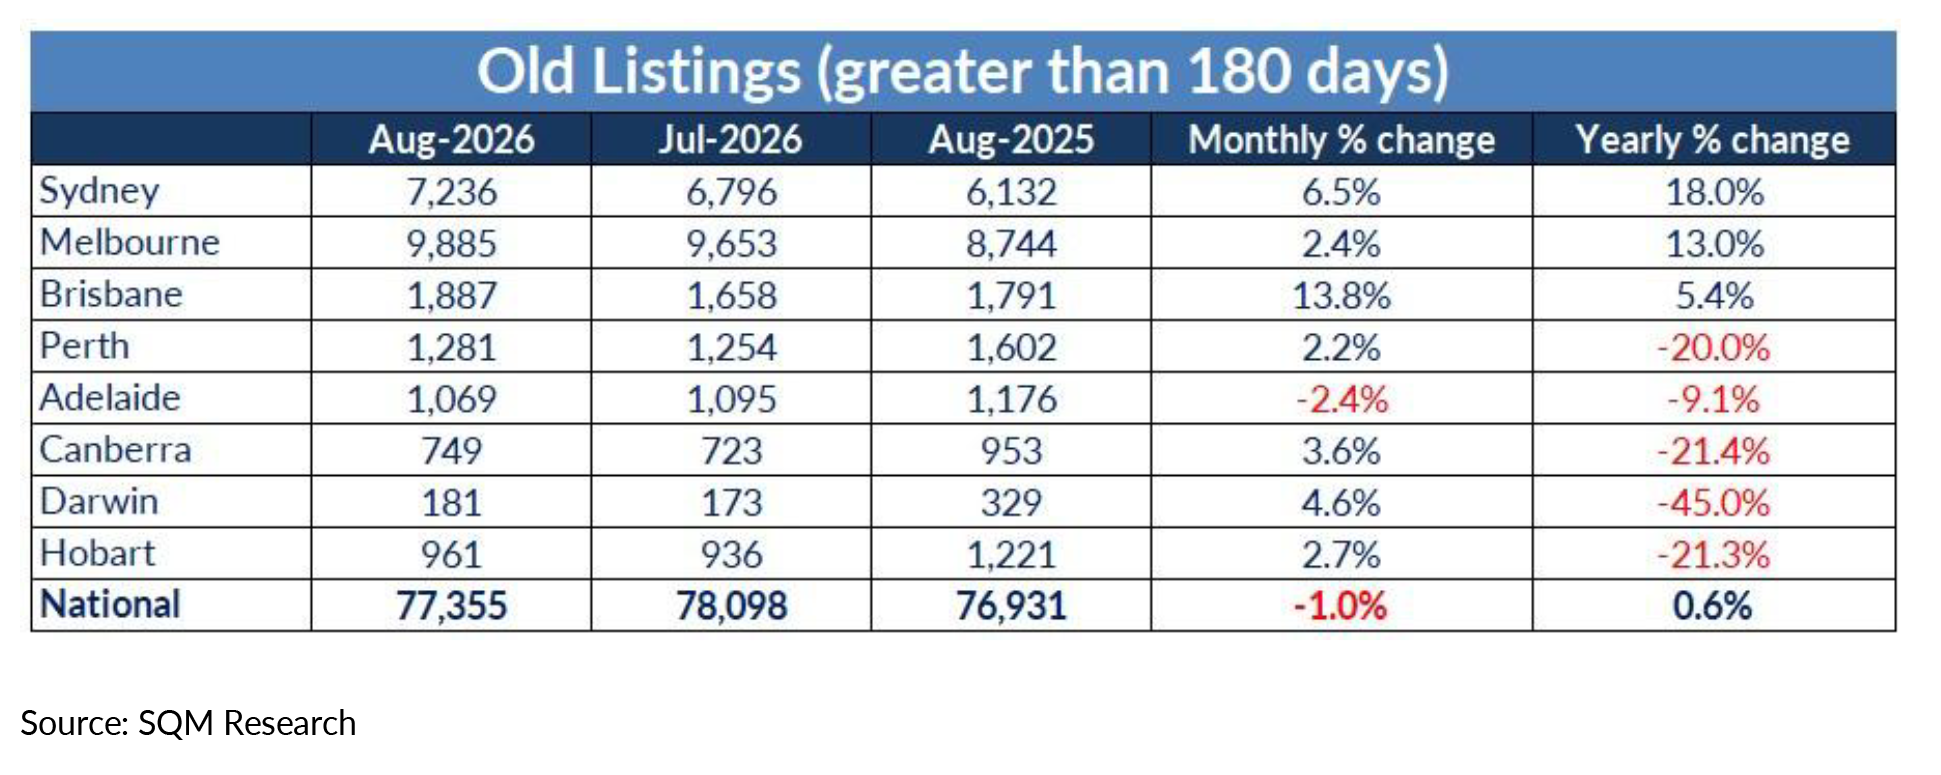
- Old listings eased 1.0% nationally but remain 0.6% above August 2025 levels.
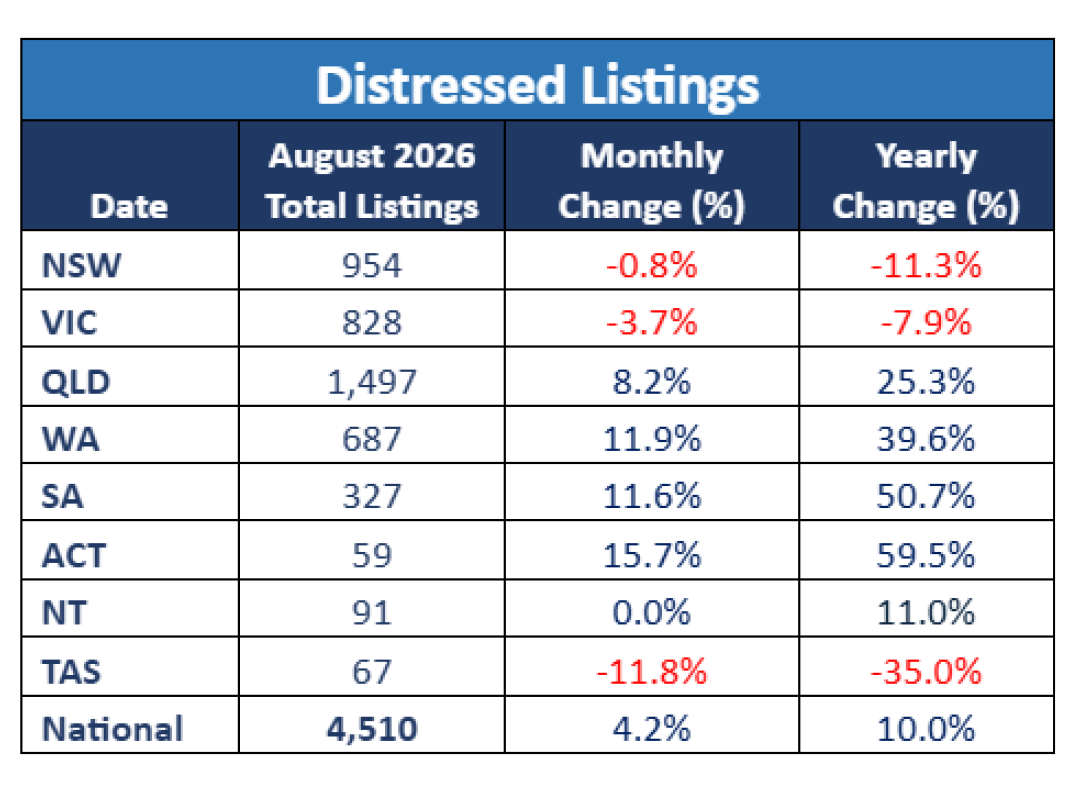
- Distressed listings increased a further 4.2% to 4,510 properties and are now 10.0% higher year-on-year.
- National combined asking prices were broadly steady, easing 0.1% over the month while remaining 5.0% higher year-on-year.
Total listings
Australia’s residential property market recorded a pullback in available stock during August, with total listings falling 3.3% to 269,717 dwellings following July’s strong increase. Despite the monthly decline, national stock remains 12.8% higher than a year ago, continuing to provide buyers with substantially more choice than in 2025.
Sydney listings declined 2.8% to 38,293, although stock remains 13.3% higher year-on-year. Melbourne recorded a larger monthly fall of 4.7%, but continues to carry significantly more stock than last year, with listings 22.0% higher annually.
Brisbane was one of the few markets to record a monthly increase, with listings edging 0.5% higher to 20,374. Stock in Brisbane is now 26.5% above August 2025, the strongest annual increase among the major capitals.
Perth listings eased slightly (-0.5%) after several months of strong supply growth but remain 6.0% higher year-on-year. Adelaide was broadly steady (+0.1%) and is now 24.4% higher annually, while Canberra fell 1.6% but remains 14.2% above last year.
Darwin eased 0.7% for the month while remaining 7.3% higher year-on-year. Hobart recorded a 4.0% monthly decline and remains the only capital with materially lower total stock than a year ago, down 11.3%.
New listings
New listings increased 1.7% nationally in August to 74,049 dwellings, with fresh stock 3.1% higher than a year ago.
Sydney recorded a 7.0% monthly increase, although new listings remain 16.7% below August 2025. Melbourne was broadly steady (+0.3%) and sits 2.4% higher year-on-year.
Brisbane (-7.6%) and Perth (-1.8%) recorded monthly declines, while Adelaide (+5.6%) and Canberra (+6.1%) saw fresh stock increase.
Darwin recorded the largest monthly fall, down 26.7%, while Hobart increased 1.7%. On an annual basis, Darwin is broadly in line with last year (-0.7%), while Hobart is 11.0% higher.
The national result suggests fresh vendor activity remained relatively stable through August despite differing conditions across individual capital cities.
Old listings
Older listings declined 1.0% nationally in August to 77,355 dwellings, following the strong accumulation recorded in July. However, aged stock remains 0.6% higher than a year ago.
Sydney (+6.5%), Melbourne (+2.4%) and Brisbane (+13.8%) all recorded increases in older stock. Sydney’s old listings are now 18.0% higher year-on-year, while Melbourne is 13.0% higher and Brisbane 5.4% higher.
Perth recorded a modest 2.2% monthly increase, although old listings remain 20.0% below August 2025 levels.
Adelaide was one of the few capitals to record a decline in aged stock (-2.4%), while Canberra increased 3.6%. Darwin (+4.6%) and Hobart (+2.7%) also recorded monthly increases, although both remain substantially below last year.
The divergence between cities suggests the build-up in longer-dated stock remains concentrated rather than uniform across the national market.
Distressed listings
Distressed property listings increased 4.2% nationally during August to 4,510 properties, extending the upward trend recorded over recent months. More significantly, distressed listings are now 10.0% higher than August 2025.
Queensland recorded an 8.2% monthly increase to 1,497 distressed listings and is now 25.3% higher year-on-year. Western Australia increased 11.9% for the month and 39.6% annually.
South Australia also recorded another sizeable increase, rising 11.6% month-on-month and 50.7% year-on-year, while the ACT rose 15.7% and remains 59.5% above August 2025.
By contrast, New South Wales (-0.8%) and Victoria (-3.7%) recorded monthly falls and remain below last year’s levels. Tasmania declined 11.8% and is 35.0% lower year-on-year.
The national increase does not in itself indicate widespread mortgage distress, but the continued rise — particularly across Queensland, Western Australia, South Australia and the ACT — warrants close monitoring.
Asking prices
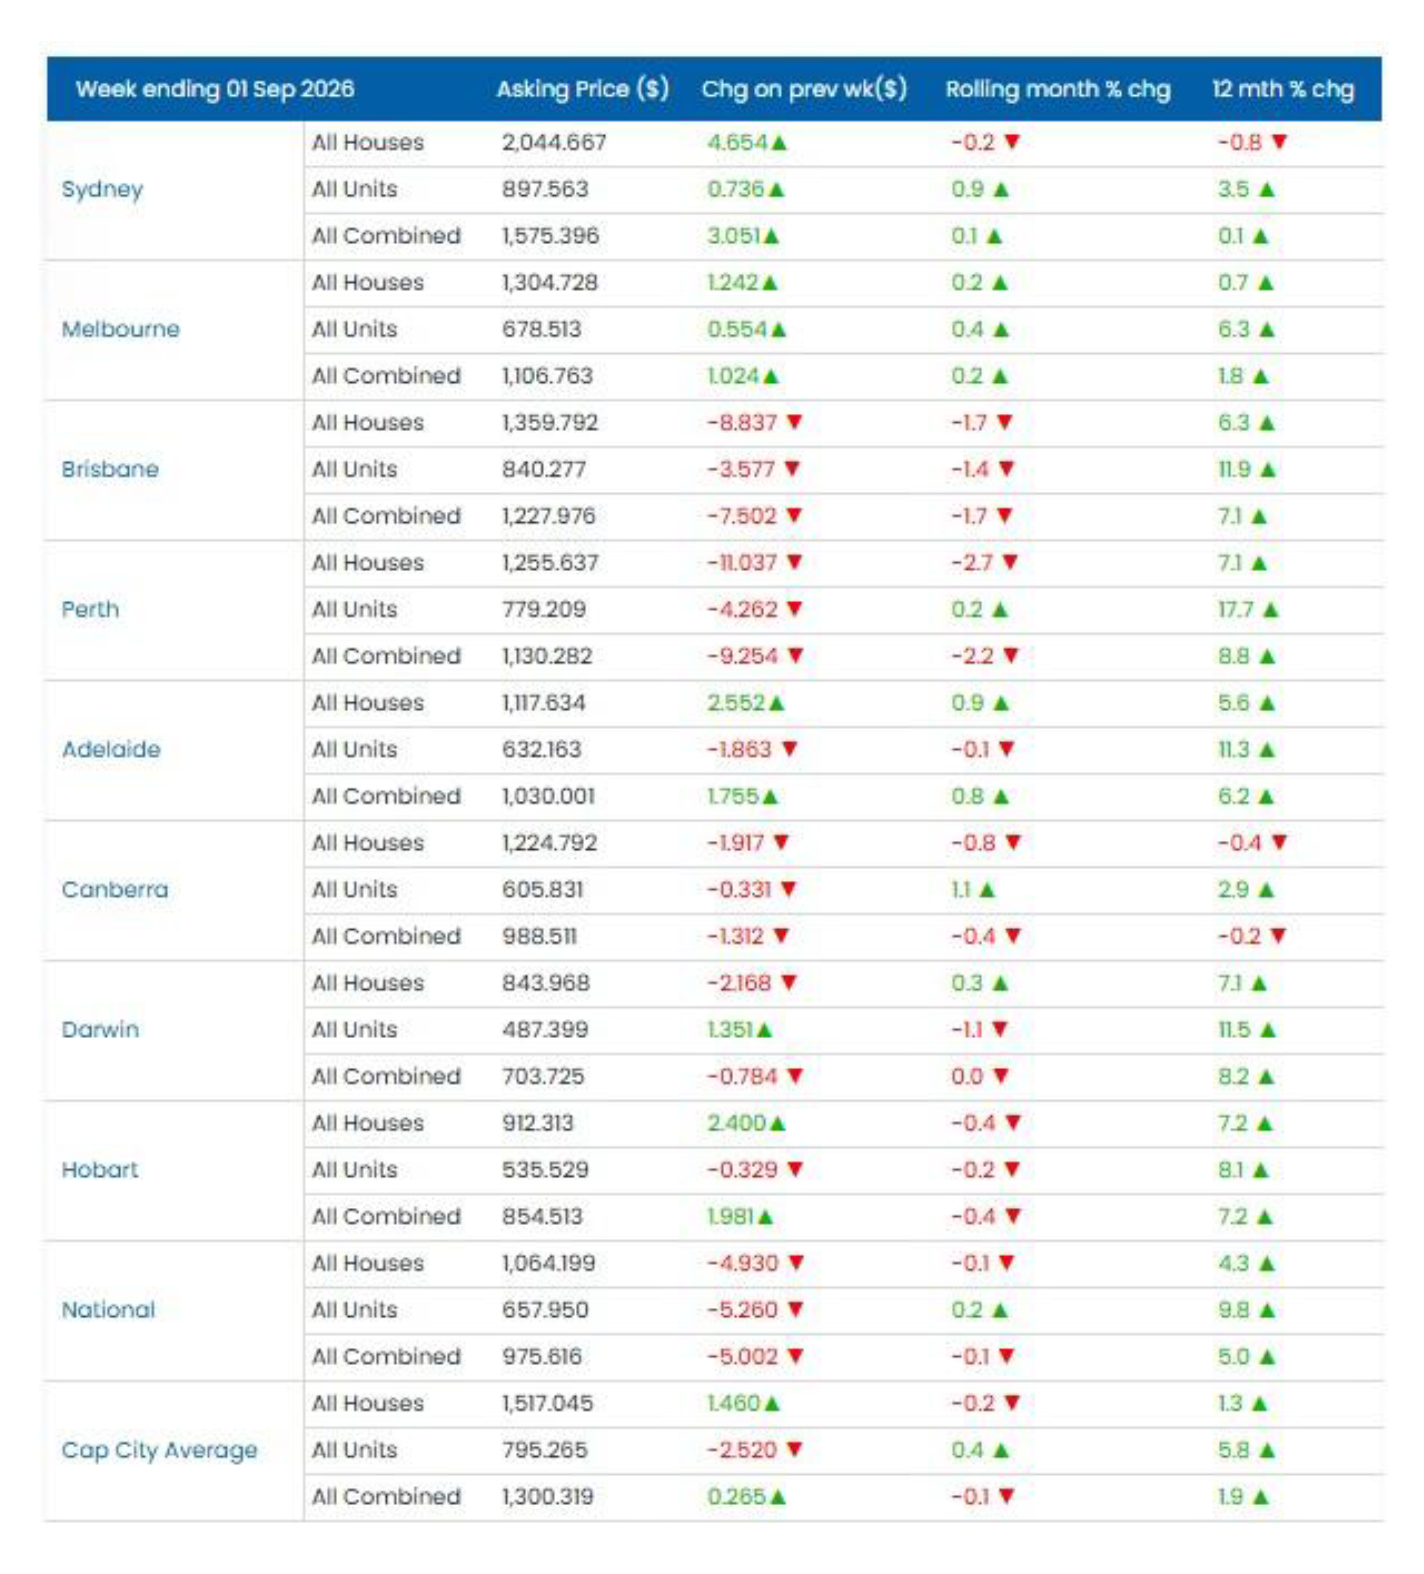
SQM Research’s Weekly Asking Prices Index for the week ending 1 September 2026 showed relatively subdued monthly price movements nationally, while annual growth remained positive.
Nationally, house asking prices eased 0.1% over the month, while unit asking prices increased 0.2%. Combined dwelling asking prices declined 0.1% month-on-month and remain 5.0% higher year-on-year.
Sydney combined asking prices increased slightly (+0.1%) and are broadly unchanged from a year ago (+0.1%), while Melbourne rose 0.2% for the month and remains 1.8% higher annually.
Brisbane recorded a 1.7% monthly decline in combined asking prices but remains 7.1% higher year-on-year. Perth also softened, down 2.2% for the month, while maintaining annual growth of 8.8%.
Adelaide was one of the stronger markets during August, with combined asking prices increasing 0.8% and remaining 6.2% higher year-on-year.
Canberra recorded a 0.4% monthly decline, with combined asking prices now 0.2% below a year ago.
Darwin’s combined asking prices were unchanged over the month and remain 8.2% higher year-on-year. Hobart recorded a 0.4% monthly decline, while remaining 7.2% higher annually.
Commentary – Louis Christopher, Managing Director, SQM Research
“August’s numbers show a market with considerably more available stock than this time last year, despite the pullback in total listings following July’s strong result.”
“The annual figures remain particularly noteworthy. Melbourne, Brisbane and Adelaide are all carrying substantially more stock than a year ago, while Sydney is also well above 2025 levels. This should continue to provide buyers with greater choice as we move into the spring selling season.”
“What we are watching more closely is the rise in distressed listings. National distressed stock is now 10 per cent higher than a year ago, with particularly large annual increases in Queensland, Western Australia, South Australia and the ACT. These numbers are still relatively contained, but the direction of travel has clearly changed compared with earlier in the year.”
“Asking prices have also been relatively subdued over the past month. With more stock available and distressed listings trending higher, the spring market will provide an important test of vendor expectations and buyer demand.”


