
SQM Research has released its August 2026 residential vacancy rate data together with its latest advertised rents data.
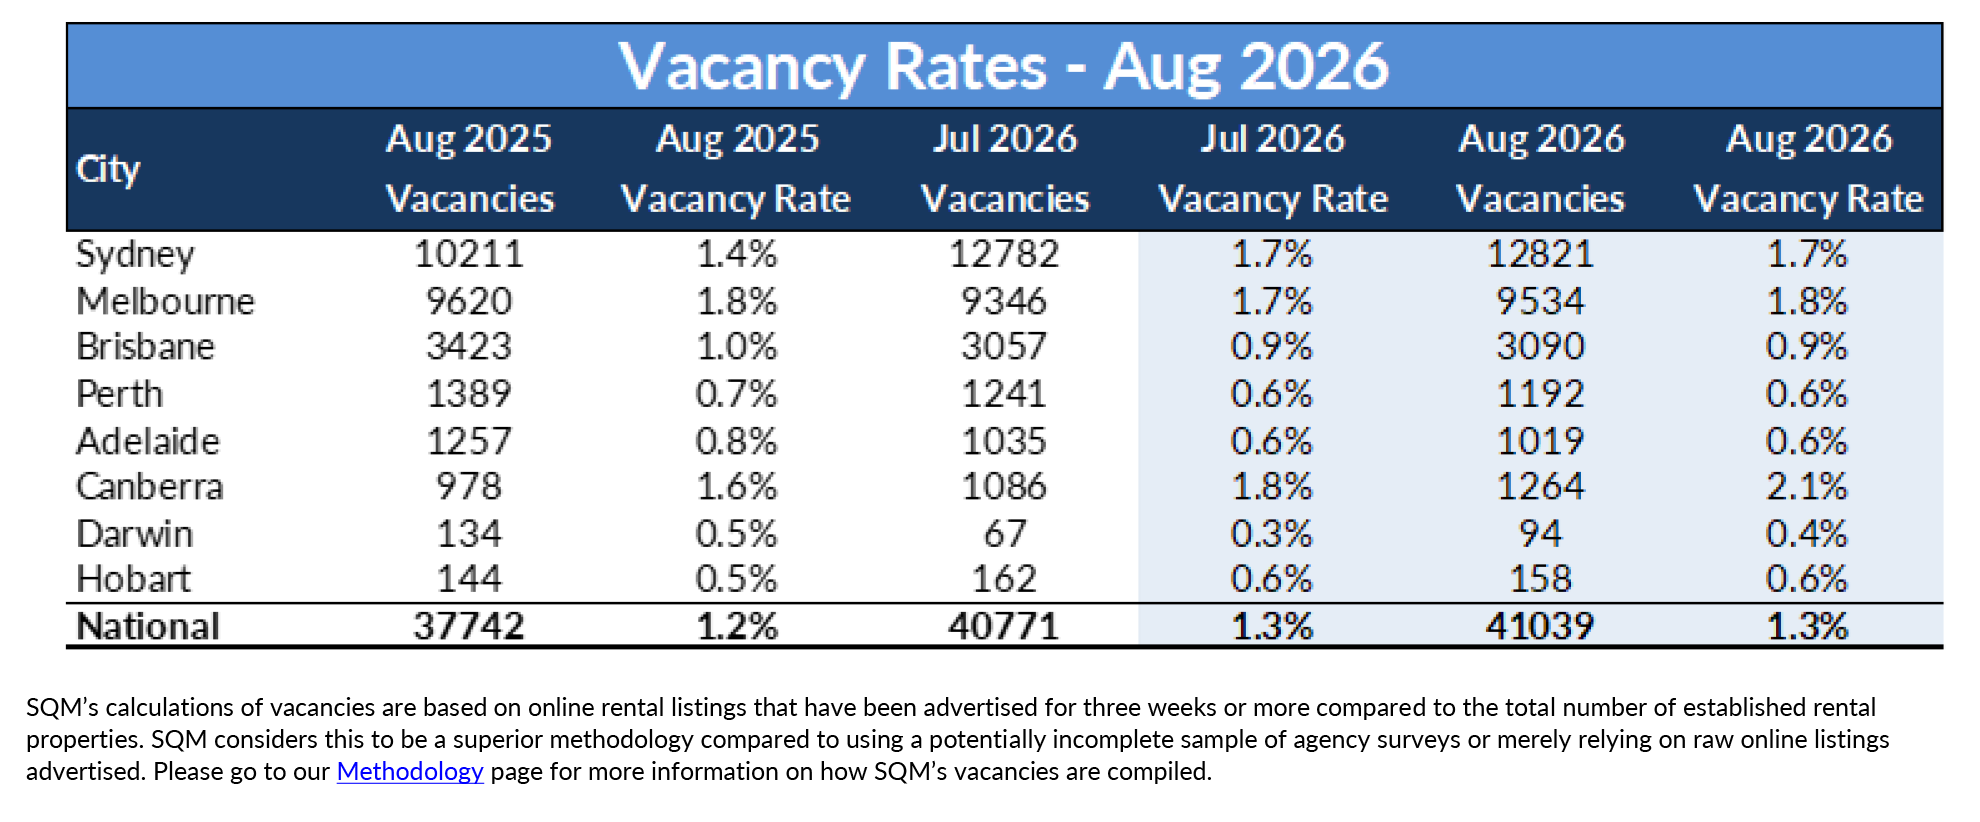
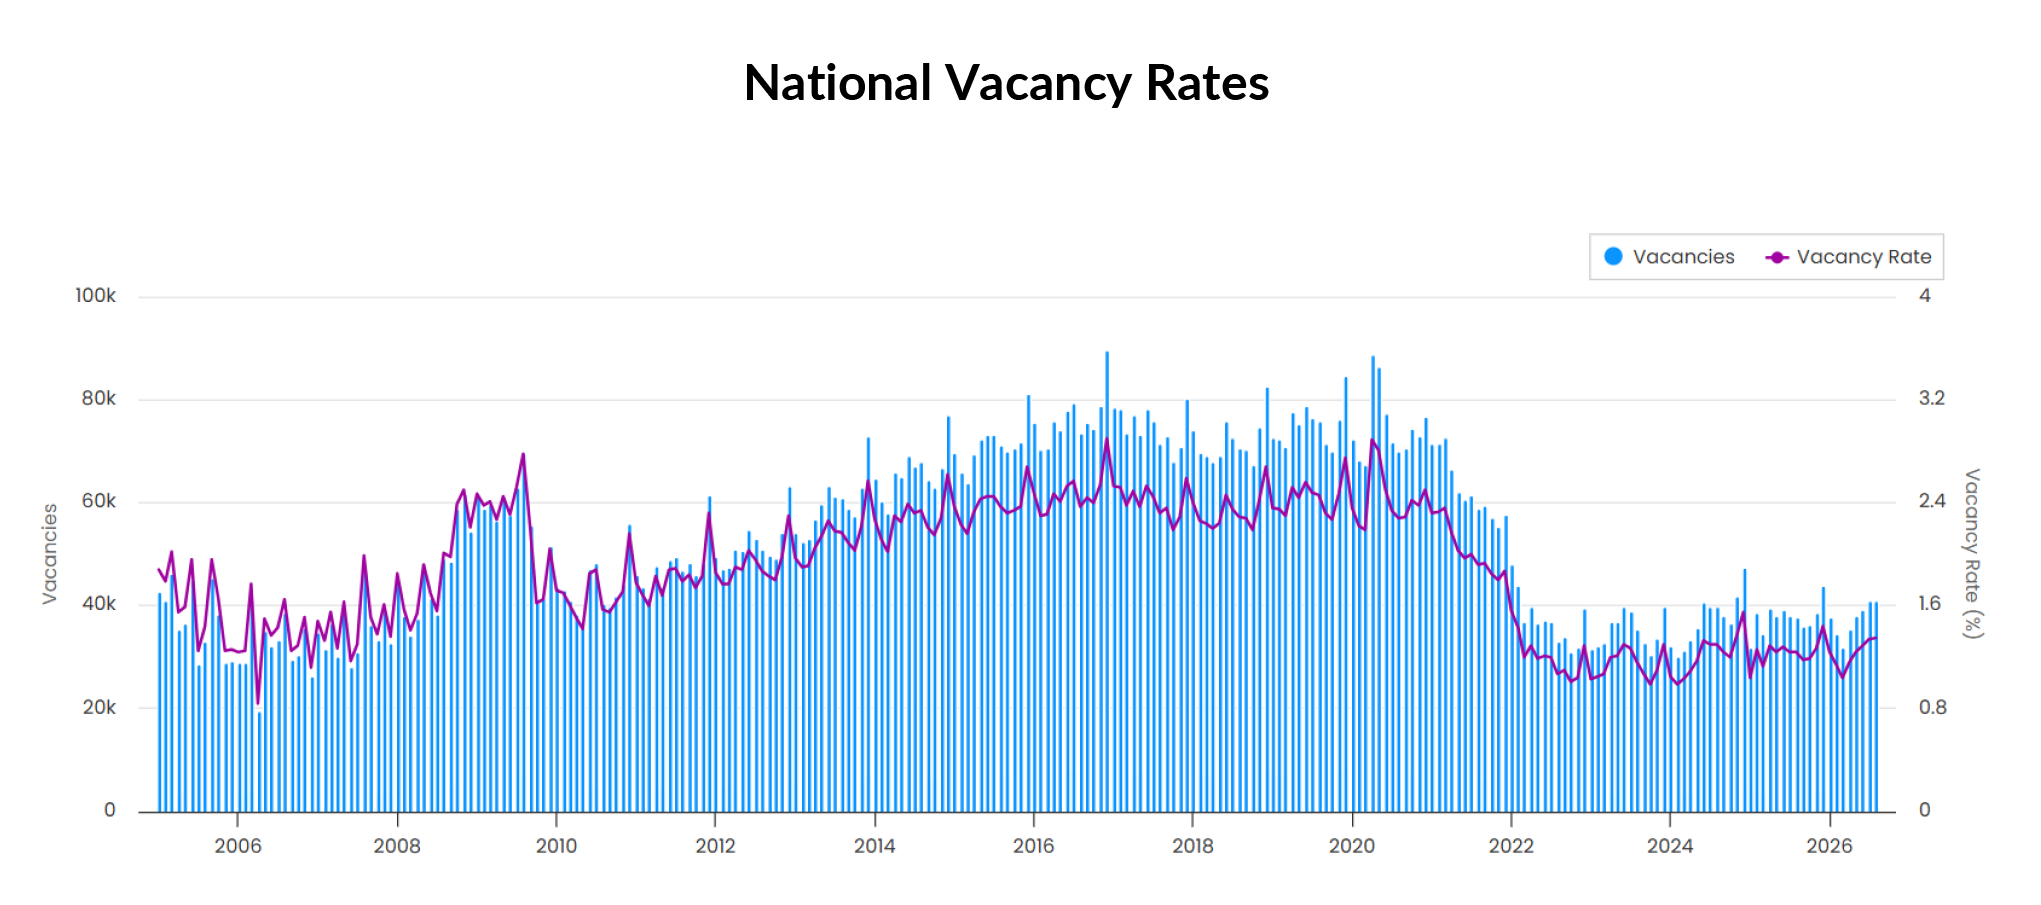
Australia’s national residential vacancy rate held at 1.3% in August 2026, unchanged from July, with 41,039 residential vacancies recorded. Against August 2025 the picture is less static: vacancies are up by around 3,300 dwellings (8.7%) and the national rate has moved up from 1.2%.
The national figure masks a market moving in two directions. Sydney has 26% more vacancies than a year ago and Canberra 29% more, while Brisbane, Perth, Adelaide and Darwin all have fewer vacant dwellings than last August and remain below 1%. The larger east-coast markets are loosening; the smaller capitals are still tightening.
Capital City Highlights
Sydney: The vacancy rate held at 1.7%, with 12,821 dwellings available. A year ago the rate was 1.4%. Vacancies are 26% higher than in August 2025, the largest annual increase in available stock of any capital city.
Melbourne: The vacancy rate rose to 1.8% from 1.7% in July, with 9,534 vacancies recorded. The rate is unchanged from a year ago, and Melbourne now has the second-highest vacancy rate of the capitals after Canberra.
Brisbane: The vacancy rate was unchanged at 0.9%, with 3,090 dwellings available. Vacancies are 10% lower than a year ago.
Perth: The vacancy rate held at 0.6%, with 1,192 dwellings available. Vacancies are 14% below August 2025. Perth has tightened further over the year, with no sign yet of relief for tenants.
Adelaide: The vacancy rate was unchanged at 0.6%, with 1,019 dwellings available. Vacancies are 19% below a year ago.
Canberra: The vacancy rate rose to 2.1% from 1.8% in July, with 1,264 vacancies recorded. Vacancies are 29% higher than a year ago and Canberra now has the highest vacancy rate of any capital city.
Darwin: The vacancy rate rose to 0.4% from 0.3%, with 94 dwellings available. Vacancies remain 30% below August 2025. Darwin’s rental stock is very small and monthly moves should be read with caution.
Hobart: The vacancy rate was unchanged at 0.6%, with 158 dwellings available, up from 0.5% a year ago.
Advertised rents analysis
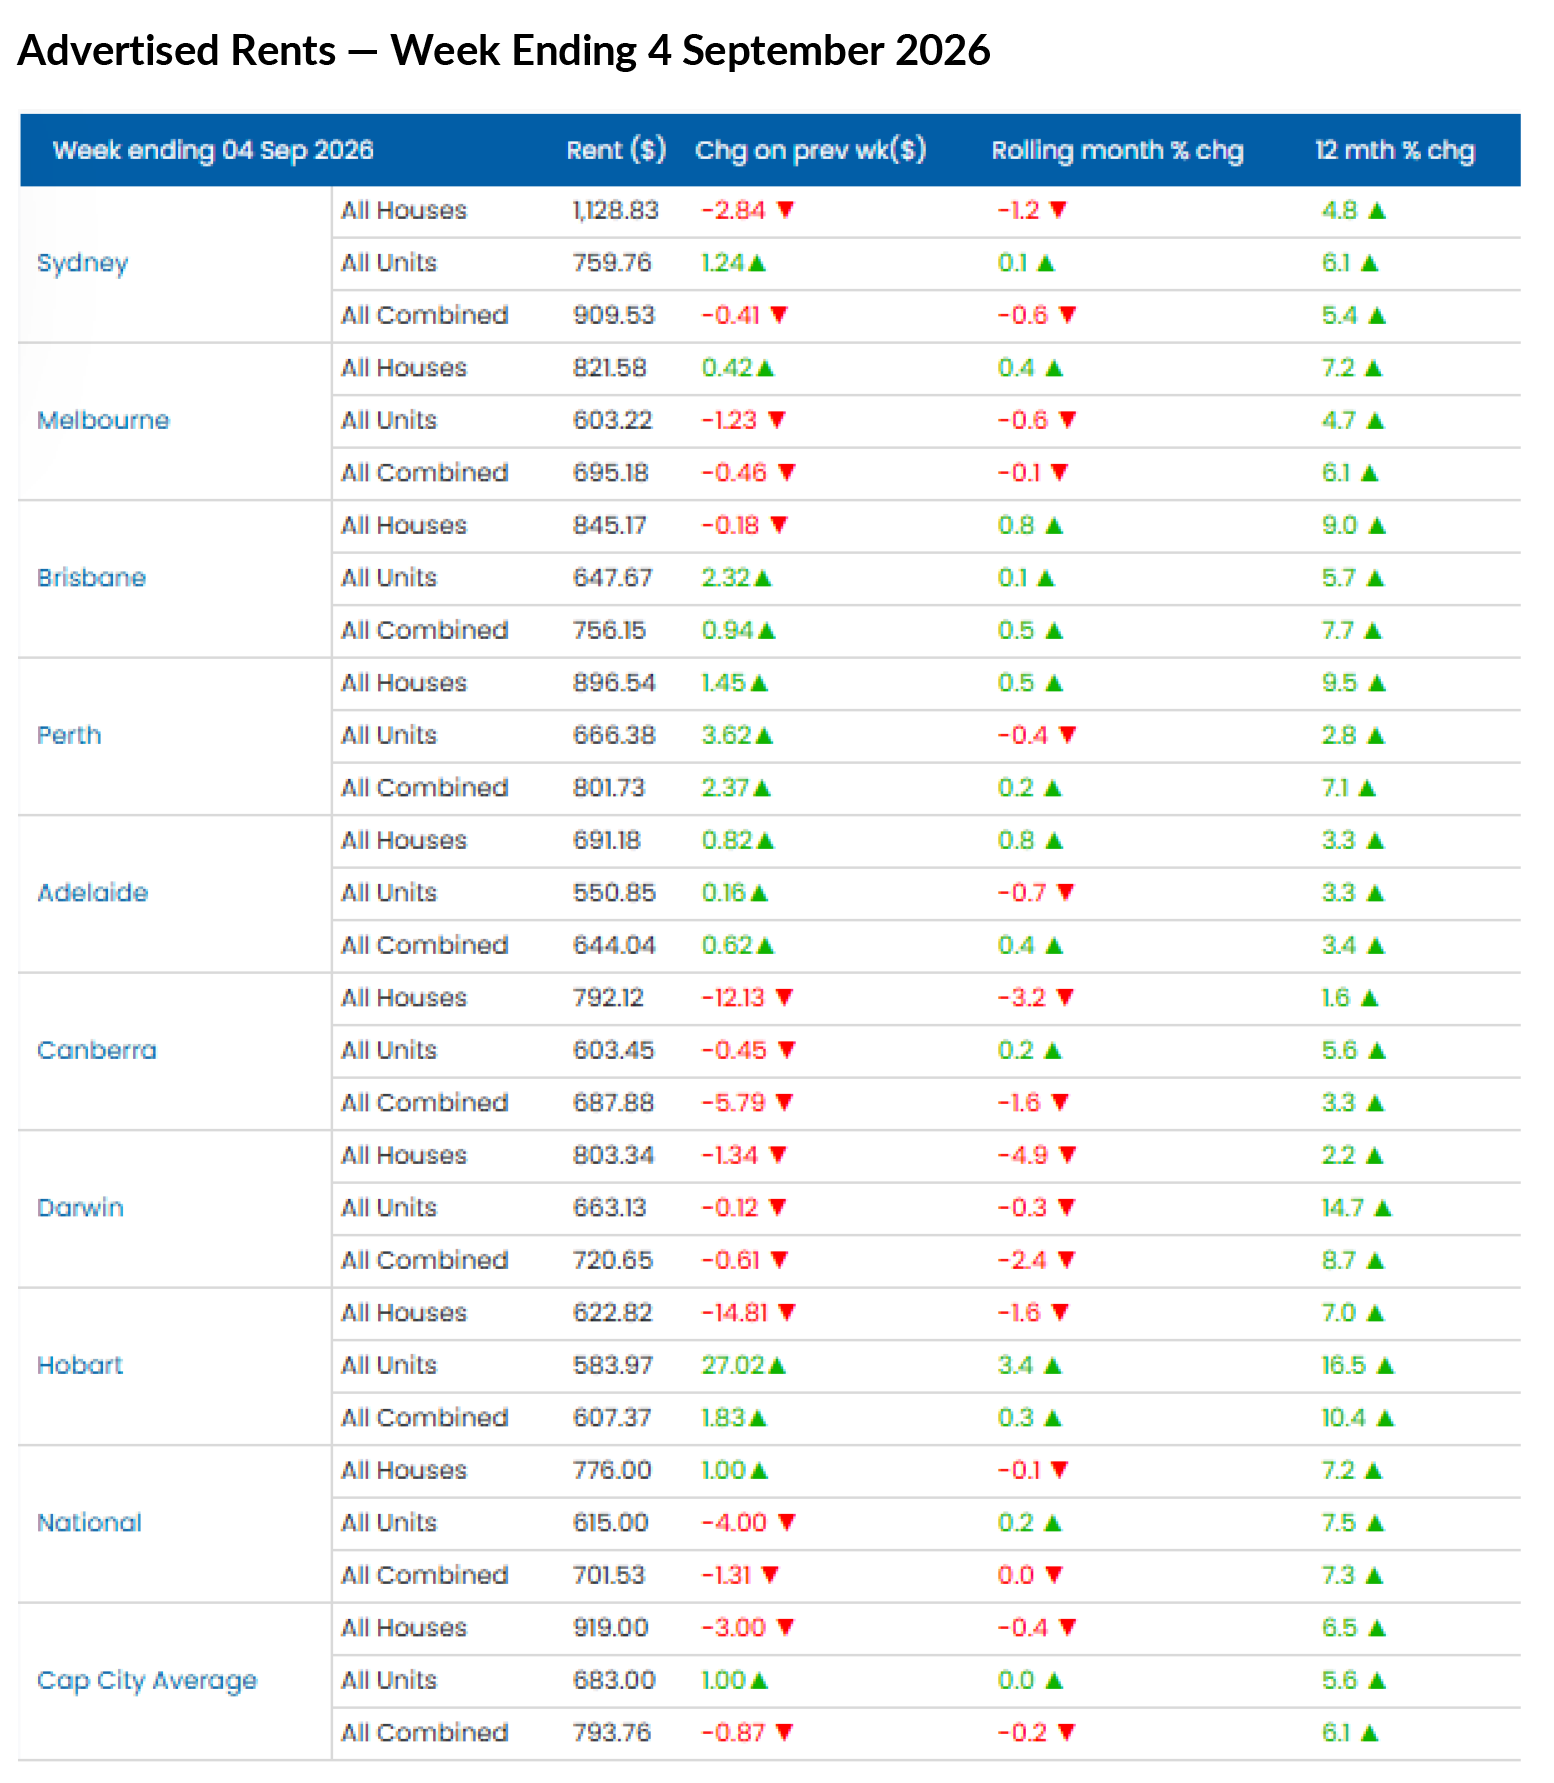
National combined advertised rents were flat over the 30 days to 4 September. House rents fell 0.1% and unit rents rose 0.2%. Combined rents remain 7.3% higher than a year ago, but that annual figure reflects increases that have already occurred. If the current pause continues, the annual rate will fall mechanically over coming months as the strong months of late 2025 drop out of the calculation.
The national combined advertised rent now stands at $701.53 per week, while the capital city average sits at $793.76 per week.
Winter is seasonally the softest period for asking rents, so a flat August is not by itself conclusive. The test is the coming spring and summer leasing season: asking rents normally firm from October into December and January. If that seasonal lift does not appear in the larger capitals, the rental upswing in those cities is over.
Sydney: Combined rents fell 0.6% over the month to $909.53 per week, with house rents down 1.2% to $1,128.83. Annual growth has slowed to 5.4%. With vacancies up 26% on a year ago, Sydney is the clearest case of a capital city rental market that has turned.
Melbourne: Combined rents eased 0.1% to $695.18 per week and are 6.1% higher over the year. Unit rents fell 0.6% over the month.
Brisbane: Combined rents rose 0.5% to $756.15 per week and are 7.7% higher over the year, with house rents up 9.0% annually. At 0.9% vacancy, Brisbane retains the capacity for further rent rises into summer.
Perth: Combined rents rose 0.2% to $801.73 per week and are 7.1% higher over the year, with house rents up 9.5%. There is no sign of moderation in Perth.
Adelaide: Combined rents rose 0.4% to $644.04 per week and are 3.4% higher over the year. Adelaide’s rental growth has been the most subdued of the tight markets despite a 0.6% vacancy rate.
Canberra: Combined rents fell 1.6% to $687.88 per week, with house rents down 3.2% over the month. Annual growth of 3.3% is consistent with the 29% rise in vacant stock over the year.
Darwin: Combined rents fell 2.4% to $720.65 per week but remain 8.7% higher over the year. Darwin’s small rental stock makes monthly moves volatile.
Hobart: Combined rents rose 0.3% to $607.37 per week and are 10.4% higher over the year, still the strongest annual growth of any capital city, driven by unit rents (+16.5%).
Louis Christopher, Managing Director of SQM Research, commented: “The national vacancy rate is 1.3%, but that hides a market moving in two directions. Sydney has 26% more vacancies than a year ago and Canberra 29% more, while Brisbane, Perth, Adelaide and Darwin have fewer than they did last August.
“The annual rent figure of 7.3% is history. It reflects increases that have already stopped. National rents were flat over the month and Sydney house rents fell. Some of this is the usual winter lull, so the test is spring: asking rents normally firm from October into the summer leasing season.
“Our expectation for the lead-up to summer is that the national vacancy rate drifts up towards 1.4% to 1.5% by December on the usual seasonal rise in listings, with Sydney at or above 1.9%. Rents in Brisbane, Perth and Adelaide still have room to firm. Sydney, Melbourne and Canberra do not, and we expect Sydney house rents to be the first to record annual growth below 3%.
“If the seasonal lift in rents fails to materialise in the larger capitals, the rental upswing in those cities is over. Nationally, annual rental growth is likely to slow to the mid-single digits by year-end even with a normal seasonal firming, simply because the strong months of late 2025 drop out of the calculation. The smaller capitals have not yet built enough stock to give tenants relief.”


Tags:Louis Christopher
Latest Articles
- The Fed looks like it’s going to hike – implications for investors & Australia | 15 Sep 2026
- Life insurers under pressure: 42% of consumers are confused and unconvinced by policies | 15 Sep 2026
- ReCALIbrate doubles opportunities and expands to women across life insurance | 15 Sep 2026
- New Understanding Modern Australia report reveals Australia’s financial confidence gap | 15 Sep 2026
- PPS Mutual appoints Senior Business Development Manager to grow Victorian adviser network | 15 Sep 2026
- New report puts stockbroking and investment advice careers in the spotlight as profession prepares for future growth | 15 Sep 2026


