
Latest economic data
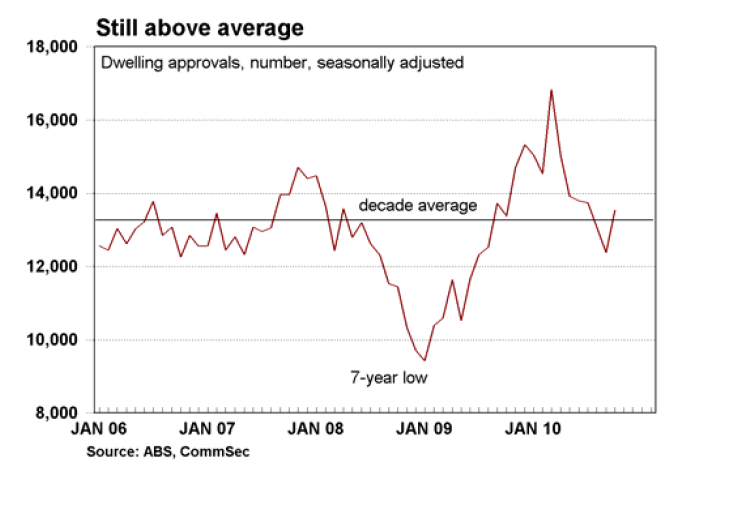
- New dwelling approvals rose for the first time in seven months – up 9.3 per cent in October.
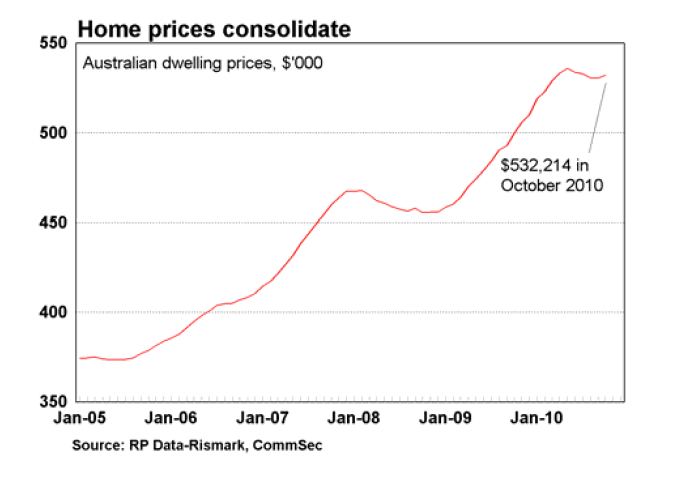
- The RP Data-Rismark Hedonic Australian Home Value Index – the largest property database in Australia – reported that home prices rose by 0.3 per cent seasonally adjusted terms in October. House prices outside capital cities eased by 0.1 per cent in the month.
- Capital city home prices are up 6.5 per cent on a year ago while prices in the ‘Rest of State’ markets are up just 2.4 per cent.
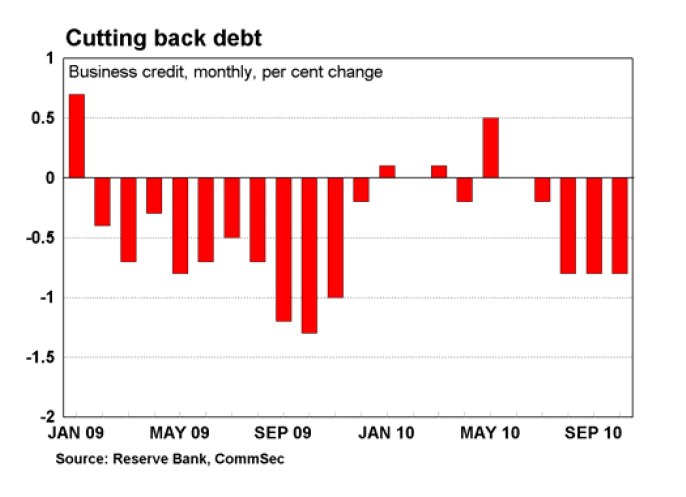
- Private sector credit rose by only 0.1 per cent in October, largely driven by weakness in business credit which fell by 0.8 per cent in the month. Credit growth stands 2.8 per cent higher over the year.
- The broad measure of Australia’s external position – the current account – worsened markedly in the September quarter. The current account deficit widened by $2.4 billion to $7.8 billion in the September quarter.
- Overall CommSec expects that the economy grew by around 0.5 per cent in the September quarter.
What does it all mean?
- The release of five economic indicators has certainly given economists and analysts a lot to ponder. And at first glance the data certainly paints a mixed picture of the Australian economy. House prices and building approvals recorded a healthy rebound, while private sector credit remains sluggish, and the current account deficit widened.
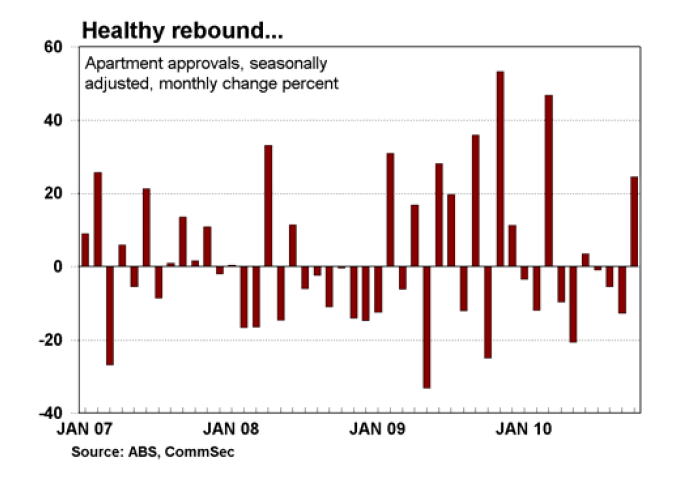
- The improvement in building approvals is certainly encouraging but needs to be put in context. Dwelling approvals have slumped by over 30 per cent in the past six months and the latest rebound is mostly all apartment approvals, which tend to be lumpy. A few more months of rising approvals will be needed to claim a turnaround.
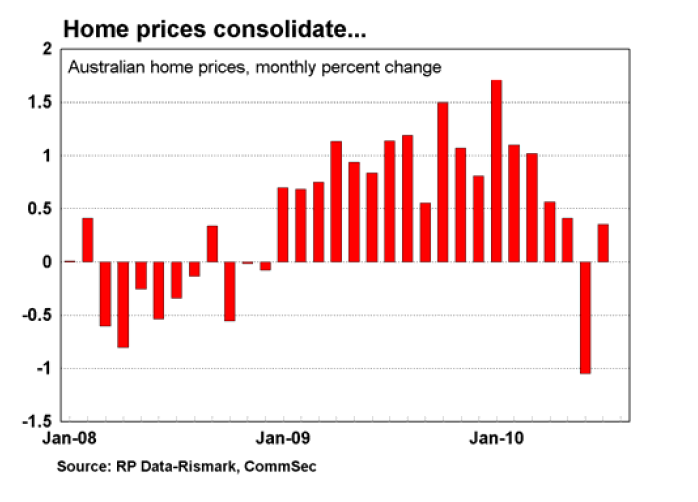
- Even the rise in property prices is the first in five months. Clearly the interest rate hikes have taken some of the steam out of the housing sector and a consolidation period will remain part of the landscape in the near term. It is important to highlight that while the housing sector is cooling it is not about to collapse in a heap. Overall CommSec expects house prices to consolidate over the next few months, but for the year as a whole we would expect prices to lift by 5-8 per cent.
- Given that all the backward looking data that plugs into the economic growth calculations has now been released, focus will turn to the tomorrows growth result. Overall CommSec expects that growth is likely to be around 0.5 per cent for the quarter – good but not great. The data on Government finances suggest that the public sector added to economic growth in the September quarter but was offset by the slide in net exports which is expected to detract 0.4 percentage points to GDP.
- There is no doubt that the domestic economy is limping along at present. Activity has been subdued with consumers keeping a tight rein on spending, while domestic businesses are also feeling the pinch of higher interest rates. In fact the latest data on private sector credit confirms that the business sector remains cautious and unwilling to borrow. Business credit has slumped for four straight months and is down over three per cent on a year ago. Until the conservative mood of Australians changes, the economy will continual to struggle and the Reserve Bank will stay on the interest rate sidelines.
What do the figures show?
Building Approvals:
- New dwelling approvals have risen for the first time in seven months, up 9.3 per cent in October. Dwelling approvals are up just 1.2 per cent on levels of a year ago.
- House approvals rose by 1.9 per cent in October (private sector up 1.5 per cent), after sliding by 1.2 per cent in September. Apartment approvals rose by 24.5 per cent in October (private sector was up 23.6 per cent) after sliding by 12.7 per cent in September. In annual terms apartment approvals are up 61.6 per cent on a year ago.
- The value of building approvals rose by 4.1 per cent in October and was lower by 18.4 per cent on a year ago.
House Prices
- The RP Data-Rismark Hedonic Australian Home Value Index rose by 0.3 per cent in seasonally adjusted terms in October, following the 0.1 per cent drop in the previous month. The monthly growth rate peaked in January at 1.7 per cent and has consistently softened since.
- House prices rose by 0.7 in the month while apartments rose 0.5 per cent.
- Home (dwelling) prices are up 6.5 per cent on a year ago with house prices up 6.4 per cent and apartment prices up 6.8 per cent.
- The biggest fall in home prices occurred in Perth (down 1.8 per cent), followed by Brisbane (down 0.2 per cent). Prices rose the most in Canberra (up 1.8 per cent), followed Darwin (up 1.7 per cent), Adelaide (up 0.9 per cent), and Sydney and Melbourne (down 0.6 per cent).
- Home prices are higher than a year ago across all capital cities but Perth (down 1.8 per cent) and Brisbane (down 0.7 per cent). Leading the way is Darwin (up 10.8 per cent), followed by Melbourne (10.7 per cent), Canberra (up 9.6 per cent), Sydney (up 8.4 per cent), and Adelaide (up 5.5 per cent).
Private sector credit
- Private sector credit (lending) rose by just 0.1 per cent in October after a flat result in September. Credit growth is up 3.3 per cent on a year ago.
- Housing credit grew by 0.5 per cent with lending to owner-occupiers up 0.6 per cent and investor housing up 0.5 per cent. Housing credit is up 7.7 per cent on a year ago. Owner occupier housing credit is up 7.5 per cent on a year ago – slowest pace in records going back 20 years. Investor housing lending remained up 8.1 per cent on a year ago – a two year high.
- Personal credit rose by 0.2 per cent in October after rising by 0.4 per cent in September. Other personal credit was up 2.4 per cent over the year. Business credit fell again in October, down 0.8 per cent after a similar fall in September. Business credit is down 3.2 per cent on a year ago.
Government Finances
Government consumption spending rose by 0.5 per cent in the September quarter after a 1.8 per cent lift in the June quarter. But public investment was up 1.9 per cent in the September quarter after remaining flat in the June quarter. General government investment rose 1.6 per cent in the quarter while spending by public corporations rose by 2.7 per cent.
Balance of Payments
- The broad measure of Australia’s external position – the current account – worsened markedly in the September quarter. The current account deficit widened by $2.4 billion to$7.8 billion in the September quarter. The balance of goods and services moderated from a surplus of $6.6 billion to a surplus of $5.8 billion. And the net income deficit widened by $1.7 billion to a deficit of $13.2 billion.
- In the September quarter exports of goods and services fell by 1.2 per cent, outpacing a 0.2 per cent fall in imports.
- The trade sector (exports less imports) will detract 0.4 percentage points to economic growth in the September quarter.
- The terms of trade (ratio of export prices to import prices) rose by 0.8 per cent to a record high of 108.6 in the September quarter.
- Net foreign debt fell by $8.3 billion to $666 billion in the September quarter.
What is the importance of the economic data?
- The Bureau of Statistics’ monthly Building Approvals release contains figures on local council approvals to build residential structures such as homes and units as well as commercial premises such as offices and shops. Approval is one of the first stages of the construction ‘pipeline’ and is thus a key leading indicator of future activity. An increase in approvals would point to stronger future activity for construction-related companies.
- The RP Data-Rismark Hedonic Australian Home Value Index is based on Australia’s biggest property database including over 280,000 sales during 2009. Unlike the ABS Index, which excludes terraces, semidetached homes and apartments, the RP Data-Rismark Hedonic Index includes all properties.
- The monthly RP Data-Rismark Hedonic Index compares month-to-month index results. Quarterly results are measured comparing end months rather than averaging each month in the quarter. For example, the first quarter of 2009 index results compare the end of March index with the end of December index.
- Private sector credit figures are released by the Reserve Bank on the last working day of the month. Credit is separated into three categories – housing, other personal and business. Private sector credit is effectively the amount of loans outstanding in the economy. If growth in lending is strong then it suggests that credit from financial institutions is freely available, underlying demand for assets such as cars and houses is firm and that the price of credit (interest rates) is attractive.
- The quarterly Balance of Payments figures have few short-term effects on financial markets. The importance of the data is merely to highlight Australia’s trading position with the rest of the world as well as the contribution of foreign trade (exports less imports) to the latest estimates of economic growth. Trade has been a drag on economic growth over the past four years with a lack of productive capacity holding back exports while rising incomes have boosted imports.
What are the implications for interest rates and investors?
- The Reserve Bank would be well aware that the forward looking data suggests that growth is likely to be subdued in the near term. Interest rates are likely to remain on hold for the next few months, to support investment and activity.
- The ongoing boost to the terms of trade will have longer term implications for the domestic economy. Driving up incomes, employment and spending.
Produced by Commonwealth Research based on information available at the time of publishing. We believe that the information in this report is correct and any opinions, conclusions or recommendations are reasonably held or made as at the time of its compilation, but no warranty is made as to accuracy, reliability or completeness. To the extent permitted by law, neither Commonwealth Bank of Australia ABN 48 123 123 124 nor any of its subsidiaries accept liability to any person for loss or damage arising from the use of this report.
The report has been prepared without taking account of the objectives, financial situation or needs of any particular individual. For this reason, any individual should, before acting on the information in this report, consider the appropriateness of the information, having regard to the individual’s objectives, financial situation and needs and, if necessary, seek appropriate professional advice. In the case of certain securities Commonwealth Bank of Australia is or may be the only market maker.
This report is approved and distributed in Australia by Commonwealth Securities Limited ABN 60 067 254 399 a wholly owned but not guaranteed subsidiary of Commonwealth Bank of Australia. This report is approved and distributed in the UK by Commonwealth Bank of Australia incorporated in Australia with limited liability. Registered in England No. BR250 and regulated in the UK by the Financial Services Authority (FSA). This report does not purport to be a complete statement or summary. For the purpose of the FSA rules, this report and related services are not intended for private customers and are not available to them.
Commonwealth Bank of Australia and its subsidiaries have effected or may effect transactions for their own account in any investments or related investments referred to in this report.


